Corona and the World Economy. What to expect for World Trade - and Investment?
←
→
Page content transcription
If your browser does not render page correctly, please read the page content below
Corona and
  the World
  Economy.
   What to
  expect for
World Trade
     and
Investment?
The lecture in a nutshell
1.     Focus on impact on international trade and investment
2.     Coronanomics (a few key economic principles)
3.     Key data and stylized facts (introduction of data sources)
4.     Before Corona: deglobalization 2.0
5.     What will happen next to the world economy?

6. Suggested readings and useful (data sources)

15/03/2020 12:21                     Coronanomics                   2
1. Focus on international trade and FDI: is
                         that not missing the key point?
Why focus on trade?

                      15/03/2020 12:21      Coronanomics            3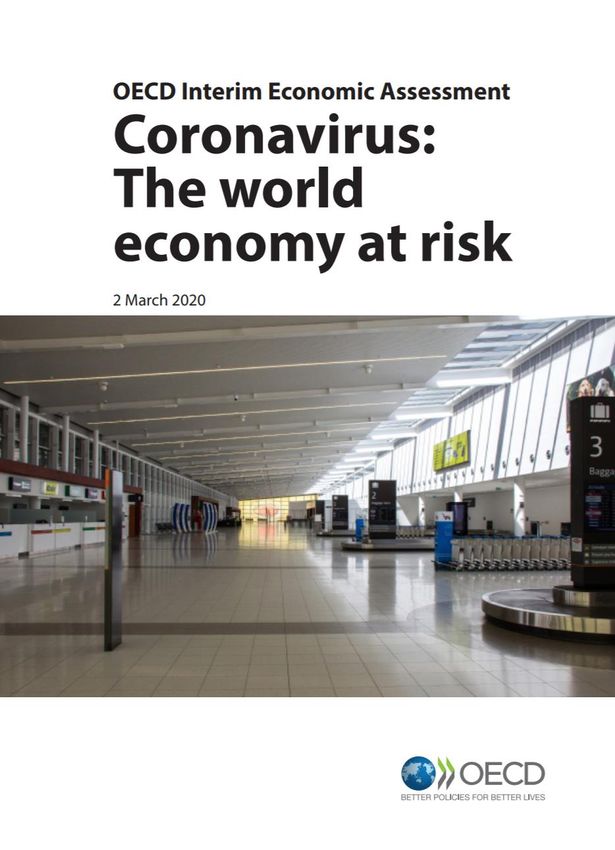
The macro-economic
                      impact of Corana is
                      serious but not
                      catastrophic
Why focus on trade?

                      15/03/2020 12:21      Coronanomics   4
Catastrophic pandemics
                      Summary of studies of the macroeconomic                                             Macro-economic impact of Ebola (GDP
                      impact of HIV/AIDS in Africa                                                        reduction, percentage points)
Why focus on trade?

                      Study                          Geographic         Annual GDP growth rate
                                                      coverage          reduction (10-15 years)
                                                                                                          Sierra Leone
                      Dixon et al (2001)            41 countries                 2% to 4%
                      World Bank (2001)              Swaziland                     1.5%
                      World Bank (2001)               Namibia                      1.1%                         Liberia
                      World Bank (2000)               Lesotho                      0.8%
                      Bonnel (2000)                 50 countries                   0.7%
                      Quattek et al (2000)          South Africa                 0.3-0.4%                       Guinea
                      BIDPA (2000)                   Botswana                      1.5%
                      Bloom et al (1995)            51 countries               Insignificant
                                                                                                                          0       2        4       6        8       10      12       14
                      Cuddington ea (1994)             Malawi                      0.3%
                      Cuddington (1993)               Tanzania                     0.7%                                         Medium term loss (upper bound)
                      Over (1992)                 30 SSA countries            0.15% to 0.6%                                     Medium term loss (lower bound)
                      Based on Dixon S, McDonald S, Roberts J. The impact of HIV and AIDS on Africa's                           Short term GDP loss
                      economic development. Bmj. 2002 Jan 26;324(7331):232-4.                            Elmahdawy, Mahmoud, et al. "Ebola virus epidemic in West Africa: global health economic
                                                                                                         challenges, lessons learned, and policy recommendations." Value in health regional issues 13
                                                                                                         (2017): 67-70.
                      15/03/2020 12:21                                                           Coronanomics                                                                          5
The global growth impact is about – 0.5
                      percentage points.
Why focus on trade?

                      OECD (March 2, 2020 forecast)           UNCTAD (March 9, 2020 forecast)

                      15/03/2020 12:21                Coronanomics                              6
The analysis of trade and investment has so
                      far been limited
                                         • Early indicators are only available with two months
Why focus on trade?

                                           delay and thus do not contain corona-information,
                                         • but current Coronablabla suggests that
                                           international economic organizations know what is
                                           happening.
                                         • Current analyses still deal with a China-only shock
                                         • This will not be a rerun of the 2008/9 world trade
                                           and investment collapse
                                         • It may strengthen the tendency towards
                                           deglobalization that started around 2008/9
                                         • From a purely scientific perspective this is an
                                           interesting natural experiment

                      15/03/2020 12:21           Coronanomics                                    7
2. Coronanomics 1.0
A.     How to read and understand pandemic graphs
B.     Supply and demand shocks
C.     Economic contagion: the role of international value chains
D.     Trade Shocks: Uncertainty and International Specialization

15/03/2020 12:21                    Coronanomics                    8
A. The endemic curve
                                                                 Epidemic (outbreak of Ebola; new
                     Pay attention to                            cases per week)
How to read Graphs

                     • What is measured?
                           • new cases
                           • number of sick people
                           • Deaths
                     • Small versus large numbers
                     • Linear versus loglinear axes
                     • Read: Our world in data “Coronavirus
                       Disease (COVID-19) – Research and
                       Statistics by Max Roser, Hannah
                       Ritchie and Esteban Ortiz-Ospina”),
                       https://ourworldindata.org/coronavir
                       us
                     15/03/2020 12:21                    Coronanomics                               9
The endemic curve
                     Endemic curve (number of current                                  Reported curve in the media (number
                     patients)                                                         of positive tests or deaths)
How to read Graphs

                       DOP: Duration of Onset to Peak
                       DOE: Duration of Onset to End
                       Source: Saito, Satoshi, et al. "Influence of media on
                       seasonal influenza epidemic curves." International
                     15/03/2020 12:21                                          Coronanomics                                  10
                       Journal of Infectious Diseases 50 (2016): 6-9.
Linear versus logarithmic representation
Linear Logarithmic
How to read Graphs
15/03/2020https://www.worldometers.info/coronavirus/
12:21 accessed
Coronanomics March 13, 2020 11B
Supply versus Demand
15/03/2020 12:21 Coronanomics 12Missing drivers
Supply versus Demand
Wealth effects
Fear
Avoidance
Costs of intervention Uncertainty, Unemployment Irrationality
15/03/2020 12:21 Coronanomics 13
business failuresSupply versus Demand
15/03/2020 12:21 Coronanomics 14c Transmission of Shocks via Global Networks
(Value Chains) faster that earlier pandemics.
International Value Chains
15/03/2020 12:21 Coronanomics 15Contagion and international value chains
Bullwhip effect 2008Q1/9Q2 (per cent Import reduction during the trade collapse versus
International Value Chains
deviation from levels at the start of 2008Q1) share of vertical specialization in trade
Unweighted simple average based on publicly reported data
from DSM, Philips, Akzo Nobel and Thyssen Krupp (Peels et
al., 2009, p. 6 and appendix)
15/03/2020 12:21 Coronanomics 16Theory of trade shocks
Trade shocks in the neoclassical
trade model
15/03/2020 12:21 Coronanomics 17Good 1 Production possibilities
Inefficient
X
Theory of trade shocks
X
Impossible
Production
possibilities
frontier
Good 2Consumption point
Theory of trade shocks
Terms of trade
Domestic production pointTheory of trade shocks
P
Import
CWelfare over time
Free
trade, full
specializa
tion utility
Theory of trade shocks
Autarky
utility
TijdLiberalization: from autarky to free trade
• Opening of trade (different price ratio’s)
• Specialization starts: growing export sector; declining
import sector
Theory of trade shocks
• Reallocation of factors of production takes time
• Consumption (welfare) follows specialization
• Note that this is a positive trade shock
• What happens if a trade shock occurs?
• So movement from free trade to autarky!Consumption point
before trade shock
Theory of trade shocks
Domestic production =
consumption after trade shockWelfare over time
Free
trade, full
Trade shock
specializ-
ation
utility
Theory of trade shocks
Autarky
utilityWelfare over time
Free
trade, full
specializa
tion utility
Theory of trade shocks
Autarky
utility
Two major implications follow from this model
• The initial impact of a trade shock is deeper that the long run impact
• For the future, firms and consumers will realize the risks of globalization and see the benefits of
lesser specialization. This is an additional force towards deglobalization3. Key data and stylized facts
https://www.worldometers.info/coronavirus/ https://ourworldindata.org/coronavirus
Stylized Facts
15/03/2020 12:21 Coronanomics 26Interpreting the data
(series start when more than 20 cases per day are reported)
New cases New cases per million population
7500 14
12
5000 10
Stylized Facts
8
2500
6
4
0
0 5 10 15 20 25 30 35 40 45 50 2
China EU 0
USA and Canada South Korea 0 10 20 30 40 50
Iran China EU USA and Canada
15/03/2020 12:21 Coronanomics 27Preliminary Findings
• China has been able to contain and the same seems true for South
Korea. The top in the number of patients occurs after about 4 weeks.
• The virus spreads and as it does the epicenter of the pandemic shifts
toward Europe and then probably the US.
• This generates a cycle in the number of patients.
Stylized Facts
15/03/2020 12:21 Coronanomics 284.Before Corona: Deglobalization 2.0
KOF globalization index 1970-2017 Openness of the world economy
60
50
40
Stylized Facts
30
20
10
0
1880 1890 1900 1910 1920 1930 1940 1950 1960 1970 1980 1990 2000 2010 2020 2030
Accessed March 15,2020
15/03/2020 12:21 Coronanomics 294.Before Corona: Deglobalization 2.0
Change in world openness by decade Change in world openness 1880-2020
3% change in openness yoy 7 yr moving average
2% 15%
1% 10%
Stylized Facts
0%
5%
-1%
0%
-2%
-5%
-3%
1910-12
1924-29
1930-38
2020-2023
1880s
1890s
1900s
1950s
1960s
1970s
1980s
1990s
2000s
2010s
-10%
1880
1888
1896
1904
1912
1930
1938
1956
1964
1972
1980
1988
1996
2004
2012
2020
15/03/2020 12:21 Coronanomics 30Some differences and similarities of the
context of the 1930s and the 2000s
1930s 2000s
Long-run reductions of trade costs ● ●
New modes of transportation ● ●
Revolution in communication ● ●
Entry of new countries (recent capitalist countries) ● ●
Key innovations ● ●
Financial innovation and capital account liberalization ● ●
Changing hegemony ● ●
Saving surplus hegemon ●
Multilateral trade governance ●
Protectionism ●
Economically motivated mass migration ●
Initial international policy coordination ●
Substantial presence of international value chains ●
15/03/2020 12:21 Coronanomics 31Trade developments
World trade collapse 2008/9 and world Trade weakness especially since mid
trade slowdown 2019
Stylized Facts
15/03/2020 12:21 Coronanomics 32World Trade (almost real time)
CPB world trade monitor 2000-2019 Container troughpout
Index number Index number
140
120
Stylized Facts
100
80
60
2000 2005 2010 2015
Date accessed: March 16 2020
15/03/2020 12:21 Coronanomics 33Other correlates of deglobalization
FDI in percent of GPP Border walls and fences 1970-2019
6 increase/decrease (lhs) number of walls (rhs)
14 80
5
12 70
10 60
4
Stylized Facts
50
8
40
3 6
30
4
2 20
2
10
0 0
1
-2 -10
0 -4 -20
1970 1980 1990 2000 2010 2020 1970 1975 1980 1985 1990 1995 2000 2005 2010 2015
15/03/2020 12:21 Coronanomics 34Private (household) flows
Remittances Global annual tourism arrivals
(%GPP 1980-2018) (millions, 1980–2018)
1500
1000
Stylized Facts
500
Source: World Bank Migration and Remittances Data, Annual data (April 2018), available at
http://www.worldbank.org/en/topic/migrationremittancesdiasporaissues/brief/migrati 0
on-remittances-data and accessed August 8, 2018 and IMF WEO data base (April
2018). 1980 1990 2000 2010
Source: Roser (2018) based on UNWTO
15/03/2020 12:21 Coronanomics 35Trump’s foreign (trade) policy is rational
• Large Country can benefit from
trade restriction (terms of trade)
• Neo-Mercantilistic: hurt the
adversary more
• Destroy the governance
Stylized Facts
instruments of the next
hegemon
• It is dangerous, but not irrational
15/03/2020 12:21 Coronanomics 36Maximum impact trade wars in 2030
(percentage change from base line)
US-China-EU trade war US-OECD trade war
GDP import openness GDP import
openness
United States -1.2 -21.0 -3.1 -45.1
Stylized Facts
China -3.5 -12.6 -4 -12.1
European Union -1.7 -2.1 -2.1 -1.6
World -1.2 -4.3 -2.5 -9.2
Source: Bollen and Rojas-Romagosa, 2018, Appendix 3.
15/03/2020 12:21 Coronanomics 37Costs and benefits of globalization
Costs
Benefits
Stylized Facts
Net benefits
Intensity of globalization
15/03/2020 12:21 Coronanomics 38Shift in marginal cost schedule
Marginal costs and benefits, optimum
intensity Shift in marginal cost schedule
Marginal benefits Marginal cost
curve shifts up
Stylized Facts
Optimum Intensity of globalization
15/03/2020 12:21 Coronanomics 395.What did we learn?
• The policy and scientific communities were prepared for a pandemic.
Pandemics cannot be prevented, they can be managed to some
extent
• The assessment is still very preliminary; we first need data The
economic impact of the corona virus is not catastrophic even when
the costs of policy measures are higher than expected
Conclusions
• Economic corona shocks are going to cascade until group immunity at
the world level is sufficient
• The corona virus increases the ‘marginal cost of intensified
globalization’ (the curve shifts up) and the optimal level of
globalization is reduced
Accessed March 15,2020
15/03/2020 12:21 Coronanomics 405. What’s next?
• We will see cascading trade shocks. Trade uncertainty will increase
and reduce international specialization. Deglobalization will deepen,
also when the virus disappears
• If we can keep our heads cool and implement trustworthy,
sustainable and transparent policies, this crisis is manageable
Conclusions
• If irrationality, denial and fake statistics get the overhand this may
develop into another global financial crisis – even though the real
economy impact is manageable
• You can help! Stay calm, stay safe.
15/03/2020 12:21 Coronanomics 41Useful Resources 15/03/2020 12:21 Coronanomics 42
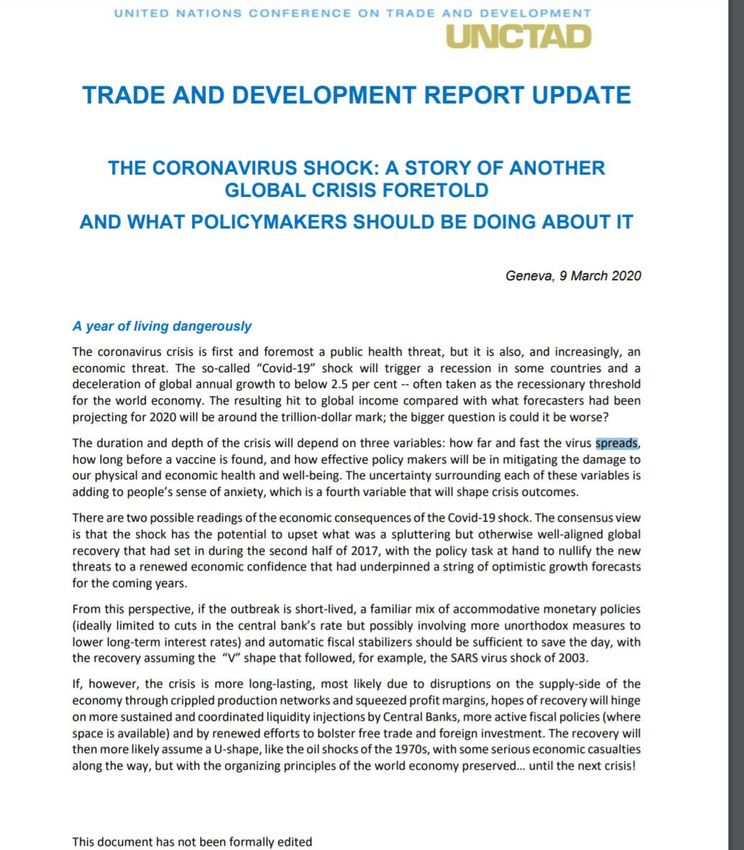
Useful Resources
• CEPR, Economics in the time of COVID-19 by Richard Baldwin, Beatrice Weder di Mauro,
  https://voxeu.org/article/economics-time-covid-19-new-ebook
• OECD Interim Economic Assessment “Coronavirus: The world economy at risk March 2020,
  http://www.oecd.org/berlin/publikationen/Interim-Economic-Assessment-2-March-2020.pdf.
• Our world in data (interactive curevs, doubling time, data) “Coronavirus Disease (COVID-19) – Research and
  Statistics by Max Roser, Hannah Ritchie and Esteban Ortiz-Ospina”), https://ourworldindata.org/coronavirus
• UNCTAD, The Coronavirus Shock: A Story of Another Global Crisis Foretold
  https://unctad.org/en/PublicationsLibrary/gds_tdr2019_update_coronavirus.pdf
• UNCTAD, Global investment monitor, Impact of The Coronavirus Outbreak on Global FDI
• Voxeu (columns for economic policy makers), : https://voxeu.org/article/oil-price-wars-time-covid-19 (Links
  to an external site.) and https://voxeu.org/article/coronavirus-and-macroeconomic-policy
• World-o-meters (interactive curves the global level; data; active cases),
  https://www.worldometers.info/coronavirus/
• WTO trade barometers, https://www.wto.org/english/res_e/statis_e/wtoi_e.htm

15/03/2020 12:21                                    Coronanomics                                                43
Useful Data Resources on International Trade
and Investment
• IMF WEO database (note that the update is due in April 2020)
  https://www.imf.org/external/ns/cs.aspx?id=28
• KOF globalization index (update due in March or April 2020) http://globalization.kof.ethz.ch/
• World development indicators (best to use the download options for the full data set)
  http://data.worldbank.org/data-catalog/world-development-indicators
• OECD (interactive): https://data.oecd.org/trade/trade-in-goods.htm and http://www.oecd.org/trade/ (also
  trade faciltation indicators)
• WTO https://www.wto.org/english/res_e/statis_e/statis_e.htm
• Global trade alert http://www.globaltradealert.org/data_extraction
• CPB World trade monitor https://www.cpb.nl/en/worldtrademonitor

15/03/2020 12:21                                   Coronanomics                                             44
Useful Resources

15/03/2020 12:21   Coronanomics   45
You can also read