Geoprocessing and Spatial Analysis - Igor Cavallini Johansen 12:00-13:30 UTC - IUSSP
←
→
Page content transcription
If your browser does not render page correctly, please read the page content below

Geoprocessing and Spatial Analysis
Training Workshop provided by the IUSSP Early Career Taskforce

Organizer and instructor:

Igor Cavallini Johansen
University of Campinas, Brazil
igorcav@unicamp.br

Tuestday 10 August 2021
12:00-13:30 UTC
Does space matter?
1- What do we mean by space?
2- How can space change population dynamics?
   • Morbidity and mortality
   • Fertility
   • Migration
3- What is geoprocessing?
4- What is spatial analysis?
5- Hands-on training

                                               2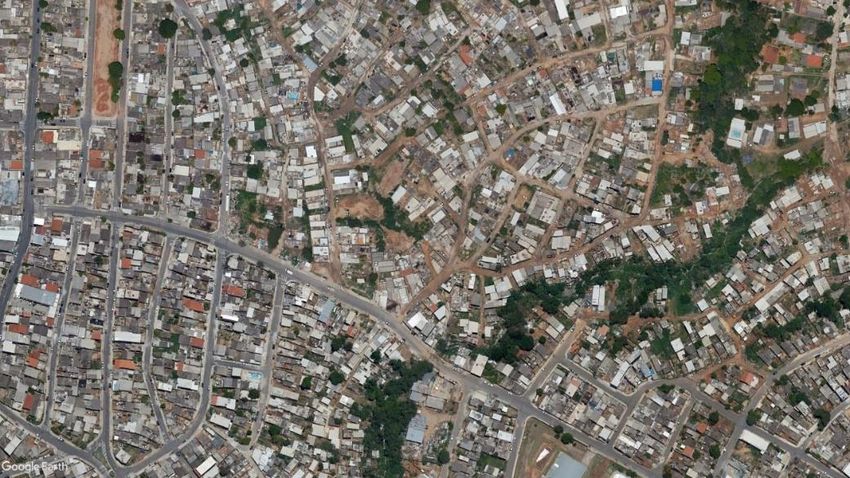
1- What do we mean by space?
• Location where we find population groups with certain
characteristics
• Place of residence, study area, working place, commuting path, etc.
• Why are these people in that location? Why do they have that
characteristics? Bidimentional relationship:
Population can change the space where it is located
Population Space
3
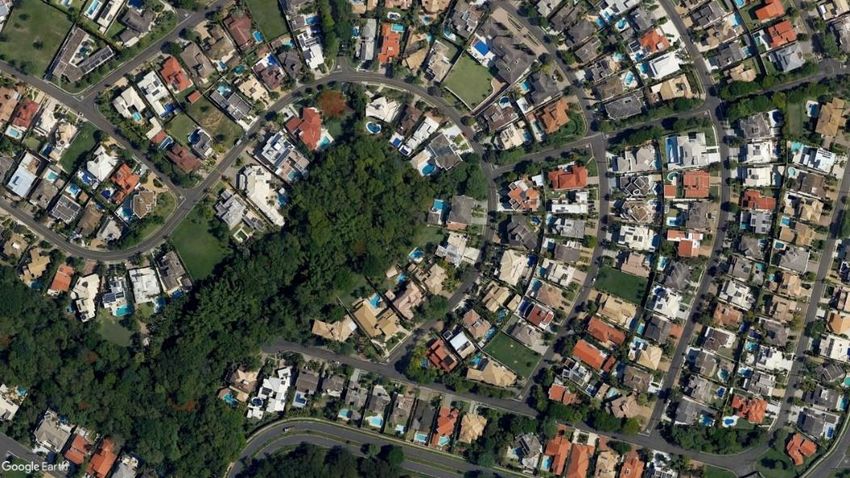
Space also can play a role on population dynamics (morbidity/mortality, fertility and migration)
A

• So... Does space matter?
    • Why?
    • How?
    • When?

Two neightborhoods in Campinas municipality, São Paulo state, Brazil (same scale)                                B

                                                                                                             4
                                                                            Source: Google Earth Pro, 2021
2- How can space change population
dynamics?
• Morbidity and mortality
   • Depending on where you live or where you spent an amount of time of your
     day (work, school, etc.) your chances to get sick and/or to die due to specific
     diseases may differ

                                                                                       5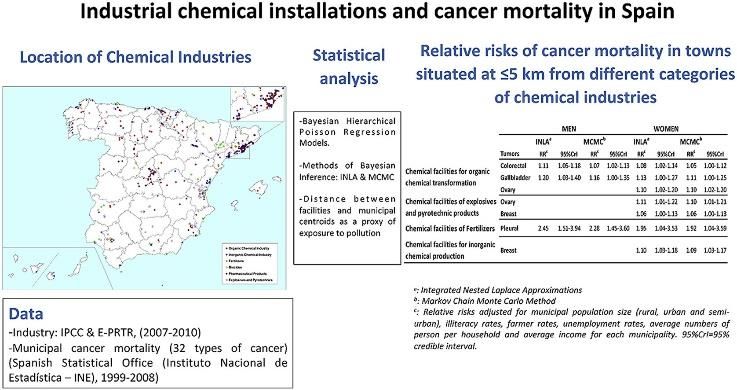
https://doi.org/10.1016/j.envpol.2019.113869

               Excess risk of cancer
          mortality was found in the
                 vicinity of chemical
                             facilities.

                                               6
• Fertility
    • Different distribution of population characteristics accross space and over
      time (and in some cases also due to environment – ex. pollution or resources
      availability) can play a role on fertility and reproductive health.

 https://doi.org/10.1016/S2214-109X(21)00082-6                                       7
• Migration
           • Space is intrinsic to migration processes. Expelling and receiveing areas have
             spacific features that are relevant for peoples’ choice to move out/in.

https://doi.org/10.1016/j.socnet.2020.09.007

                                                                                              8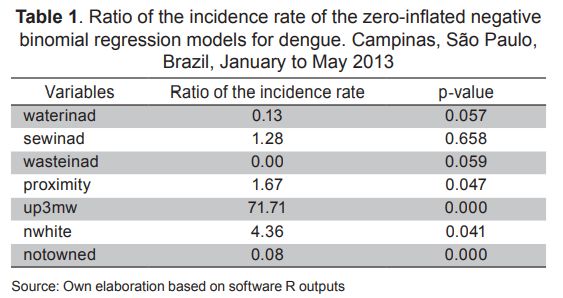
3- What is geoprocessing?
• Part of a Gegraphic Information System (GIS)
   • “A GIS can be defined as a computer system with the capacity to capture,
     store, analyze, and display geographically-referenced information. In other
     words, it is an informatics for storing and managing data that has been
     identified according to location.” (MUSA et al., 2013)

   • Utilized in a variety of fields including natural, social, engineering, and
     especially health sciences by incorporating physical, biological, cultural,
     demographic and economic data (and combining them => geoprocessing).

                                                                                   9
• In any GIS project: preparing the data and performing analysis
are key. Geoprocessing operations;

• Still part of geoprocessing operations: documentation!
(recording information about data and methodology);

• You may also use some geoprocessing tools in the last step of your
project (specifically, cartography tools).

                                                                       10
• Spatial data
• Raster images
• pixels
• satellite images
• aerial photos
Point * Events – crimes,
accidents, flu cases
• Vector data * Sample from a surface –
Line
• Features: points, lines and polygons air quality monitors, house
sales
• Attributes: size, type, length, etc.
Polygon * Objects – county centroids
(Castro, 2017)
11• Spatial data
• Raster images
• pixels
• satellite images
• aerial photos
Point
• Vector data * Collection of several
Line
• Features: points, lines and polygons sequenced locations
• attributes: size, type, length, etc. * e.g. Roads, rivers, fault
Polygon line, drains, railroad, walls
(Castro, 2017)
along borders, oil pipelines
12• Spatial data
• Raster images
• pixels
• satellite images
• aerial photos
Point
• Vector data
Line
• Features: points, lines and polygons
• attributes: size, type, length, etc. * Areal aggregations
Polygon
(Castro, 2017) * e.g. country, state, county,
census blocks/tracks, school
district, patch of vegetation,
lakes, agricultural fields,
refugee camp, flooding
13
zones• How does a GIS work? Layers’ overlay:
Then you can combine data to answer your research questions.
Overlay analysis
Ex. If you have 2 layers with the same spatial unit (polygons):
Layer 1 – Population density per km²
Layer 2 – Tuberculosis incidence
Logical (boolean) operations: relate spatial data in different layers
* What areas consist of both high population density and high
tuberculosis incidence? This would select only polygons which meet
both conditions.
http://wiki.gis.com/wiki/index.php/File:Gis_layers.png
14• GIS makes possible, but it is necessary to be carreful combining
data:
• From different sources
• From different years
• In different scales
• With different quality
• Collected for different purposes than yours!
15• Cartography
Reference: CDC, 2012
(https://www.cdc.gov/dhdsp/maps/gisx/resources/cartographic_guidelines.pdf) 164- What is spatial analysis?
• Tobler (1970) referred to “the first law of geography: everything is
related to everything else, but near things are more related than
distant things.”
https://www.springer.com/gp/book/9783642019753
17• Be carefull:
Spatial association does not necessarily imply causality. Two
things that are associated may be involved in a causal
relationship, or there may be other hidden variables that cause
the association. Although correlation is not causality, it
provides evidence of causality that can (and should) be
assessed in light of theory and/or other evidence. (MILLER,
2003)
18• Spatial autocorrelation:
• Propensity for attribute values in neighboring areas to be similar.
Gimond (2021)
19• Discern clustered regions from non-clustered regions may not
always be so obvious.
• Quantitative and objective approach to quantifying the degree
to which similar features cluster and where such clustering
occurs.
• One popular test of spatial autocorrelation is the Moran’s I
test.
20
Gimond (2021)• Global Moran’s I: measures spatial autocorrelation based on both
feature locations and feature values simultaneously
P-value 0.01,
rejecting the
null
hypothesis
of income
values as
randomly
distributed
across each
county
21
Gimond (2021)• Local Moran’s I: localized measure of autocorrelation–i.e. a map
of “hot spots” and “cold spots”.
We use Monte Carlo techniques to assess whether or not
the High-High values and Low-Low values are significant at
a confidence level of 0.05 (i.e. for P-value= 0.05).
22
Gimond (2021)• Are there other measures of spatial autocorrelation? See Getis-
Ord indexes (Getis-Ord, 1992; Ord-Getis, 1995).
• Are there other spatial analysis techniques? See Variogram and
Krigging, Geograpically Weighted Regression, Space-time analysis
(Fischer, Getis, 2010)
• Kernel density estimation
Data smoothing – tranforms points
into a raster (surface)
23• Softwares for geoprocessing and spatial analysis?
• ArcGIS: https://www.arcgis.com/index.html
• QGIS: https://qgis.org/en/site/
• Geoda: https://geodacenter.github.io/
Free
• TerraView: http://www.dpi.inpe.br/terralib5/wiki/doku.php
• R: https://www.r-project.org/
• [...] 245- Hands-on training
• Be sure you have downloaded the latest version of QGIS to your
computer
• Webiste: https://qgis.org/en/site/forusers/download.html
• Select the option highlighted in the image below
• Click to open the installer [5 min.]
• Click “Run”, then “Next”
• Select “I accept the terms
in the Licence Agreement”
• Click “Next”, then “Next” again
• Click “Install”, then “Yes” [5 min.]
• Click “Finish”
• Open the folder in your Desktop
• Double click “QGIS 3.16.9”
25• Click “Project” -> “New project”
1 Locator bar
4 2 Layers bar
5 3 Browser bar
3
4 Toolbars
5 Map canvas
6 Status bar
2
1 6 26• Save the folder with workshop files into your computer and
unzip it. Link to download:
https://drive.google.com/file/d/1MybwL0Gy_chXi5QgHdgBOq
pHVZQP15gd/view?usp=sharing
27Acknowledments
• To Tom Legrand, Nico van Nimwegen, Paul Monet, Mary Ellen
Zuppan from the International Union for the Scientific Study
of Population (IUSSP)
• To my colleagues of the the Early Career Taskforce at IUSSP
• To the São Paulo Research Foundation (FAPESP)
• To the audience, during and after the workshop
28References
Anselin, L., & Rey, S. J. (2010). Perspectives on spatial data analysis. In Perspectives on Spatial Data Analysis (pp. 1-20).
Springer, Berlin, Heidelberg.
Castro, M. C. (2017). Introduction to Spatial Methods for Public Health (Spring course). Harvard School of Public Health.
Boston, USA.
Centers for Disease Control and Prevention. (2012). Cartographic guidelines for public health. Centers for Disease Control
and Prevention.
Fischer, M. M., & Getis, A. (Eds.). (2010). Handbook of applied spatial analysis: software tools, methods and applications.
Berlin: springer. Available in: https://link.springer.com/book/10.1007/978-3-642-03647-7. Accessed in 1 Aug. 2021.
Getis, A. and J.K. Ord. 1992. "The Analysis of Spatial Association by Use of Distance Statistics" in Geographical Analysis 24(3).
Gimond, M. (2021). Intro to GIS and Spatial Analysis. Available in: https://mgimond.github.io/Spatial/index.html. Accessed in
01 Aug. 2021.
Miller, H. J. (2004). Tobler's first law and spatial analysis. Annals of the Association of American Geographers, 94(2), 284-289.
Musa, G. J., Chiang, P. H., Sylk, T., Bavley, R., Keating, W., Lakew, B., ... & Hoven, C. W. (2013). Use of GIS mapping as a public
health tool–from cholera to cancer. Health services insights, 6, HSI-S10471.
Ord, J.K. and A. Getis. 1995. "Local Spatial Autocorrelation Statistics: Distributional Issues and an Application"
in Geographical Analysis 27(4).
Tobler WR (1970) A computer movie simulating urban growth in the Detroit region. Econ Geogr 46:234–240.
29Additional learning references
QGIS Training Manual: https://docs.qgis.org/3.16/en/docs/training_manual/
A Gentle Introduction to GIS: https://docs.qgis.org/3.16/en/docs/gentle_gis_introduction/
Cartographic concepts and definitions (UCLA): https://guides.library.ucla.edu/c.php?g=180224&p=5416287
Design principles for cartography (ESRI): https://www.esri.com/arcgis-blog/products/product/mapping/design-principles-for-
cartography/
Cartography guide: https://www.axismaps.com/guide
Coursera: https://www.coursera.org/specializations/gis-mapping-spatial-analysis
Spatial Data, Spatial Analysis, Spatial Data Science (lecture by Luc Anselin at the University of Chicago):
https://www.youtube.com/watch?v=MmCYeJ27DsA&ab_channel=GeoDaSoftware
Geospatial Analysis 6th Edition, 2020 update: https://www.spatialanalysisonline.com/HTML/index.html
Journal to follow:
Spatial Demography
https://www.springer.com/journal/40980
30Free spatial data sources
• Shapefiles by country: https://gadm.org/maps.html
• Different layers with a variety of scales:
https://www.openstreetmap.org/
• See countries’s statistical office for shapefiles of each country
• Gridded Population of the World:
https://sedac.ciesin.columbia.edu/data/collection/gpw-v4
• Satellite imagery: https://earthexplorer.usgs.gov/
31Thank you!
Igor Cavallini Johansen (UNICAMP)
igorcav@unicamp.br
32IUSSP International Population Conference 5-10 December 2021 A virtual conference with 25 general themes and a special focus on COVID-19 Registration opens on 15 September
You can also read