Overview of urban heat island formations in cities - Chandana Mitra Associate Professor Department of Geosciences Auburn University, Alabama - SciLine
←
→
Page content transcription
If your browser does not render page correctly, please read the page content below
Overview of urban heat island
    formations in cities

           Chandana Mitra
            Associate Professor
         Department of Geosciences
         Auburn University, Alabama
Why do cities have a different climate?
Cities as heat generators
If we were all in a room!!

                                               ₌
                                                            People in cities + cars +
300 watts (average) X 100
                                                            buildings = HEAT generated
people = 30,000 watts of HEAT
energy
    The average human, at rest, produces around 100 watts of power. [2] Over periods of a few minutes,
    humans can comfortably sustain 300-400 watts; and in the case of very short bursts of energy, such as
    sprinting, some humans can output over 2,000 watts.
                                                                                                                                                3
                                                                       http://large.stanford.edu/courses/2014/ph240/labonta1/
                                                                       O. C. Ozcanli, "Turning Body Heat Into Electricity," Forbes, 8 Jun 10.
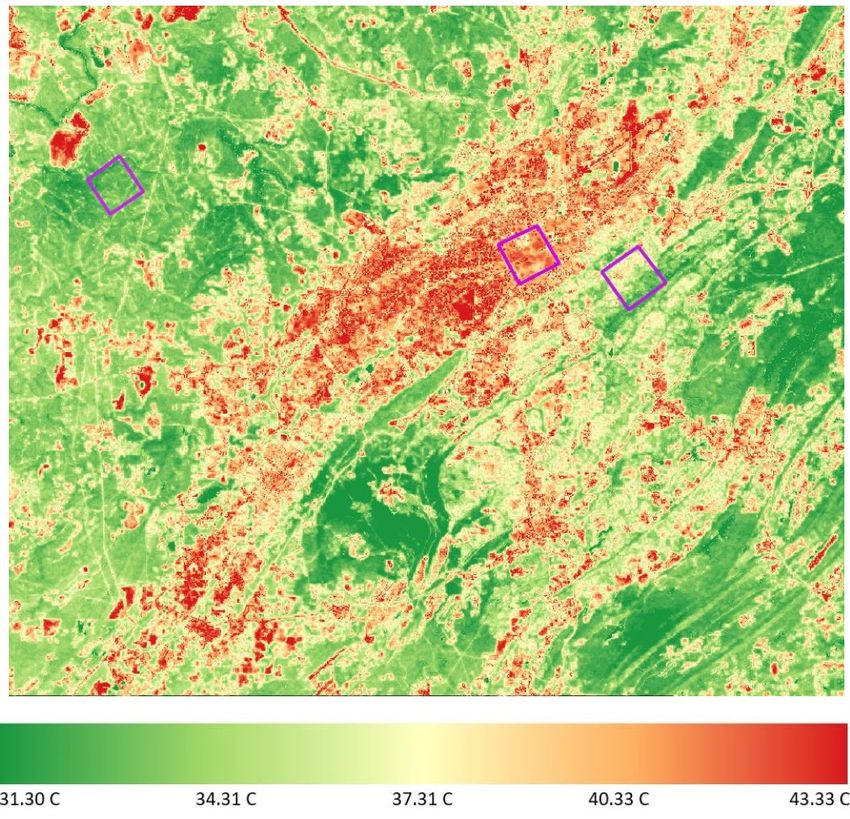
Urban Heat Island Intensity
Difference in temperature between the urban area and surrounding rural area.
Generally 3°-5° F difference.
Surfaces that were once permeable and moist become impermeable and
dry. These changes cause urban regions to become warmer than their rural
surroundings, forming an "island" of higher temperatures in the landscape.
http://www.youtube.com/watch?v=t-sXHl3l-rM
4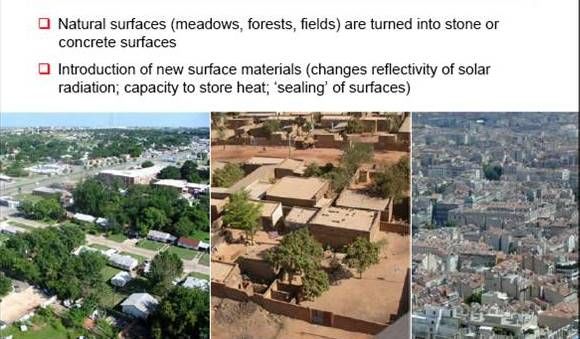
UHI effect is proportional to the size of the city – but all cities, large
and small, have them.
The annual mean air temperature of a city with one million or more people
can be 1.8 to 5.4°F (1 to 3°C) warmer than its surroundings, and on a clear,
calm night, this temperature difference can be as much as 22°F (12°C).
Heat Island effect often decreases as city size decreases.
Seasonality – summer and winter
"warm island" among the "cool sea"
http://www.nctcog.org/trans/sustdev/SDGreen/UrbHeatIsl.asp
https://www.epa.gov/sites/default/files/2014-06/documents/basicscompendium.pdf
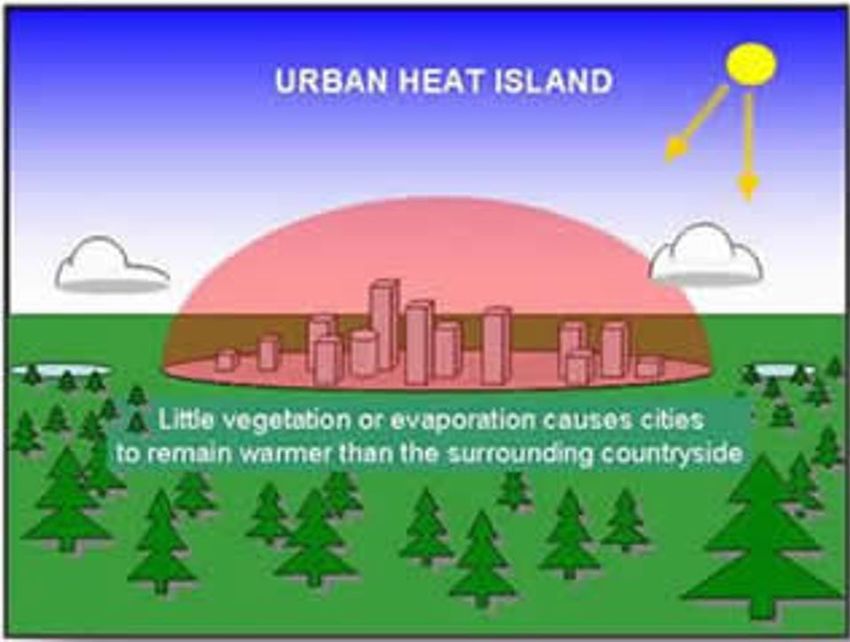
Hot-lanta
                               Urban temperature anomaly
NASA

            https://tackyraccoons.com/2013/01/30/hot-lanta-in-may/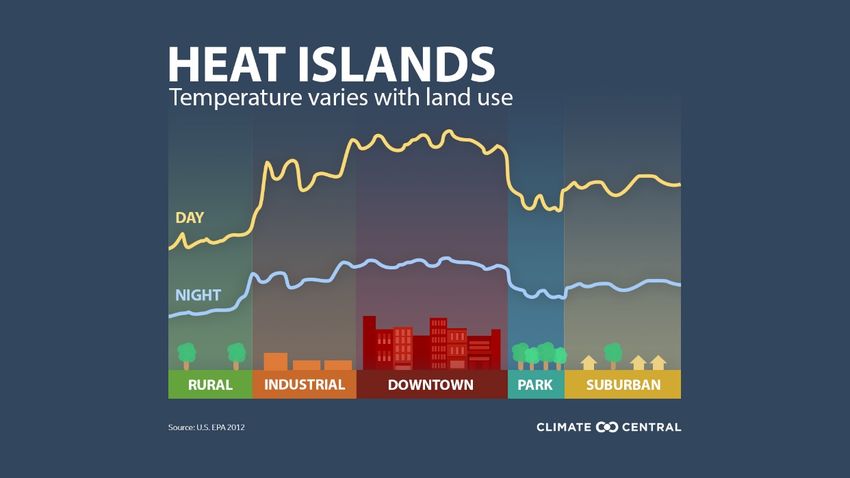
Small and Medium sized cities also matter!!

    Birmingham (AL) average UHI intensity
    of 3.84°F for spring and summer 2014.
    Population – 212,297 (2019)

            peaked during the night

    Auburn-Opelika (AL) average UHI
    intensity of 4.39°F for spring and summer
    2014.
    Population – 160,000 (2016)

           peaked during the day

                                                Measurements done using iButton sensors
Hug and Mitra 2014                                                                        7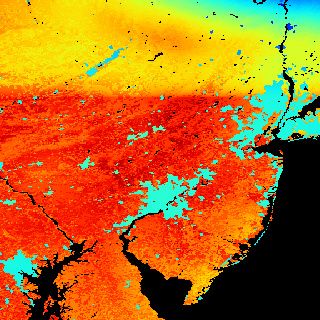
Heat Waves and connection to Urban Heat Islands
Heat Wave definitions
There are > 15 definitions for heat waves in the literature
The most important ones out there are –
NWS – 3 consecutive days with Tmax at least of 90˚ F
(32.22˚ C) – Absolute numbers
Robinson (2001): At least 2 days of Tmin >26.7 ˚C or Tmx
>40.6 ˚C – Relative numbers
Steadman (1984): Tmax (apparent) > 85th, 90th and 95th
percentile (1 day) – relative numbers
Jorge Gonzalez 2021
Dynamical linkage and feedback among atmospheric
 blocking, drought, heatwave and urban heat island across
 multiple scales

                                                                           Around 2˚ F (1˚C) Urban Heat Island intensity increase
                                                                           over Birmingham AL because of blocking, drought and
                                                                           heatwave – August 13th – 17th 2007.

                                                                           Limitation of study was less data points in Birmingham

Dong, L., Mitra, C., Greer, S., & Burt, E. (2018). The dynamical linkage of atmospheric blocking to drought, heatwave and urban heat island in southeastern
US: A multi-scale case study. Atmosphere, 9(1), 33.
Urban Heat Island effects on other weather
phenomenonUrban heat effecting precipitation
Atmospheric destabilization
Risk: Urban Storms
Modification of moisture and thermodynamic processes,
such as changes to the surface energy balance (SEB) that
causes the UHI and initiates a thermally driven circulation.
These can alter atmospheric convection and convergence of Convergence
winds over and downwind of cities and uplift
Country
breeze
City surface
In circumstances where the
regional airflow is very weak, a
strong urban heat island
could produce convergence over
the city.
Seino et al. 2018 https://doi.org/10.1016/j.uclim.2016.11.007 12Evaporation and Lightning in cities
This visualization shows evaporation rates predicted by the
NASA Land Information System (LIS) for a day in June 2001.
Stallins and colleagues (2006, 2008) 13Thank you!! Questions please
Bibliography:
Dong, L., Mitra, C., Greer, S., & Burt, E. (2018). The dynamical linkage of atmospheric blocking to drought, heatwave and urban heat island
in southeastern US: A multi-scale case study. Atmosphere, 9(1), 33.
Hug, W.A. The Study of Urban Heat Islands in the Birmingham and Auburn-Opelika, Alabama Urban Areas, Using Satellite and
Observational Techniques; M.S. thesis of Auburn University, 149pp, 2014.
Chieppa, J., Bush, A., & Mitra, C. (2018). Using “Local Climate Zones” to detect urban heat island on two small cities in alabama. Earth
Interactions, 22(16), 1-22.
Saha, P., Bandopadhyay, S., Kumar, C., & Mitra, C. (2020). Multi-approach synergic investigation between land surface
temperature and land-use land-cover. Journal of Earth System Science, 129(1), 1-21.
González, J. E., Ramamurthy, P., Bornstein, R. D., Chen, F., Bou-Zeid, E. R., Ghandehari, M., ... & Niyogi, D. (2021). Urban
climate and resiliency: A synthesis report of state of the art and future research directions. Urban Climate, 38, 100858.
Seino et al. 2018 https://doi.org/10.1016/j.uclim.2016.11.007
https://www.researchgate.net/figure/Scales-of-Atmospheric-Motion-in-Reference-to-Meteorological-Phenomena-Source-
Bolhun_fig3_304204988
Binita, K. C., Shepherd, J. M., King, A. W., & Gaither, C. J. (2021). Multi-hazard climate risk projections for the United States. Natural
Hazards, 105(2), 1963-1976.
https://www.bloomberg.com/news/articles/2021-07-20/for-cities-climate-adaptation-has-a-new-urgency?srnd=citylab
https://www.arcgis.com/apps/dashboards/73e329457b6644e7aeff13ecce43c8d8
https://www.epa.gov/heatislands/heat-island-community-actions-database
https://news.agu.org/press-release/us-wide-non-white-neighborhoods-are-hotter-than-white-ones/
Rose, L. S., Stallins, J. A., & Bentley, M. L. (2008). Concurrent cloud-to-ground lightning and precipitation enhancement in the Atlanta,
Georgia (United States), urban region. Earth Interactions, 12(11), 1-30.Thank you!! Questions please
Effects of Urban Heat on Health
1020

1000

980
           Jaime Madrigano, Sc.D., M.P.H.
960
                 RAND Corporation
940

920
                                            1
Health Impacts of Heat
1020
• Emergency department visits, hospitalizations, and deaths all
rise during extreme heat events.
1000
• Heat cramps, heat exhaustion and heatstroke
980 • Exposure to high temperatures increases risk for many other
conditions
960
– Cardiovascular disease
– Kidney disease
– Respiratory disease
940 – Poor reproductive outcomes
– Behavioral and mental health conditions
920
2Public Health Burden of Heat
1020
• A Silent Killer
1000
• On average, heat is associated with more fatalities than
other weather-related events
980
• Deaths and illness directly attributable to heat are only a
portion of total health impacts
960
– Excess deaths an illness can be estimated from statistical
approaches
940
920
3Heat Vulnerability and Inequity
1020
• Not an equal-opportunity killer
1000 • Vulnerability: exposure, sensitivity, adaptive capacity
980
• Populations particularly vulnerable to heat-related illness and
death
– Older populations, those with chronic conditions, pregnant women
960 – Socially isolated individuals
– Communities of color and low-income populations
940
• Vulnerability linked to residential neighborhood and indoor
home environment conditions
920
4Heat Risk Perceptions
1020
• Climate change is impacting heat-related illness and death
1000 now
• Perception of health risk due to extreme heat varies across
980 populations
– Age
960 – Climate
– Social vulnerability
940
• Health is an important motivator in discussions of climate
change
920
5Additional Resources
1020• Sarofim, M.C., S. Saha, M.D. Hawkins, D.M. Mills, J. Hess, R. Horton, P. Kinney, J. Schwartz, and A. St. Juliana, 2016: Ch. 2: Temperature-Related
Death and Illness. The Impacts of Climate Change on Human Health in the United States: A Scientific Assessment. U.S. Global Change Research
Program, Washington, DC, 43–68. http://dx.doi.org/10.7930/J0MG7MDX
• Weinberger, Kate R., et al. "Estimating the number of excess deaths attributable to heat in 297 United States counties." Environmental Epidemiology
(Philadelphia, Pa.) 4.3 (2020). https://www.ncbi.nlm.nih.gov/pmc/articles/PMC7289128/
1000
• Shindell, Drew, et al. "The effects of heat exposure on human mortality throughout the United States." GeoHealth 4.4 (2020): e2019GH000234.
https://doi.org/10.1029/2019GH000234
• Gronlund, Carina J. "Racial and socioeconomic disparities in heat-related health effects and their mechanisms: a review." Current epidemiology
980 reports 1.3 (2014): 165-173. https://www.ncbi.nlm.nih.gov/pmc/articles/PMC4264980/
• Madrigano, Jaime, et al. "A case-only study of vulnerability to heat wave–related mortality in New York City (2000–2011)." Environmental health
perspectives 123.7 (2015): 672-678. https://doi.org/10.1289/ehp.1408178
960 • Madrigano, Jaime, et al. "Awareness, risk perception, and protective behaviors for extreme heat and climate change in New York City." International
journal of environmental research and public health 15.7 (2018): 1433. https://www.mdpi.com/1660-4601/15/7/1433/htm
• Vicedo-Cabrera, Ana Maria, et al. "The burden of heat-related mortality attributable to recent human-induced climate change." Nature climate change
11.6 (2021): 492-500. https://www.nature.com/articles/s41558-021-01058-x
940 • Howe, Peter D., et al. "Public perceptions of the health risks of extreme heat across US states, counties, and neighborhoods." Proceedings of the
National Academy of Sciences 116.14 (2019): 6743-6748. https://doi.org/10.1073/pnas.1813145116
• Kotcher, John, et al. "How Americans respond to information about global warming's health impacts: evidence from a national survey
experiment." GeoHealth 2.9 (2018): 262-275. https://doi.org/10.1029/2018GH000154
920
6Follow Up Media References
1. https://www.nytimes.com/interactive/2019/08/09/climate/city-heat-islands.html
2. https://www.nytimes.com/interactive/2020/08/24/climate/racism-redlining-cities-global-
warming.html
3. https://e360.yale.edu/features/can-we-turn-down-the-temperature-on-urban-heat-islands
4. https://www.npr.org/2021/07/04/1012978318/climate-change-and-heat-waves-have-brutal-
effect-on-u-s-cities-infrastructure
5. https://www.wweek.com/news/city/2021/07/14/this-is-the-hottest-place-in-portland/
6. https://www.vox.com/22557563/how-to-redesign-cities-for-heat-waves-climate-change
7. https://timesofindia.indiatimes.com/home/sunday-times/heat-waves-are-also-a-social-justice-
issue-as-the-poor-often-live-in-the-hottest-parts-says-climate-researcher-vivek-
shandas/articleshow/84098468.cms
8. https://www.popsci.com/environment/american-jobs-plan-climate/
9. https://grist.org/ask-umbra-series/air-conditioning-heats-the-climate-so-how-can-i-keep-cool/
10. https://www.nationalgeographic.com/pages/topic/nat-geo-explores-video-series#3391ef35-
0ca8-4a04-93b5-dd8543e5d71dYou can also read