Abandoned in their Neighborhoods: Youth Joblessness amidst the Flight of Industry and Opportunity - Great Cities Institute
←
→
Page content transcription
If your browser does not render page correctly, please read the page content below

Abandoned in their Neighborhoods:
Youth Joblessness amidst the Flight of
      Industry and Opportunity
                         Produced for Alternative Schools Network
            By University of Illinois at Chicago Great Cities Institute
                                          Youth Employment Hearings
                                              Chicago Urban League
                                                   January 30, 2017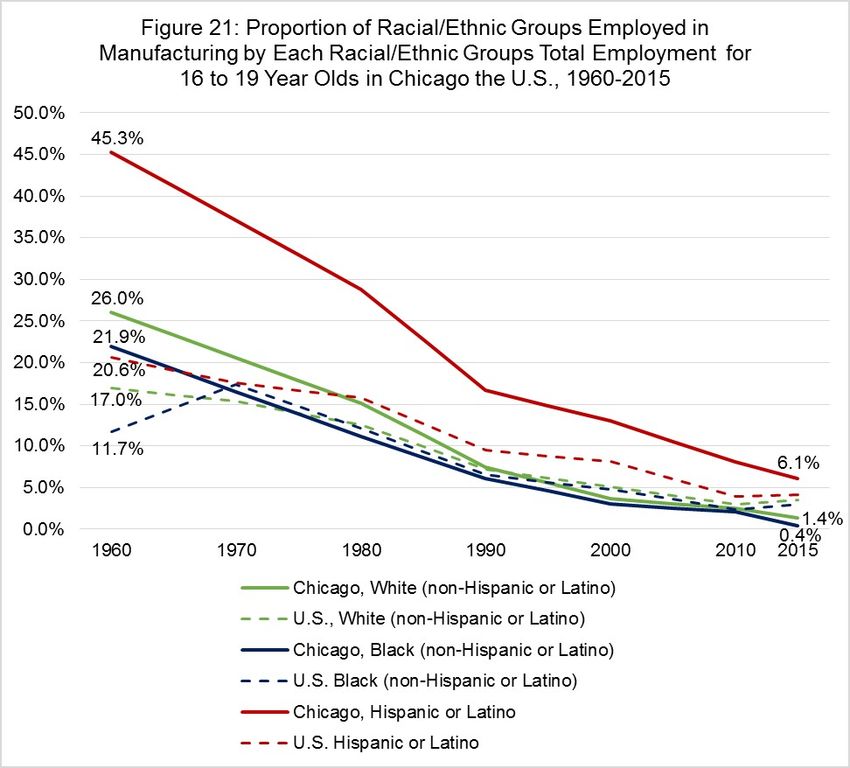
“We Want to Work”
• “The Money I Earned Gave me Power and Sense
  of Responsibility.”

• “Young People Can’t Be, What They Can’t See.”

• ”A Good Job Can
Change a Person’s
Life”

                               (Zbigniew Bzdak / Chicago Tribune)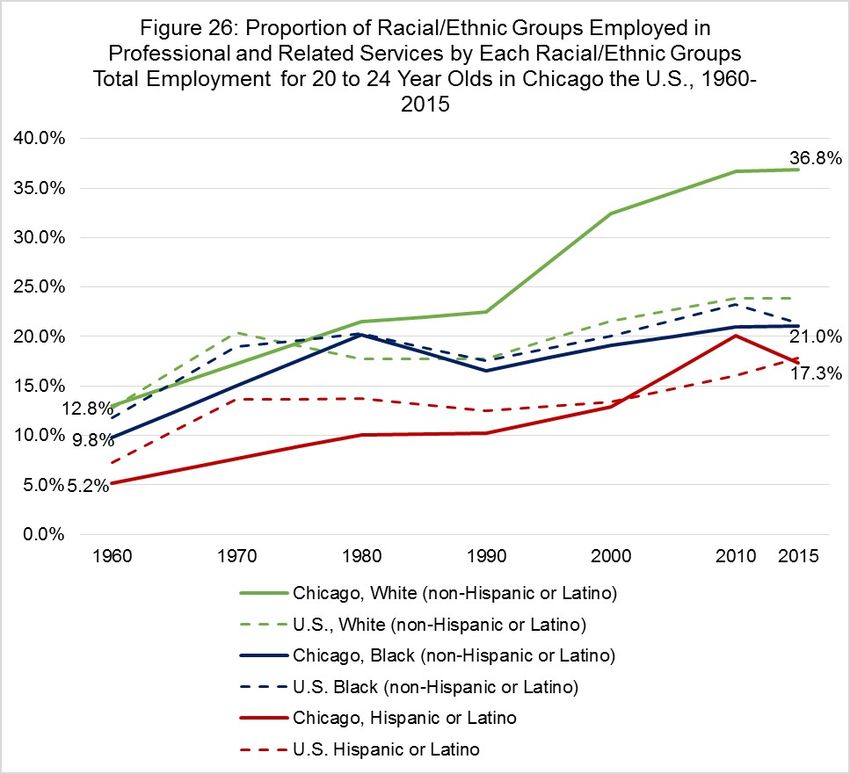
Young People Tell Us:
          More Jobs, Less Violence
• “Jobs solve violence. If you are busy working, you
  don’t have time for violence.”
• “There are so many people who don’t have a job, and
  they get into the wrong things.”
• “Bring youth employment… everyone wants drugs and
  violence to stop, well then…get us off these streets and
  get us in some work clothes and you will see the
  change.”
• “We need these jobs out here; it’s real bad out here.”
• “If you want to save lives, you want to see a difference,
  give these teens jobs.”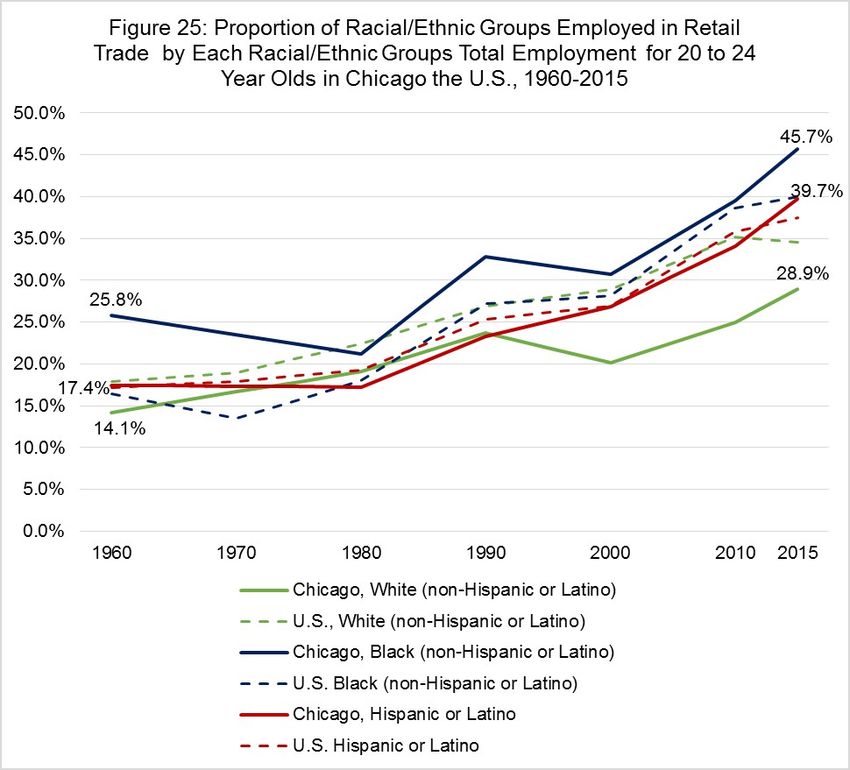
More Jobs, Less Violence
While not everyone who is without a job engages in
violence, these insights from young people suggest that
of those who do, economic reasons are a motivating
factor. Further, they suggest that providing jobs deters
them from seeking an economic solution that may
involve them in illegal activities. While rampant
joblessness may not completely explain violence, we
learn from young people that it is no doubt a
contributing factor and conversely, providing a job can
mitigate the conditions that lead to criminal activities.
Supplement Voices with Research
• In 2016 demonstrated persistence & severity:
  – Joblessness was exceedingly high for young
    people of color, especially Black (Non-Hispanic)
  – Joblessness increased over time – chronic
  – Joblessness was directly related to racial
    segregation – concentrated
  – Joblessness was comparatively worse in Chicago
  – Joblessness cannot be seen apart from what is
    happening in the neighborhoods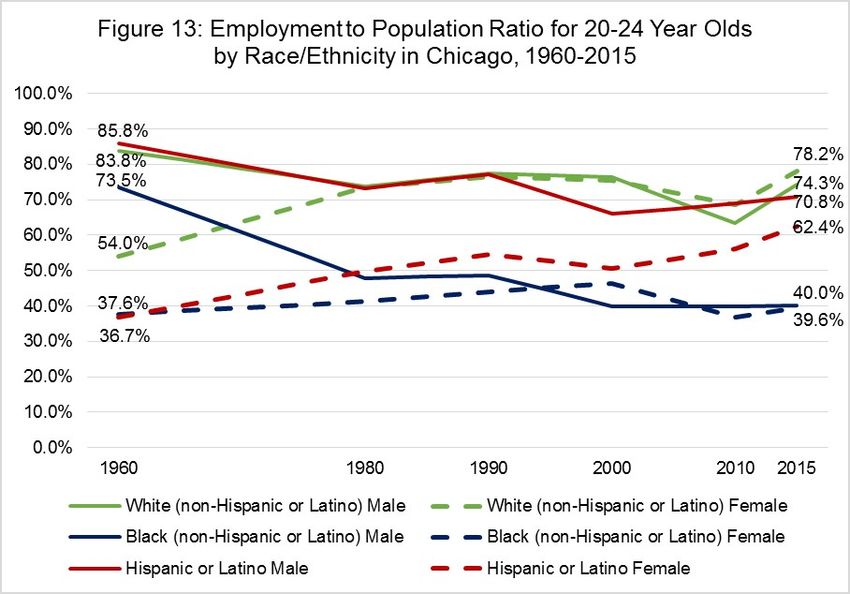
In 2017, we wanted to know
– How did 2015 employment/population figures
  compare to 2014? Did joblessness numbers improve?
– Given the chronic nature of joblessness, if we went
  further back in time, what trends would we see?
– Track data on the relationship between concentrated
  Joblessness and racial segregation
– Continue the comparisons to , the U.S., Los Angeles
  and New York - is joblessness in Chicago still
  comparatively worse? If so, why?
– If joblessness is tied to what is happening in
  neighborhoods, then what else can we about them?
Joblessness persists 2014 to 2015,
    particularly for young Black men and
                    women
• In 2015, employment conditions in Chicago were worse than in
  Illinois and the U.S. for 16 to 19 and 20 to 24 year olds (see Figures
  1, 2, and 3).
• The percent of jobless Black (non-Hispanic or Latino) 20 to 24 year
  olds in Chicago increased from 58.7 percent in 2014 to 60.2 percent
  in 2015 (see Appendix C Figure C2).
• Black (non-Hispanic or Latino) 20 to 24 year old women in Chicago
  had a higher jobless rate (60.4 percent) than New York City (44.7),
  Los Angeles (44.7), Illinois (50.4), and the U.S. (38.3) in 2015 (see
  Table 2).
• In 2015, Black (non-Hispanic or Latino) 20 to 24 year old men in
  Chicago had a higher jobless rate (60 percent) than New York City
  (50.3), Los Angeles (48.4), Illinois (51.6), and the U.S. (45.2) (see
  Figure 16).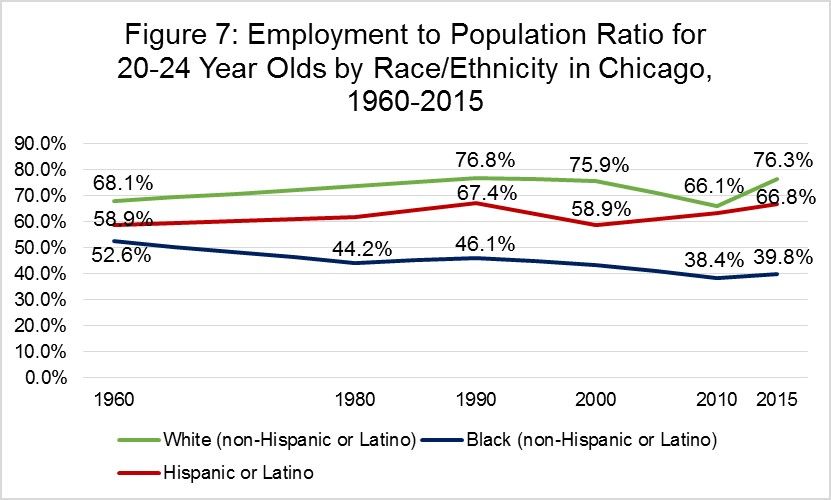
20 to 24 Out of Work
                    Change from 2014 to 2015?
• Black Males Out of Work Rates Went Up
                  Percent of 20 to 24 Year Olds Who Were Out of Work by Race/Ethnicity in the
                                        U.S., Illinois, and Chicago, 2015

                                                                                                              58.7%                    60.2%
                                                             56.6%
                                                                                         51.0%
          44.8%
                                   41.8%
                34.8%                                                                                               36.8%
                                         33.6%                                                                                               33.2%
     31.4%                     30.3%                              30.2%
                                                       28.4%                         29.2%   29.2%
                                                                                                         24.2%                    23.7%

           2014                     2015                     2014                        2015                  2014                     2015
                        U.S.                                              Illinois                                        Chicago

                                 White (non-Hispanic or Latino)      Black (non-Hispanic or Latino)     Hispanic or Latino

Data Source: 2014 and 2015 American Community Survey, public use files. Tabulations by Great Cities Institute, University of Illinois at Chicago.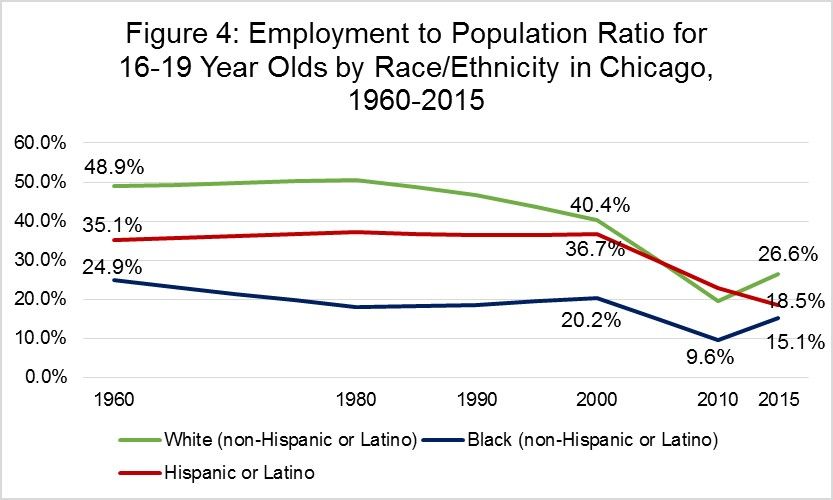
16 to 19 Out of School, Out of Work
        Change from 2014 to 2015?
• In Chicago, increased for all groups
                        Percent of 16 to 19 Year Olds Who Were Out of Work and Out of School by
                                   Race/Ethnicity in the U.S., Illinois, and Chicago, 2015
                                                                 12.9%                                                12.5%                        12.9%

             10.8%                     10.5%
                      9.3%                                                                         9.5%
                                                  8.6%                                                                                                        8.2%
                                                                                                          7.4%                 7.8%
                                                                          7.1%
        5.9%                                                                                                                                    6.3%
                                    5.7%                    5.6%                                                 5.6%
                                                                                            5.0%

               2014                        2015                    2014                            2015                 2014                           2015
                             U.S.                                                Illinois                                             Chicago

                                     White (non-Hispanic or Latino)        Black (non-Hispanic or Latino)        Hispanic or Latino

Data Source: 2014 and 2015 American Community Survey, public use files. Tabulations by Great Cities Institute, University of Illinois at Chicago.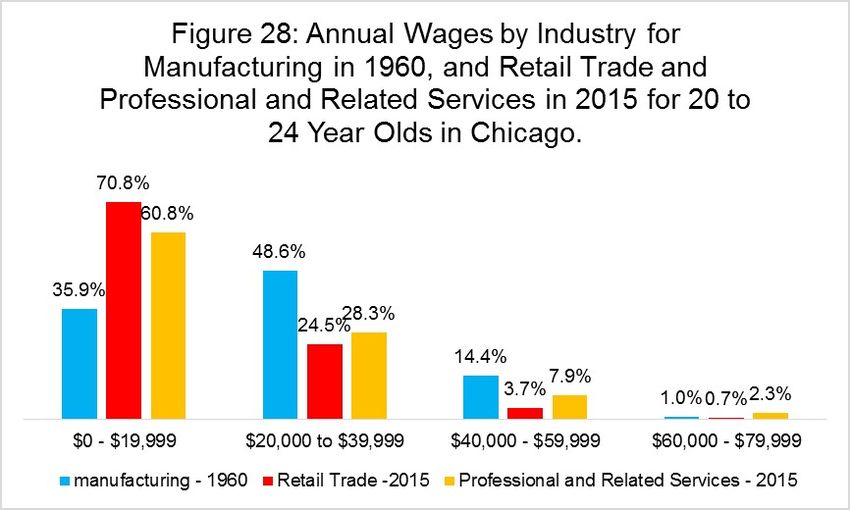
20 to 24 Out of School, Out of Work
         Change from 2014 to 2015?
• In Chicago, Latino number up, Blacks about the
  same, whites slightly worse
                     Percent of 20 to 24 Year Olds Who Were Out of Work and Out of School
                       by Race/Ethnicity in the U.S., Illinois, and Chicago, 2014 and 2015
                                                             38.6%                                          39.5%                 39.1%
                                                                                           32.6%
                27.8%
                                        24.9%
                     19.8%                  18.8%                                                                                        20.8%
                                                                                               16.5%               18.2%
           14.3%                                                    16.0%
                                    13.4%                                              11.9%
                                                        10.5%
                                                                                                         6.3%                  6.9%

                2014                    2015                     2014                      2015                 2014                  2015
                             U.S.                                           Illinois                                   Chicago

                                White (non-Hispanic or Latino)          Black (non-Hispanic or Latino)    Hispanic or Latino

Data Source: 2014 and 2015 American Community Survey, public use files. Tabulations by Great Cities Institute, University of Illinois at Chicago.
20 to 24 Out of School, Out of Work
MALES Change from 2014 to 2015?
• Black Males, though slightly improved in 2015,
fare worse than other groups in all places
Percent of 20 to 24 Year Old Males Who Were Out of Work and Out
of School by Race/Ethnicity in the U.S., Illinois, and Chicago, 2014
and 2015
44.7% 45.7%
42.8%
36.7%
32.1%
29.2%
18.0% 20.0%
17.5% 16.4% 17.6%
14.0% 13.3% 13.1% 13.6%
11.3%
8.4% 8.5%
2014 2015 2014 2015 2014 2015
U.S. Illinois Chicago
White (non-Hispanic or Latino) Black (non-Hispanic or Latino) Hispanic or Latino
Data Source: 2014 and 2015 American Community Survey, public use files. Tabulations by Great Cities Institute, University of Illinois at Chicago.16-19 Year Old Joblessness Map 10: Jobless Rate for 16 to 19 Year Olds by Chicago Community Areas Data Source: 2011-2015 American Community Survey 5-Year Estimates, U.S. Census Bureau. Map Prepared by Great Cities Institute, University of Illinois at Chicago.
Joblessness Continues to be Concentrated and
     Directly related to Racial Segregation
     Map 11: Jobless Rate for 20 to 24 Year Olds by Chicago Community
     Areas

     Data Source: 2011-2015 American Community Survey 5-Year Estimates, U.S. Census Bureau.
     Map Prepared by Great Cities Institute, University of Illinois at Chicago.
Joblessness reflects a long-term trend,
made worse by the recession
• 20 to 24 year olds were worse off in Chicago in 2015 than
in 1960. (In Illinois and the U.S., this trend is reversed,
where they were better off in 2015 than 1960).
• The Great Recession severely impacted every
racial/ethnic group of 16 to 19 year olds in Chicago,
Illinois and the U.S. but had the largest impacts in
Chicago. Even after a period of recovery from 2010 to
2015, no group of 16 to 19 year olds in Chicago, Illinois
and the U.S. had employment to population ratios at pre-
recession levels.
• Latinos in Chicago were the only racial/ethnic group of 16
to 19 year olds that did not show any recovery after the
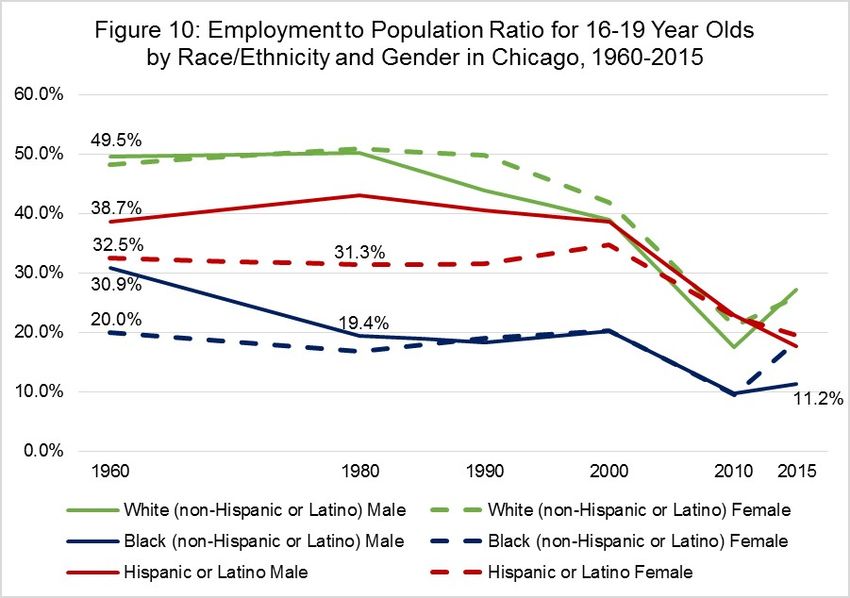
recession but continued to decline after 2010.From 1960 to 2015 in Chicago, employment to population ratios for
16 to 19 year olds declined most severely after the Great Recession,
after which they showed only a slight rebound except Latinos who
continued to decline
Data Source: 1960, 1980, 1990 and 2000 Decennial Censuses and 2010 and 2015 American Community
Survey, public use files. Tabulations by Great Cities Institute, University of Illinois at Chicago.Black 20 to 24 Year Old Worse off in
2015 than 1960 - Gaps with Whites
Widened, Worse after Recession
Data Source: 1960, 1980, 1990 and 2000 Decennial Censuses and 2010 and 2015 American
Community Survey, public use files. Tabulations by Great Cities Institute, University of Illinois at
Chicago.16 to 19 year old Latino Men and Women Continue
Downward Slope Since Recession
Data Source: 1960, 1980, 1990 and 2000 Decennial Censuses and 2010 and 2015 American Community
Survey, public use files. Tabulations by Great Cities Institute, University of Illinois at Chicago.1960 – 2015 20 to 24 year olds by
race/ethnicity and gender
Data Source: 1960, 1980, 1990 and 2000 Decennial Censuses and 2010 and 2015 American Community
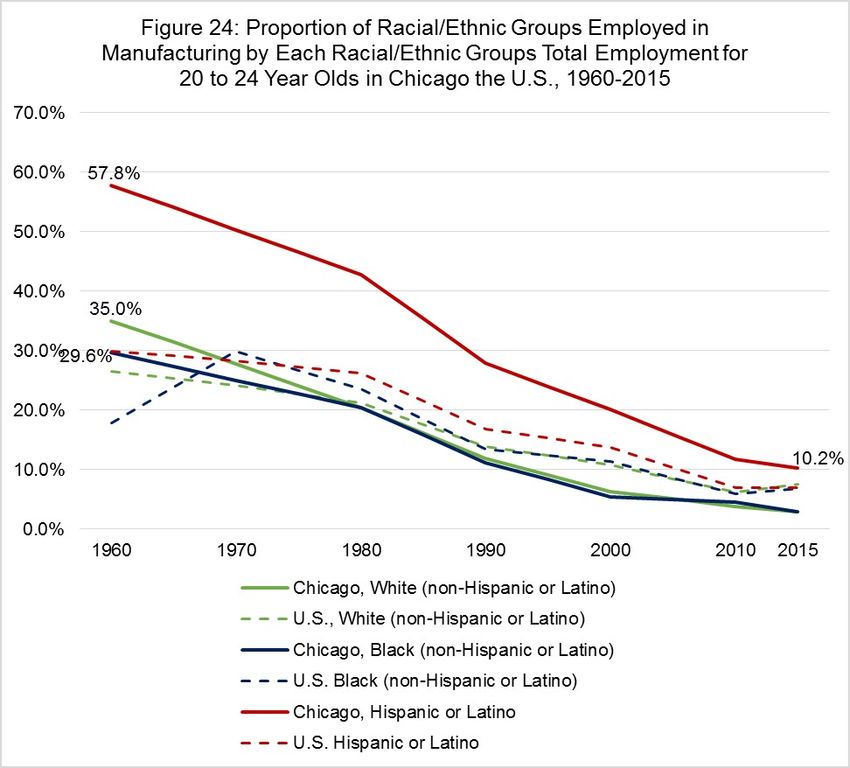
Survey, public use files. Tabulations by Great Cities Institute, University of Illinois at Chicago.Joblessness is Systemic and Tied to
Changes in Manufacturing
• Manufacturing was a significant part of Chicago’s economy in 1960,
employing 57.8 of working Hispanic or Latino 20 to 24 year olds, 35
percent of Whites (non-Hispanic or Latinos) and 29.6 percent of Blacks
(non- Hispanic or Latino).
• A continuous downward trend from 1960 to 2015 left just 10.2 percent
of working 20 to 24 year old Hispanic or Latinos in manufacturing and
just 2.9 percent of both Black and White 20 to 24 year olds. The
subsequent decline indicates that Chicago’s large manufacturing sector
was hit harder by the decline in manufacturing than the U.S. as a
whole (See Figure 24).
• In Chicago, the decline in manufacturing resulted in an economy with
large retail trade and professional and related services sectors – both
of which, in 2015 paid lower wages to 20 -24 year olds than
manufacturing did in 1960 (See Figure 28).In Chicago, Manufacturing More
Important
• In Chicago in 1960, compared to the U.S., larger
concentrations of 16 to 19 and 20 to 24 year olds worked in
manufacturing
• Larger declines over time, suggests that Chicago was
disproportionally impacted by the decline in
manufacturing.
• Among 16 to 19 and 20 to 24 year olds, Hispanic or Latinos,
which had the largest concentration in manufacturing
employment, have also seen the largest decline over time.
• For Blacks and Latinos, their percentage decline in
manufacturing is paralleled in their percentage increase in
retail and services, while Whites increased employment in
higher paying professional and related service jobs.16 to 19 Manufacturing Chicago, U.S.
Data Source: 1960, 1970, 1980, 1990 and 2000 Decennial Censuses and 2010 and 2015 American Community
Survey, public use files. Tabulations by Great Cities Institute, University of Illinois at Chicago.20 to 24 Manufacturing Chicago, U.S.
Data Source: 1960, 1970, 1980, 1990 and 2000 Decennial Censuses and 2010 and 2015 American Community
Survey, public use files. Tabulations by Great Cities Institute, University of Illinois at Chicago.Manufacturing - Source of Good
Wages
Data Source: 1960 Decennial Censuses and 2015 American Community Survey, public use files. Tabulations by
Great Cities Institute, University of Illinois at Chicago.Retail Employment Chicago, U.S.
Data Source: 1960, 1970, 1980, 1990 and 2000 Decennial Censuses and 2010 and 2015 American Community
Survey, public use files. Tabulations by Great Cities Institute, University of Illinois at Chicago.Whites in Chicago higher than U.S for
Professional and Related
Data Source: 1960, 1970, 1980, 1990 and 2000 Decennial Censuses and 2010 and 2015 American Community
Survey, public use files. Tabulations by Great Cities Institute, University of Illinois at Chicago.Joblessness is systemic and is tied to the flight of industry from neighborhoods • With the loss of manufacturing in Chicago came the flight of jobs from neighborhoods and the concentration in the central core, where whites (36.8 percent) are employed in professional and related jobs and Blacks (45.7 percent) and Latino (39.7 percent) are in retail (See Figures 25 and 26). • In 1957, large numbers of jobs were located throughout Chicago’s zip codes with an expansive area making up Chicago’s central area (from Lake Michigan to the East, Chicago’s western boundary to the West, Irving Park and North Center to the North, and New City to the South) having large numbers of jobs. By 2015, jobs become centralized towards the Loop and the South, and West Sides of Chicago in particular have fewer jobs (See Maps 7, 8 and 9).
Location Manufacturing Jobs 1970 to 2015
   Map 3: Number of Manufacturing Jobs                            Map 4: Number of Manufacturing Jobs
   by Zip Code in Chicago, 1970                                   by Zip Code in Chicago, 2015

              Data Source: 1970 and 2015 Where Workers Work. Illinois Department of Employment Security.
                         Maps Prepared by Great Cities Institute, University of Illinois at Chicago.
Location of Retail Jobs 1970 and 2015
Map 5: Number of Retail Jobs by Zip Map 6: Number of Retail Jobs by Zip
Code in Chicago, 1970 Code in Chicago, 2015
Data Source: 1970 and 2015 Where Workers Work. Illinois Department of Employment Security.
Maps Prepared by Great Cities Institute, University of Illinois at Chicago.Location Private Sector Jobs 1970-2015
Map 7: Total Number of Private Sector Map 9: Total Number of Private Sector
Jobs by Zip Code in Chicago, 1957 Jobs by Zip Code in Chicago, 2015
Data Source: 1970 and 2015 Where Workers Work. Illinois Department of Employment Security.
Maps Prepared by Great Cities Institute, University of Illinois at Chicago.In Sum, This report dramatically reveals a downward and long-term trend of economic abandonment in many of Chicago’s neighborhoods, leaving behind chronic and concentrated conditions of joblessness that have affected generations of young people, their households and their communities.
Joblessness Has Consequences
•   Depriving young people of the dignity of work leaves permanent scars, impedes an
    overall sense of well-being, and leads to other counterproductive behaviors.
•   Conditions of low rates of employment as youth impact the likelihood of
    employment later in life, the level of wages, and interestingly, all indicators of life
    satisfaction. Unemployment “makes people unhappy”
•   “Unemployment increases susceptibility to malnutrition, illness, mental stress, and
    loss of self-esteem, leading to depression”
•   Youth joblessness “injures self-esteem, and fosters feelings of externality and
    helplessness among youth.” and “…causes increases in burglaries, thefts and drug
    offences”
•   The result is a cycle, where the “permanent scars” lead to conditions that are both
    a consequence and a precipitating factor that leads to further youth
    unemployment and parallel social conditions.
•   Chronic joblessness creates the very conditions that impede overcoming them.
It is not surprising, therefore, that • The neighborhoods with the highest rates of violence are the neighborhoods with the highest rates of joblessness • Solutions to violence must include economic solutions • Despite complexities, there are immediate steps that can be taken
Implications of Context
Understanding that residential segregation and
economic and occupational restructuring is the
structural context for what is happening to our young
people of color, is a pointed reminder that chronic and
concentrated youth joblessness must be understood in
terms of its structural roots and not as a function of
individual attributes. Blaming young people for their
plight does nothing to remedy their conditions.
Providing structured opportunities for employment
and capacity building does.
Pathways to Opportunity
Among the possible strategies, there are at least
four categories of initial steps for business and
corporations, government, and community
members and organizations to tackle joblessness
among those most affected:
Prepare young people from these
neighborhoods for the livable wage jobs
    that do exist and equip them to
 participate in the emerging economy
   – Increase public education expenditures
   – Provide on-the job training
   – Expand training and workforce development
   – Remove the impediments to employment,
     including those related to criminal records
Create direct employment opportunities
–Reinstate federal, state, and local
summer jobs programs
–Replicate New Deal strategies
–Fund paid mentorship programs
–Create apprenticeship programs
–Recreate employment subsidy
programsRevive economically abandoned neighborhoods
– Attract anchor employers that hire neighborhood residents
– Assist and incentivize small business development
– Create incentives for venture capital investments that are
not totally predicated on immediate profit recovery
– Enhance conditions for community led initiatives such as
worker cooperatives and small business incubators that
harness the skills and talents of young people, both of
which can become the basis for revitalized commercial
districts to supply the much-needed access to a wider
range of goods and services
– Increase funding for community organizations that provide
mentorship and capacity building of young peopleStop the bleeding of job loss and reverse
policies that reward extraction of wealth from
communities
– Tie tax incentives for corporations to actual job
generation, which are then monitored for
adherence to agreements with penalties for non-
compliance
– Accelerate incentives to investments in
neighborhoods and evaluate their effectiveness
•“Nothing Stops a Bullet Like a Job.”
On the basis of the data produced in this report, we can conclude that:
• We have the corporate and political responsibility to invest in those
affected by years of economic abandonment and indifference.
• Reconnecting the disconnected yields benefits for everyone.
• Doing so requires that the young people themselves are part of
developing further understanding of both the problem and the
solutions.
• The severity and complexity of chronic and concentrated
joblessness among young people most affected, requires an “all
hands on deck” response.
As David Elam reminded us during his testimony at the youth
employment hearings in January 2016,
“Team work will make the dream work.”Thank you
@UICGCIYou can also read