HOUSING AND PUBLIC SAFETY UPDATES & ENVIRONMENTAL JUSTICE POLICIES - VIRTUAL PUBLIC WORKSHOP #1 - City of Riverside
←
→
Page content transcription
If your browser does not render page correctly, please read the page content below
City of Riverside, CA
            J a n u a r y 7 th, 2 0 2 0

       VIRTUAL PUBLIC WORKSHOP #1

HOUSING AND PUBLIC SAFETY UPDATES
 & ENVIRONMENTAL JUSTICE POLICIES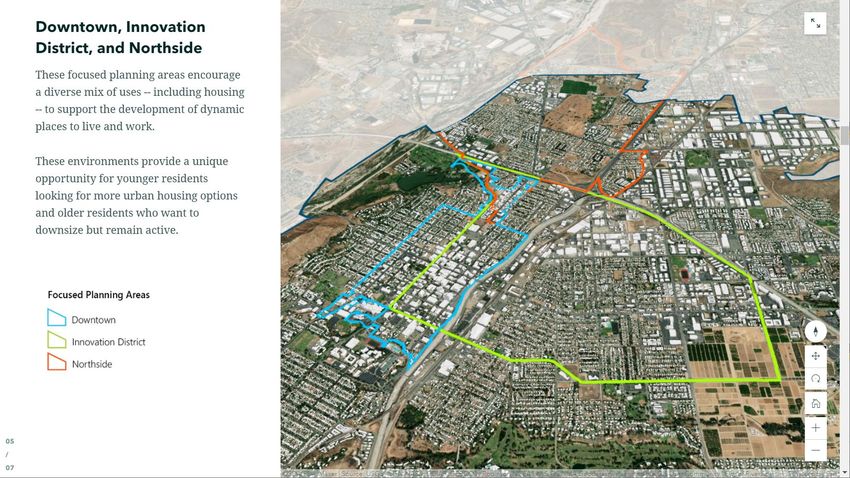
STAY CONNECTED!

  • Explore the StoryMap showing
    opportunity site locations:          https://tinyurl.com/y2lu3cgg

  • Complete the online survey:          https://www.surveymonkey.com/r/WLV9X56

  • Visit the Housing Element Update
    website and join the mailing list:   riversideca.gov/HousingUpdate

  • Ask a question or provide your
                                         MTaylor@riversideca.gov
    comments by email:

  • Watch for future public meetings:    January 27th and again in late February
Slide 2
Tonight’s Agenda

 1. Project Overview and Team Introduction

 2. Housing Element Update – RHNA Background

 3. Housing Element Update – Opportunity Sites Inventory

 4. Public Safety Element Update and Environmental Justice Policies

 5. Stay Connected!

                                                                Slide 3
PROJECT OVERVIEW and TIMELINE
                   2020 2021
Oct     Nov        Dec      Jan     Feb      Mar   Apr       May        Jun       Jul        Aug      Sep

                         Public Engagement
                          November-March
                                                                        Adoption Hearings
Project Start-Up                                                                Sep-Oct 2021
September 2020
                           Begin                   HCD Initial Review                        HCD Deadline
                           Environmental                      May 2021                       October 15, 2021
                           Review
                           March 2021
                                                   HCD = State of California Department of
                                                   Housing and Community Development                  Slide 4
Participation Opportunities
Public Review

                       Round 1     Round 2     Round 3       HCD Review   Round 4
                        Jan 7th    Jan 27th    Late Feb        Apr-Jul      Aug
                       Potential     RHNA       Preferred    Admin and     Final
RHNA Site Inventory
                         Sites     Scenarios   Alternative   HCD Drafts    Draft

Housing Programs
and Policies

Public Safety Update
and EJ Policies

General Plan Updates
and EIR
                                                                            Slide 5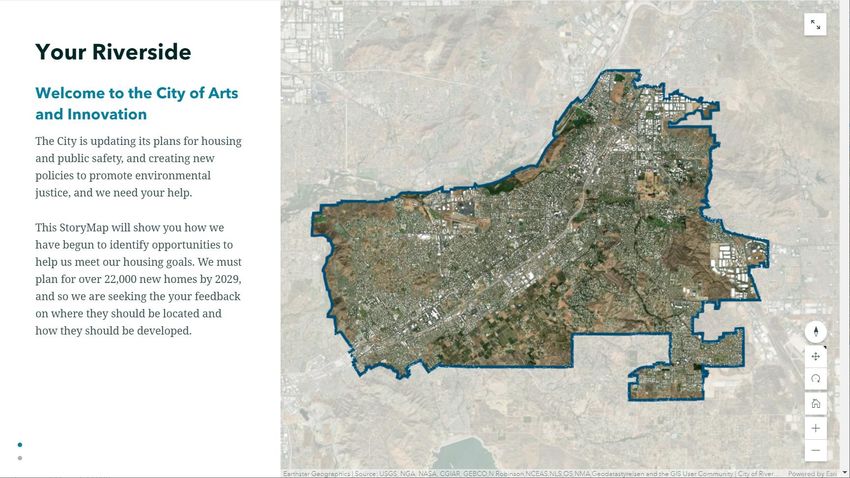
Relationship to General Plan
1. Every city in California must create a General Plan that

  acts as a roadmap for the future growth of the City.

2. General Plans must address key topic areas, called

  Elements, that cover things like land use,

  housing, transportation, services and infrastructure, etc.

3. Each element establishes broad objectives, focused

  policies and specific actions the City will take to

  achieve its goals.

                                                               Slide 6
CONSULTANT TEAM

  Lead       Housing   Environmental &   Transportation   Community   Land Use
Consultant              Sustainability                     Outreach     Law

                                                                       Slide 7
CONSULTANT TEAM

Rob Matthews, AICP   Brian Sims, GISP   Veronica Tam, AICP   Debra Leight        JC Lacey
  Houseal Lavigne    Houseal Lavigne           VTA              ICF         Arellano Associates

                                                                                     Slide 8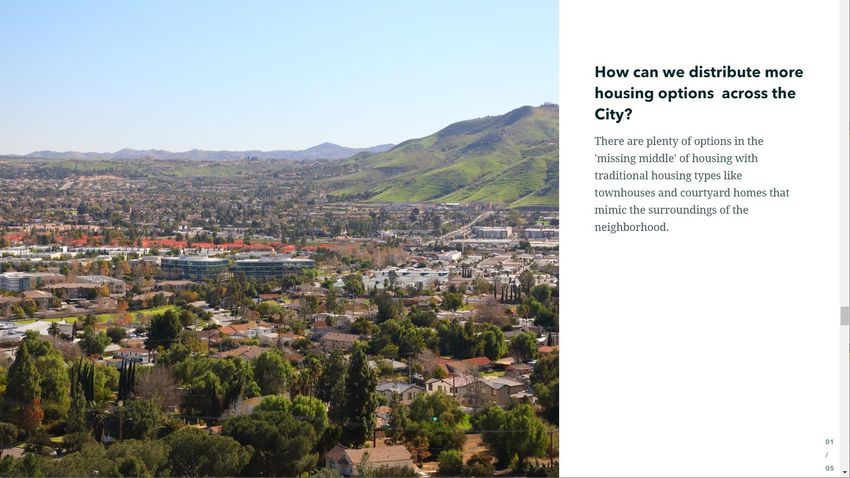
POLL QUESTIONS #1

                    Slide 9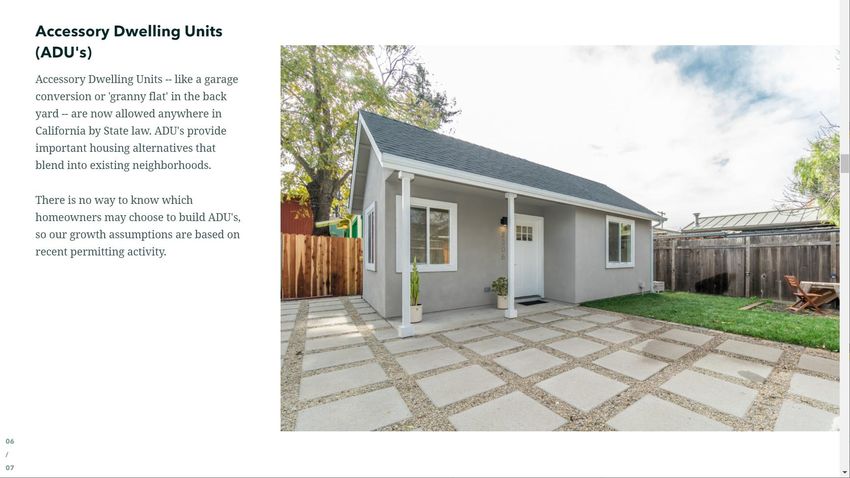
Riverside Population and Households
Population                                                               Household Type

328,155
                                                                         45.0%
                                                                                                   39.60%
                                                                         40.0%

(as of January 2020)                                                     35.0%

                                                                         30.0%
 Riverside        1990           2000           2010              2018              24.90%
                                                                         25.0%
Population      226,546        255,166        303,871         325,417                                             19.90%
                                                                         20.0%
Sources: Department of Finance Population Estimates, 1990-2018.
                                                                         15.0%
                                                                                                                                             10.40%
                                                                         10.0%
Total Households
                                                                                                                                   7.30%

                                                                          5.0%

90,722                                                                    0.0%
                                                                                  With one or    With one or
                                                                                 more people 65 more people
                                                                                                               Householder Householder 65 Single-parent
                                                                                                               living alone years and older households
                                                                                 years and over under 18 years                living alone

                                                                                  Source: American Community Survey (2014-2018).
                                                                                                                                             Slide 10
Riverside Population
Change in Age Group Change in Race and Ethnicity
100,000
90,000 All Other
80,000
70,000 Black or African American
60,000
50,000 Asian
40,000
30,000
Hispanic or Latino
20,000
10,000
White
-
Under 5 5 to 17 18-24 25-44 45-64 65+
years - 50,000 100,000 150,000 200,000
2010 2018 2010 2018
Sources: American Community Survey (2014-2018)
Source: American Community Survey (2006-2010 and 2014-2018).
Slide 11Riverside Households
Income Distribution
Income Category Households • These income categories
are defined by the State
Extremely Low (30% AMI or less) 10,200 11% and are based on varying
percentages of the Area
Very Low (31-50% AMI) 10,250 11% Median Income (AMI)
Low (51-80% AMI) 13,735 15% • Housing is considered
“affordable” if occupants
Moderate or Above (over 80% AMI) 56,795 63% pay no more than 30% of
their income on housing
Total 90,975 100%
costs
Source: HUD Comprehensive Housing Affordability Strategy (CHAS) data, 2013-2017.
Source: American Community Survey (2006-2010 and 2014-2018).
Slide 12What is the Housing Element?
• One of the 7 required elements in the City’s
General Plan
• Provides an assessment of the City’s
housing needs and how best to
accommodate the housing needs of existing
and future residents
• Sets citywide goals, objectives and policies
for housing, and identifies housing
conditions and needs within the community
• Must be updated every 8 years according to
statutory deadline. Riverside County –
October 15, 2021
• Must be reviewed for compliance by State
Department of Housing and Community
Development (HCD)
Slide 13Housing Element Requirements
• Accommodate projected housing demand,
as mandated by the State (RHNA)
• Increase housing production to meet this
demand
• Preserve existing affordable housing
• Improve the safety, quality and condition
of existing housing
• Facilitate the development of housing for
all income levels and household types
including special needs populations
• Promote fair housing choices for all
Slide 14Consequences of Noncompliance
• Risk of litigation (AB 72, AB 101)
• HCD monitors for non-compliance and
reports to Attorney General (AG)
• Court can impose fines up to $100,000
per month
• Some communities have been sued:
• by AG for continued inaction and settled
• by AG and was suspended from issuing
building permits for over one year
• by nonprofits
• Ineligibility for State grants
• SB2 Grant (City received $125,000)
• LEAP Grant (City received $570,000)
• Other infrastructure/transportation
funds being considered
Slide 156th-Cycle RHNA Allocation
Very Low 4,849
(120% AMI)
Total – 6th Cycle 18,415
TOTAL ~22,100
Slide 16RHNA in Nearby Cities
Each jurisdiction must demonstrate in its Housing Element that it can
accommodate its total RHNA number and its allocations by income level.
Slide 17RHNA OPPORTUNITY SITES
Slide 18RHNA OPPORTUNITY SITES
Visit this StoryMap online at:
https://tinyurl.com/y2lu3cgg
Slide 19Slide 20
Slide 21
Slide 22
Sites Inventory
Identification of Opportunity Sites for Affordable Housing

Initial Selection Criteria –
areas included because they may be suitable

Underutilization / Potential for Redevelopment
❑ Current Land Use (especially vacant)
❑ Improvement Ratio (value of buildings / value of land)

Physical Site Characteristics
❑ Lot Size
❑ Year Built

Specific Opportunities
❑ Transit Oriented Development (TOD)
❑ Infill and ‘Missing Middle’ Housing
❑ Credit for Accessory Dwelling Units (ADU)
Slide 24
Slide 25
Slide 26
Slide 27
Slide 28
Slide 29
Slide 30
Slide 31
Slide 32
Slide 33
Slide 34
Slide 35
Slide 36
Slide 37
Slide 38
Slide 39
Slide 40
Slide 41
Slide 42
Slide 43
HOUSING ELEMENT Q&A

                      Slide 44
POLL QUESTIONS #2
Slide 45Environmental
Planning
• As a part of the Housing Element Update,
the following will be prepared and released
for public review and input:
• Housing Element
• Public Safety Element
• Environmental Justice Policies
• Zoning Code Update
• All these items will be evaluated in a
Program Environmental Impact Report
(EIR)
Slide 46What is a Public Safety
Element?
• Protecting the public's safety is the most critical
mission of any local government. Building codes,
insurance programs, airport plans and hazardous
materials management efforts are all crucial
programs that protect life and safety.
• The Public Safety Element is another component of
the City’s General Plan that identifies public safety
issues and needs anticipated to be of ongoing
concern to people in Riverside.
• The Public Safety Element’s purpose is to ensure
that the City takes action to reduce natural and
man-made hazards and safety threats as well as
respond quickly to any public safety incident.
Slide 47Public Safety
Element Update
• Senate Bill 1035, passed in late 2018, requires that on the next
revision of the housing element, the safety element shall be
reviewed and updated as necessary to address the risk of fire for
land classified as state responsibility areas.
• This review shall consider the advice included in the Office of
Planning and Research’s most recent publication regarding fire
hazard planning, and shall include, among other things:
• Information regarding fire hazards
• Existing and planned development in identified at-risk areas,
including structures, roads, utilities, and essential public
facilities, and
• Set of adaptation and resilience goals, policies, and objectives
for the protection of the community.
Slide 48What is Environmental
Justice?
• Environmental justice is the fair treatment and
meaningful involvement of all people regardless of
race, color, national origin, or income, with respect to
the development, implementation, and enforcement
of environmental laws, regulations, and policies.
• Environmental Justice goals and policies will be
developed by identifying disadvantaged communities
and demographics and conducting community
outreach to better understand the unique and
disproportionate challenges faced by these
communities.
• This will guide the City’s efforts to address issues
related to public health, social equity and
environmental justice.
Slide 49• SB 1035 requires environmental justice goals, policies and objectives
to be integrated into the General Plan and to include disadvantaged
Environmental communities within the area covered by the General Plan.
• For this update, Environmental Justice goals, policies, and objectives
Justice Policies will be incorporated into the Housing Element and the Public Safety
Element as well as future element updates to the General Plan.
• The General Plan will identify objectives and policies to reduce health
risks in disadvantaged communities including, but not limited to,
reduction of pollution exposure and promotion of public facilities,
food access, safe and sanitary homes, and physical activity.
Slide 50California Environmental Quality Act
(CEQA)
The primary purposes of CEQA are to:
• Inform the public and decision makers about the
Project and about the potential environmental
impacts.
• Identify how to avoid or reduce impacts.
• Prevent environmental damage through
mitigation or alternatives.
• Foster interagency coordination in review of
projects.
• Provide an opportunity for the public and
local/state agencies to comment on the
environmental issues.
Slide 51Environmental Issues Considered
Initial Study (IS) and
Environment Impact Report (EIR)
• Aesthetics & Visual Quality • Land Use
• Agriculture & Forestry Resources • Noise
• Air Quality Emissions • Paleontological Resources
• Biological Resources • Population / Housing
• Cultural / Tribal Resources • Public Services
• Energy • Recreation
• Geology, Soils, & Seismicity • Transportation & Circulation
• Greenhouse Gas Emissions • Utilities & Service Systems
• Hazards & Hazardous Materials • Wildfire
• Hydrology & Water Quality • Alternatives
• Mineral Resources • Cumulative Impacts
Slide 52CEQA Environmental Review Process
Public & Public &
Agency Input Agency Input
* We Are Here *
Early Spring Late Spring Summer October
2021 2021 2021 2021
Round 1
Information EIR
Meeting NOP Draft EIR Final EIR
Certification
30-day 45-day
Review Review
Round 1 Initial Sites
City Council
Scenarios / Hearings
Round 2
Alternatives
Round 3 Preferred NOP = Notice of Preparation of Draft EIR
Alternative EIR = Environmental Impact Report Slide 53Q&A
CEQA, PUBLIC SAFETY ELEMENT, AND
ENVIRONMENTAL JUSTICE POLICIES
Slide 54POLL QUESTIONS #3
Slide 55MAP YOUR FEEDBACK Share your ideas using our Map.Social app. You can access it online here: hla.fyi/RiversideHousingFeedback You will need this information to log in: Email: Riverside@map.social Password: Riverside2020# Slide 56
MAP YOUR FEEDBACK

      Tips for using Map.Social

      • Pan and zoom the map to see
        more detail
      • Click on an area of interest then
        pick a category for your comment

Slide 57
MAP YOUR FEEDBACK
Tips for using Map.Social
• Give your comment a Title and a
Description
• Click ‘Submit’ and you’re done!
• You may leave more than one
comment
Slide 58NEXT STEPS
Stay connected!
• Explore the StoryMap showing
opportunity site locations: https://tinyurl.com/y2lu3cgg
• Complete the online survey: https://www.surveymonkey.com/r/WLV9X56
• Visit the Housing Element Update
website and join the mailing list: riversideca.gov/HousingUpdate
• Ask a question or provide your
MTaylor@riversideca.gov
comments by email:
• Watch for future public meetings: January 27th and again in late February
Slide 59THANK YOU!
You can also read