THE DIGITAL ECONOMY AUGUST 2020 WEBINAR - TRIMTABS ASSET MANAGEMENT
←
→
Page content transcription
If your browser does not render page correctly, please read the page content below
The Digital Economy
     August 2020 Webinar
Q2 Recap
• Q2 GDP down 32.9%
• Record unemployment
• Rolling virus outbreaks
• Fed willing to do whatever it takes
• Fiscal stimulus
• Bifurcated economy: tech, staples, healthcare benefitting while airlines,
restaurants, entertainment, hotels, banks, energy companies struggled.
• A record 85% of S&P 500 companies beat expectations.
• In aggregate, sales came in 1.5% higher than expected (S&P 500).
• Avg earnings surprise over 23% (S&P 500).
• Many companies observing significant week over week improvements
since bottom in April/May.
2The Digital Economy
Acceleration of digital consumption has strongly disrupted traditional
industries:
• On-line shopping
• On-line payments
• Work-from-home
• Streaming content
• At-home workouts
• Video gaming
• Videoconferencing
Many of these behaviors appear to be sticky and longer lasting.
3Today vs. 2000
Many investors are drawing parallels between today’s market and 2000, citing:
5 STOCKS
TECHNOLOGY “LOFTY”
DRIVING THE
BOOM VALUATIONS
MARKET
4Profitability of Nasdaq 100 Companies and S&P 500 Ex-Financials
Trimmed Average Free Cash Flow Margin TTM
03/31/1999 to 07/31/2020
5Nasdaq 100 Companies Profitability from a Free Cash Flow Perspective
Number of Companies with Positive Free Cash Flow Generation
03/31/1999 to 07/31/2020
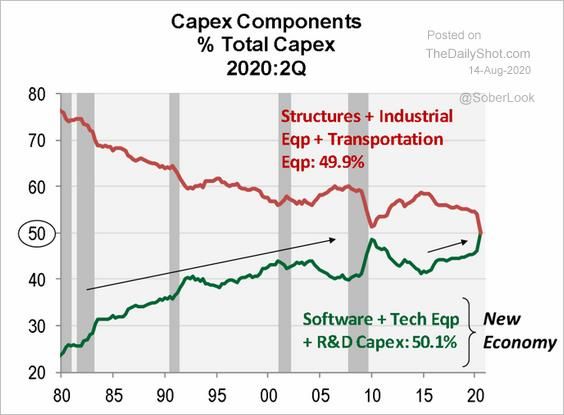
6“New economy capex (software, tech eqp, r&d) is now more than half
of all capex. Tech will power the new expansion, creating jobs, raising
productivity, and dampening inflation.” – Nancy Lazar @NancyRLazar1
Source: Nancy Lazar, twitter @NancyRLazar1, WSJ The Daily Shot, twitter @SoberLook
St. Louis Federal Reserve 78 Past performance does not guarantee future results.
More than just FAAMG
Besides the big 5 leaders, there are many companies benefitting in this
new digital economy.

On-line shopping and recreation:
BABA, ETSY, ATVI

Streaming on-line workouts:
PTON, LULU

Accelerated use of cloud infrastructure & security software:
ZM, NOW, FTNT, QLYS, NICE

Work-from-home trends spurred migration from high cost cities to more
spacious suburbs:
Z & CSGP providing digital real estate tour capabilities.

Traditional brick-and-mortar companies that have developed a massive
online presence:
HD & WMT

                                                                          9
TTAC Exposure to Technology &
The Digital Economy As of 08/19/2020
Ticker Company % Net Assets Ticker Company % Net Assets
AMZN AMAZON COM INC 2.75% ROK ROCKWELL AUTOMATION 1.09%
MSFT MICROSOFT CORP 2.56% TXN TEXAS INSTRS INC 1.08%
AAPL APPLE INC 2.06% ABT ABBOTT LABS 1.05%
FB FACEBOOK INC 1.98% CDNS CADENCE DESIGN SYSTEM 1.04%
GOOGL ALPHABET INC 1.93% INTC INTEL CORP 1.04%
NVDA NVIDIA CORPORATION 1.68% MXIM MAXIM INTEGRATED PRODS INC 1.02%
NICE NICE LTD 1.67% LULU LULULEMON ATHLETICA INC 1.01%
YUMC YUM! CHINA HOLDINGS 1.66% VRSN VERISIGN INC 1.01%
HD HOME DEPOT INC 1.33% EL ESTEE LAUDER CO 1.00%
MKTX MARKETAXESS HLDGS INC 1.31% QLYS QUALYS INC 0.98%
ANSS ANSYS INC 1.30% HPQ HP INC 0.97%
ACN ACCENTURE 1.28% V VISA INC 0.97%
BABA ALIBABA GROUP HLDG LTD 1.28% FTNT FORTINET INC 0.95%
CSGP COSTAR GROUP INC 1.27% KEYS KEYSIGHT TECHNOLOGIES INC 0.92%
ETSY ETSY INC 1.27% ZM ZOOM VIDEO COMMUNICATIONS 0.92%
PRLB PROTO LABS INC 1.27% PTON PELOTON INTERACTIVE INC 0.88%
COST COSTCO WHOLESALE CORP 1.25% FLIR FLIR SYS INC 0.87%
WMT WALMART INC 1.22% LDOS LEIDOS HOLDINGS INC 0.87%
DIS DISNEY WALT CO 1.17% TER TERADYNE INC 0.80%
Z ZILLOW GROUP INC 1.16% ATVI ACTIVISION BLIZZARD INC 0.65%
ISRG INTUITUVE SURGICAL INC 1.13% MORN MORNINGSTAR INC 0.65%
JKHY JACK HENRY & ASSOCIATES 1.10% NOW SERVICENOW INC 0.65%
10
MA MASTERCARD INC 1.10% IRBT IROBOT CORP 0.59%
TT TRANE TECHNOLOGIES PLC 1.10% MDT MEDTRONIC PLC 0.59%TTAI Exposure to Technology &
The Digital Economy As of 08/19/2020
Ticker Company % Net Assets
LULU LULULEMON ATHLETICA INC 2.62%
NICE NICE LTD 2.60%
6645 JP OMRON CORP 2.06%
LOGN SW LOGITECH INTL 1.87%
SIE GR SIEMENS AG 1.86%
ASML NA ASML HOLDING NV 1.83%
SMSN LI SAMSUNG ELECTRONIC 1.83%
9697 JP CAPCOM CO LTD 1.69%
DSY FP DASSAULT SYSTEMES 1.53%
4307 JP NOMURA RESEARCH 1.53%
700 HK TENCENT HLDGS LTD 1.48%
TEAM ATLASSIAN CORP PLC 1.48%
BABA ALIBABA GROUP HLDG LTD 1.42%
RMV LN RIGHTMOVE 1.35%
8035 JP TOKYO ELECTRON 1.30%
7974 JP NINTENDO CO LTD 1.23%
6098 JP RECRUIT HOLDINGS 1.16%
2371 JP KAKAKU.COM. INC 1.10%
9719 JP SCSK CORP 1.02%
6506 JP YASKAWA ELEC CORP 0.93%
6954 JP FANUC CORP 0.93%
11Outlook & Risk
While we are optimistic about the long-term trends in the digital
economy, there are potential short-term risks.
The U.S. stock market is at all time highs.
After this type of rally, it’s possible to have a correction at any point.
We believe the best way to deliver alpha is to buy high quality
companies that can be held over the long-term.
12Investment Team
The TrimTabs investment team has broad investment management
experience and proven expertise.
Bob Shea
Chief Executive Officer and Chief Investment Officer
Janet Flanders Johnston, CFA
Co-CIO and Portfolio Manager
Vince (Qijun) Chen
Senior Quantitative Analyst
Allie Shell
Equity Analyst
13Contact Us
Byron Ramult
Director of Sales
+1 (212) 217-2514
Byron.ramult@trimtabsfunds.com
Derin Cohen
CCO/COO
+1 (212) 217-2597
derin.cohen@trimtabsfunds.com
www.trimtabsfunds.com
Follow us on Twitter: @trimtabsadvisor
Follow us on LinkedIn: TrimTabs Asset Management 14Disclosures
The fund’s investment objectives, risks, charges and expenses must be considered carefully before investing. The statutory an d
summary prospectus contains this and other important information about the investment company, and it may be obtained by
calling 1-800-617-0004. Read it carefully before investing.
There is no guarantee that TTAI and TTAC will achieve their investment objectives. Investing involves risk, including the
possible loss of principal. Because the Fund is an ETF (rather than a mutual fund), shares are bought and sold at market
price (not NAV), may trade at a discount or premium to NAV, and are not individually redeemable. Owners of the shares
may acquire those shares from the Fund and tender those shares for redemption to the Fund in Creation Unit
aggregations only, consisting of 25,000 shares. Brokerage commissions will reduce returns. Investments in the Fund
include risks associated with small-and mid-cap securities, which involve limited liquidity and greater volatility than
large-cap securities. Returns on investments in foreign securities could be more volatile than investments in domestic
securities.
Fund holdings and sector allocations are subject to change at any time and are not recommendations to buy or sell any securit y.
Free Cash Flow (FCF) represents the cash that a company is able to generate after accounting for capital expenditures.
The Standard & Poor’s 500, often abbreviated as the S&P 500, or just the S&P, is an American stock market index based on the
market capitalizations of 500 large companies having common stock listed on the NYSE or NASDAQ.
Standard Deviation is a measure that is used to quantify the amount of variation or dispersion of a set of data values.
Alpha is a measure of performance on a risk-adjusted basis.
Beta is a measure of the volatility, or systematic risk, of a security or portfolio, in comparison to the market as a whole.
15Disclosures
TTAC and TTAI are distributed by Quasar Distributors, LLC.
The Russell 3000® Index measures the performance of the 3,000 largest publicly traded U.S. companies, based on market capitalization. The Index
measures the performance of approximately 98% of the total market capitalization of the publicly traded U.S. equity market. It is not possible to invest
directly in an index.
The S&P Developed Ex-U.S. BMI Index is a market capitalization weighted index that defines and measures the investable universe of publicly traded
companies domiciled in developed countries outside the U.S. The Developed Index is float adjusted, meaning that only those shares publicly available to
investors are included in the Developed Index calculation.
It is not possible to invest directly in an index.
The cash ratio or cash coverage ratio is a liquidity ratio that measures a firm's ability to pay off its current liabilities with only cash and cash equivalents.
EPS - Earnings per share is the monetary value of earnings per outstanding share of common stock for a company.
Created by the Chicago Board Options Exchange (CBOE), the Volatility Index, or VIX, is a real-time market index that represents the market's
expectation of 30-day forward-looking volatility.
The S&P 1500, or S&P Composite 1500 Index includes all stocks in the S&P 500, S&P 400, and S&P 600. This index covers approximately 90% of the
market capitalization of U.S. stocks.
The NASDAQ-100 is a stock market index made up of 103 equity securities issued by 100 of the largest non-financial companies listed on the Nasdaq
stock market.
Capital expenditure (capex) or capital expense is the money an organization or corporate entity spends to buy, maintain, or improve its fixed assets,
such as buildings, vehicles, equipment, or land.
The price-earnings ratio, also known as P/E ratio, P/E, or PER, is the ratio of a company's share price to the company's earnings per share.
16Disclosures
To present this volatility in annualized terms, we simply need to multiply our daily standard deviation by the square root of 252.
Sharpe ratio measures the performance of an investment compared to a risk-free asset, after adjusting for its risk.
The information ratio, also known as appraisal ratio, measures and compares the active return of an investment compared to a benchmark index relative
to the volatility of the active return.
17You can also read