Air Quality Impact Assessment - West Gate Tunnel Project IAC Frank Fleer - Engage Victoria
←
→
Page content transcription
If your browser does not render page correctly, please read the page content below
West Gate Tunnel Project IAC
Air Quality Impact Assessment
Frank Fleer
Presentation Overview
Introduction
Existing conditions
Models
Ventilation structure modelling
Surface roads modelling
Combined impacts modelling
Response to issues raised
8/24/2017 2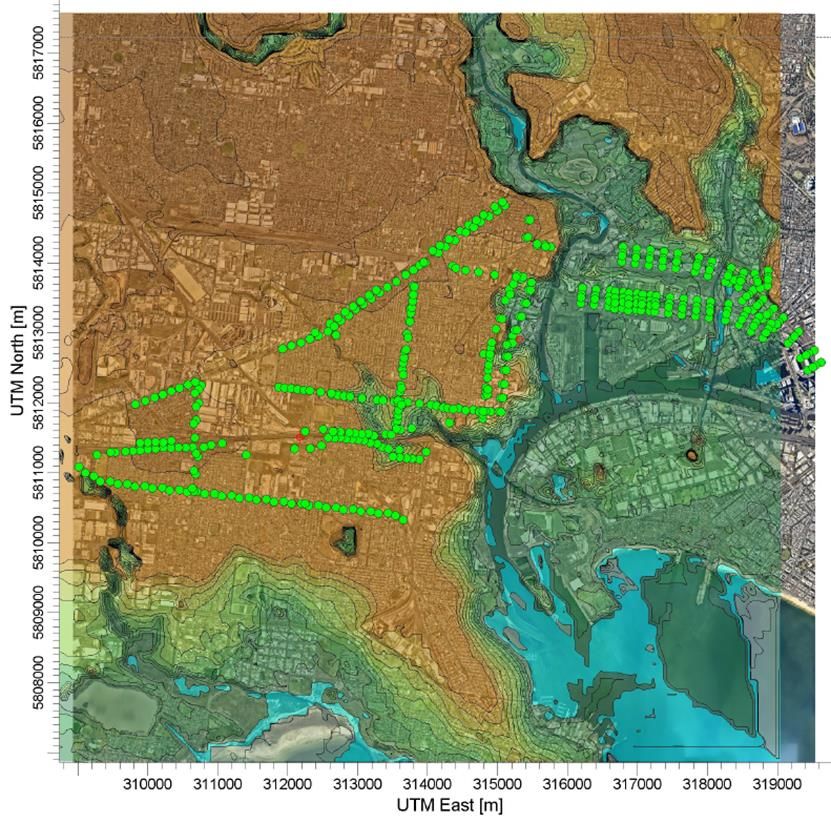
Introduction

            Dispersion modelling uses mathematical formulations
            to characterise the atmospheric processes that
            disperse a pollutant emitted by a source.

            Based on emissions and meteorological inputs, a
            dispersion model can be used to predict
            concentrations at selected downwind receptor
            locations.

8/24/2017                            3
Introduction

                          Mathematical        Prediction of   Compliance
            Data input
                           modelling         concentrations   assessment

8/24/2017                                4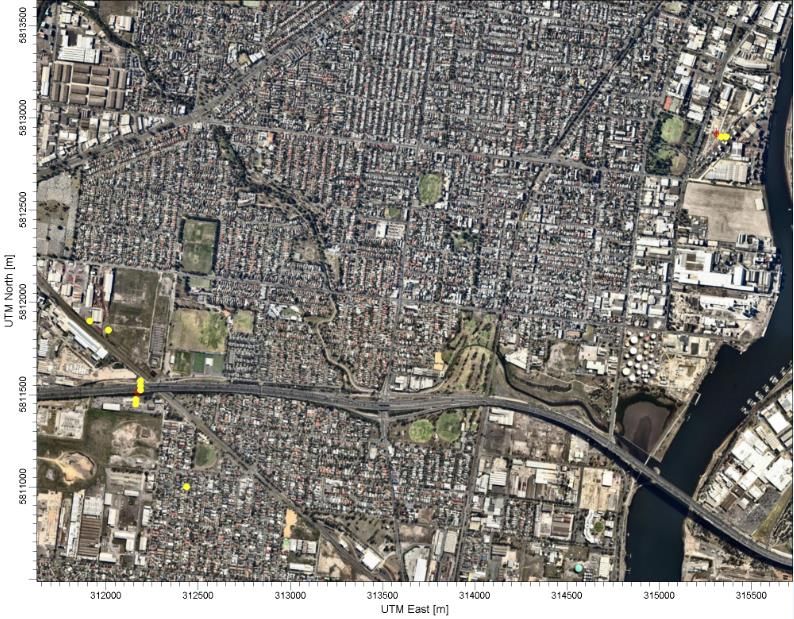
Existing conditions
     Compared with international cities of similar size, Melbourne’s air quality is relatively good.
     There are periodic exceedances of air quality standards, principally PM10 and PM2.5,
     mainly due to the impact of wood heaters, dust storms, bushfires and fuel reduction burns.

8/24/2017                                           5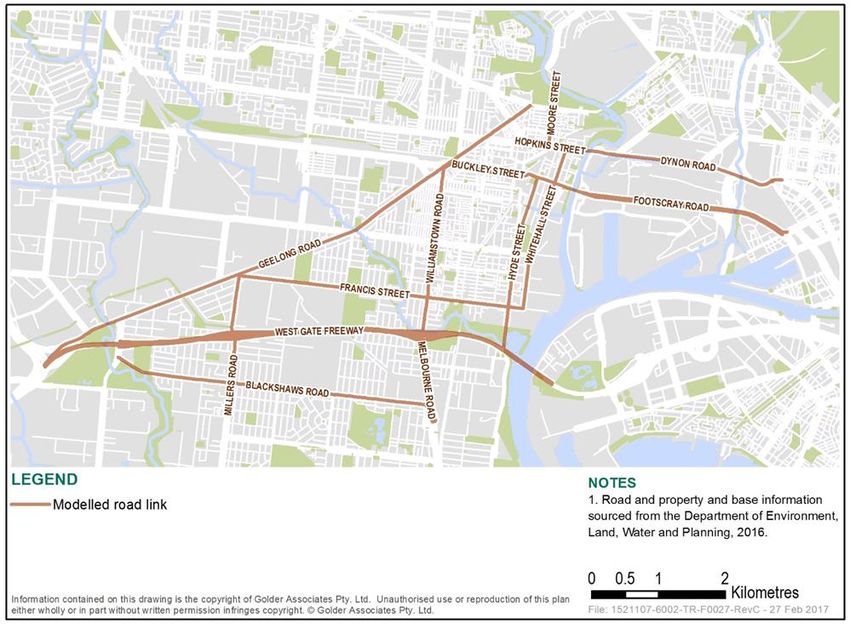
Modelling approach

8/24/2017                  6
Models
Models:
• Tunnel ventilation structures
- AERMOD (Victorian & USEPA regulatory model)
• Surface roads
- AUSROADS (Victorian regulatory model based on Caline4)
Pollutants:
• PM10, PM2.5, NO2, CO, BTEX, HCHO, 1,3 butadiene & PAHs
8/24/2017 7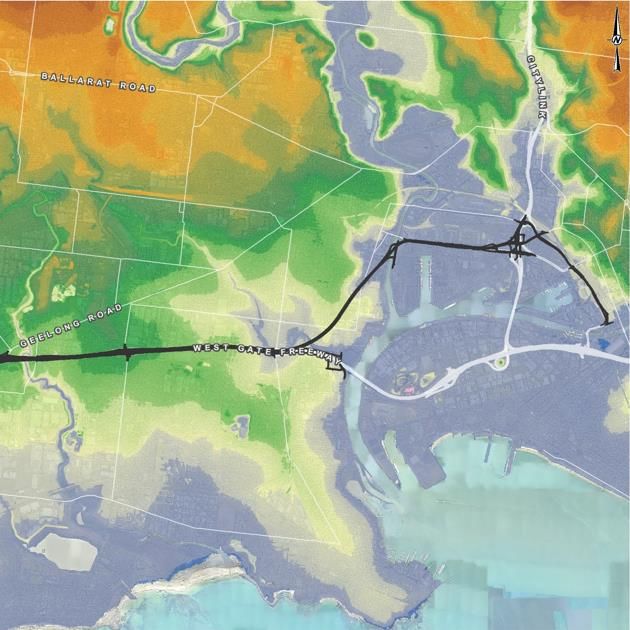
Ventilation structures
Scenarios modelled:
Normal operation 2022
Normal operation 2031
Sensitivity analysis:
Emissions at CO and NO2 in-tunnel limits
Increased diesel to petrol fuelled cars ratio
Increased proportion of HCVs
Maximum lane capacity (2031)
8/24/2017 8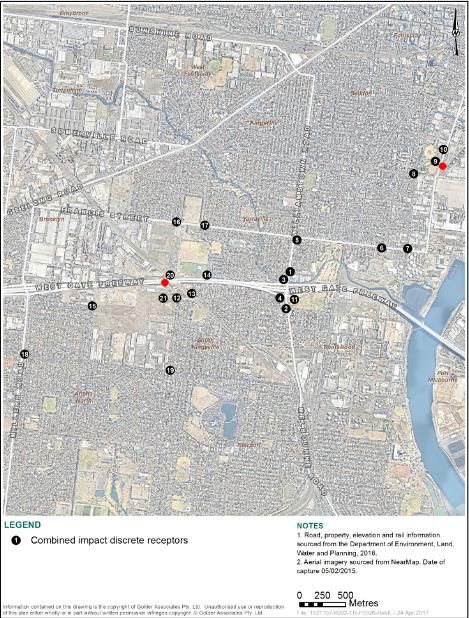
Ventilation structures
Input data:
background pollutant concentrations (Footscray 2009 – 2013 & EPA Victoria)
meteorology (Footscray 2009 - 2013)
topography (Geoscience Australia and DELWP)
traffic volumes and mix
vehicle emission factors (PIARC 2020 and COPERT Australia)
receptors (gridded and discrete)
8/24/2017 9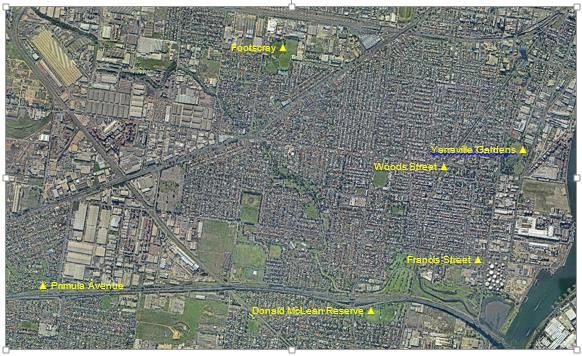
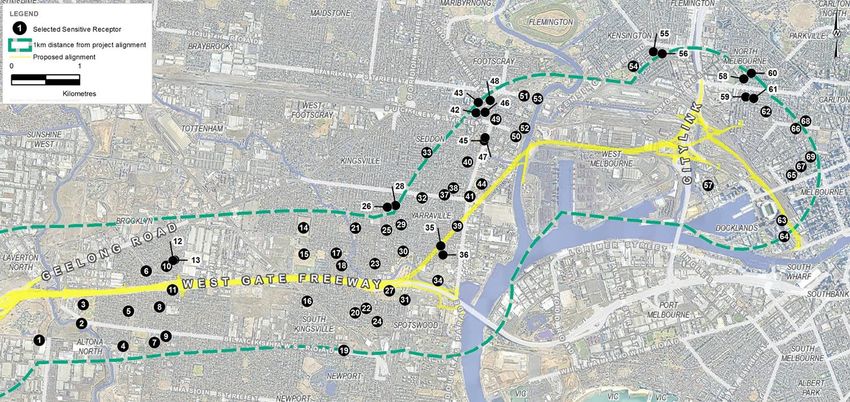
Topography
Colour Elevation (m)
0-5
5 – 10
10 - 15
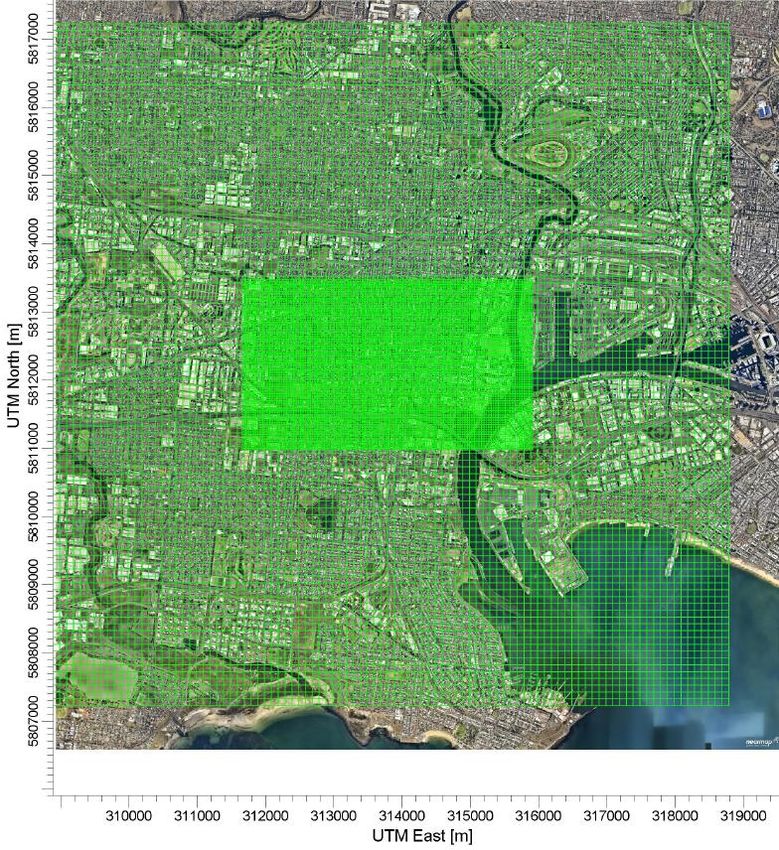
8/24/2017 10Gridded receptors
Grid (km) Spacing (m)
10 x 10 100
4.25 x 2.5 25
8/24/2017 11Discrete receptors 8/24/2017 12
PM10 1 hour av background concentrations

8/24/2017                  13
Ventilation structures
Under normal operating conditions there is predicted to be a negligible impact
on ambient air quality due to ventilation structure emissions.
All pollutants complied with SEPP(AQM) criteria, except for:
8 (2022) and 11 (2031) additional PM10 exceedances (over the 130 due
to background alone) (worst case year meteorological year 2009)
For a constant PM2.5 background, there were no exceedances in 2022
and 2031 (2009 to 2013). Additional modelling with a time varying
background (2015/2016) showed 1 additional PM2.5 exceedance (over
the 7 due to background alone).
8/24/2017 14PM10 exceedance locations - 2022
In 2022 most
exceedances
occur close to
the ventilation
structures in
non-residential
areas.
8/24/2017 15PM10 exceedance locations - 2031
In 2031 most
exceedances
occur close to
the ventilation
structures in
non-residential
areas.
8/24/2017 16Ventilation structures
Sensitivity analysis:
Compliance for all scenarios and pollutants assessed,
except for PM10 and PM2.5, again essentially due to
background concentrations
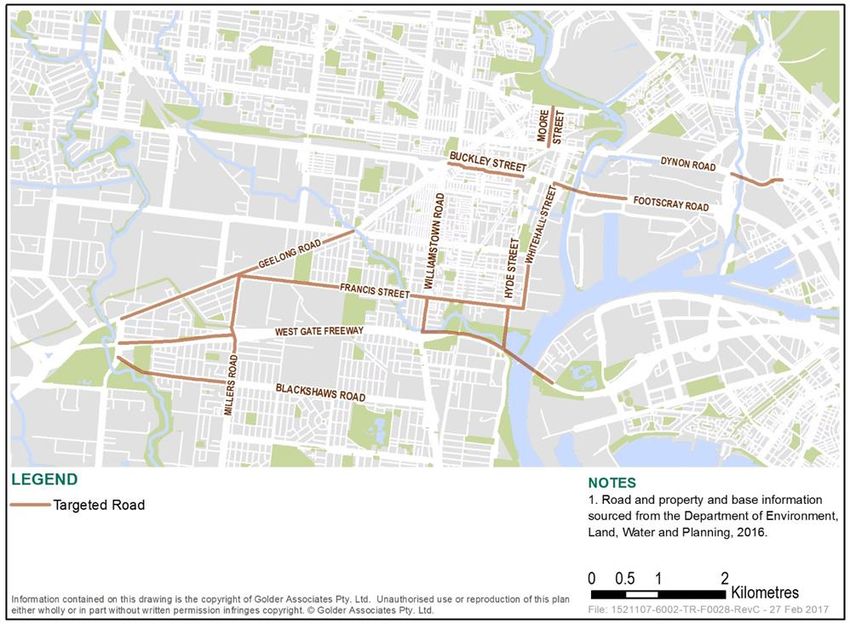
8/24/2017 17Surface roads 8/24/2017 18
Surface roads

8/24/2017                   19
Sensitive receptors

8/24/2017                   20
Surface roads (exhaust only)

 Surface roads
 modelling shows
 increased maximum
 PM10 and PM2.5
 concentrations
 alongside some major
 roads, however overall
 a net community
 benefit with the project.

8/24/2017                            21
Surface roads (exhaust & non-exhaust)

            Additional
            modelling
            conducted to
            assess inclusion
            of non-exhaust
            emission factors,
            with higher
            maximum PM10
            and PM2.5
            concentrations
            predicted.

8/24/2017                                 22
Surface roads
2016/2017 ambient air quality data average increments above Footscray and annual
average modelling predictions for the 2022 base case.
On the basis that an improvement in air quality would be expected in the future, exhaust only
modelling is considered to provide the best estimate for Francis Street but may under-predict for
West Gate Freeway. Exhaust & non-exhaust modelling would appear to over-predict however it
should be recognised that these are not direct comparisons.
Closest to AAQMS
Monitoring
Road Contaminant Period Units
(2016/2017)
Exhaust &
Exhaust only
non-exhaust
Francis St PM10 Annual µg/m3 1.7 1 4.1
PM2.5 Annual µg/m3 1.1 0.9 2.4
3
West Gate Fwy/Primula Ave PM10 Annual µg/m 5.7 0.7 4
3
PM2.5 Annual µg/m 2.8 0.7 2.3
8/24/2017 23Surface roads
2016/2017 Primula Avenue ambient air quality data shows:
mean NO2 concentration 6.7 ppb above Footscray
modelling predicts 4.4 ppb for 2022 base case
(maximum West Gate Freeway receptor)
8/24/2017 24Combined impacts 8/24/2017 25
Combined impacts
            24 hour PM10 – Most impacted receptor (2031 base scenario)

8/24/2017                                26
Combined impacts
24 hour PM10 – Most impacted receptor (2031 project scenario)
Combined impacts
assessment further
demonstrates the
negligible impacts of
the tunnel ventilation
structures, even under
the unrealistic
maximum capacity
sensitivity analysis
scenario.
8/24/2017 27Combined impacts
24 hour PM10 – Most impacted receptor (2031 maximum tunnel capacity)
8/24/2017 28Combined impacts
24 hour PM2.5 – Most impacted receptor (2031 base scenario)
8/24/2017 29Combined impacts
24 hour PM2.5 – Most impacted receptor (2031 project scenario)
8/24/2017 30Combined impacts
24 hour PM2.5 – Most impacted receptor (2031 maximum tunnel capacity)
8/24/2017 31Combined impacts
1 hour NO2 – Most impacted receptor (2031 project scenario)
8/24/2017 32Combined impacts
1 hour NO2 – Most impacted receptor (2031 maximum tunnel capacity)
8/24/2017 33Model selection
Modelling Uncertainties and Near-Road PM2.5: A
Comparison of CALINE4, CAL3QHC AND AERMOD,
University of California Davis, 2008
“Our comparative assessment suggests that AERMOD
under‐estimates near‐road PM2.5 concentrations at the Sacramento
site. This is consistent with two previous studies that have shown
under‐predicted PM10 concentrations in AERMOD (Kesarkar et al.,
2007; Zhang et al., 2008). Prior works, together with these findings,
suggest that AERMOD may be inappropriate for estimating PM
concentrations near roads.”
8/24/2017 34Model selection
Guidance Notes for Using the Regulatory Air Pollution Model
AERMOD in Victoria, EPA Victoria, Publication No. 1551, October
2013
“It is recognised that AERMOD concentration predictions for area sources in the
current approved version of AERMOD are likely to be overestimated under very
light wind conditions (i.e. for wind speeds less than 1 m/sec)……. EPA Victoria
recommends that the interim USEPA approach be adopted until further notice with
a volume source approximation used for cases when the key receptors are
sufficiently distant from the source.”………The following options should not be
used without specific approval by EPA Victoria……OLM and PVMRM option for
modelling conversion of NOx to NO2.”
8/24/2017 35Model selection
USEPA, January 17, 2017
“The EPA is replacing CALINE3 with AERMOD as
the Appendix A preferred model for refined modelling
for mobile source applications.”
“3 year transition period before AERMOD is required
as the sole dispersion model for refined modelling in
transportation conformity determinations.”
8/24/2017 36Model selection USEPA, 11th Modelling Conference, RTP, NC, August 2015 8/24/2017 37
Model selection

            Correspondence to GRAL users from Section Air Quality Control,
            Department Housing, Energy & Technology, Government of Styria,
            Austria

            “A serious bug has been detected in version 17.1. Please, do not use the
            GRAMM export function” 9 August 2017

            “I deeply regret to say that there is still an error in version 17.8 of the GUI
            in the GRAMM export function. Please do not use this function until a new
            version has been uploaded.” 18 August 2017

8/24/2017                                          38
Model selection
East West Link
only NO2 modelled for surface roads
no combined emissions impact assessment
AUSROADS used
CityLink Tulla widening
EPA Victoria emission factors
non-exhaust emissions not considered
Only CO, NO2 and PM10 modelled
Footscray 75th percentile constant backgrounds, not time varying
NO2 assumed to be 15% of NOx
CAL3QHCR used (also for North Connex in Sydney)
8/24/2017 39Background selection 8/24/2017 40
24 hour PM10 concentrations
                                    70

                                         State Environment Protection Policy (Ambient Quality Management) Schedule B Intervention Level
                                    60

                                         State Environment Protection Policy (Ambient Air Quality) Environmental Quality Objective
                                    50
            Concentration (µg/m3)

                                    40

                                    30

                                    20

                                    10

                             0
                           1 Aug 2016                     1 Oct 2016                1 Dec 2016              1 Feb 2017               1 Apr 2017          1 Jun 2017
                                                     Footscray                                     Alphington                                 Donald McLean
8/24/2017                                                                                               41
                                                     Francis Street                                Primula Avenue                             Woods Street
                                                     Yarraville Gardens                            SEPP(AAQ) PM₁₀ EQO                         SEPP(AQM) PM₁₀ IL
24 hour PM2.5 concentrations
45
40
State Environment Protection Policy (Air Quality Management) Schedule B Intervention Level
35
30
Concentration (µg/m3)
State Environment Protection Policy (Ambient Air Quality) Environmental Quality Objective
25
20
15
10
5
0
1 Aug 2016 1 Oct 2016 1 Dec 2016 1 Feb 2017 1 Apr 2017 1 Jun 2017
Footscray Alphington Donald McLean
8/24/2017 Francis Street Primula42Avenue Woods Street
Yarraville Gardens SEPP(AAQ) PM₂.₅ EQO SEPP(AQM) PM₂.₅ ILDaily maximum 8 hour CO concentrations
2.0
1.8
1.6
1.4
Concentration (ppm)
1.2
1.0
0.8
0.6
0.4
0.2
0.0
1 Aug 2016 1 Oct 2016 1 Dec 2016 1 Feb 2017 1 Apr 2017 1 Jun 2017
8/24/2017 Footscray 43
Alphington PrimulaDaily maximum 1 hour NO2 concentrations
160
State Environment Protection Policy (Air Quality Management) Schedule B Intervention Level
140
State Environment Protection Policy (Ambient Air Quality) Environmental Quality Objective
120
Concentration (ppb)
100
80
60
40
20
0
1 Aug 2016 1 Oct 2016 1 Dec 2016 1 Feb 2017 1 Apr 2017 1 Jun 2017
8/24/2017 Footscray Alphington Primula 44 SEPP(AAQ) NO₂ EQO SEPP(AQM) NO₂ ILAAQMS Comparison with Footscray
AAQMS data shows
that PM10 and PM2.5
concentrations at
Francis Street and
Yarraville Gardens
compare well with
Footscray, with Donald
McLean Reserve and
Primula Avenue higher
due to proximity to West
Gate Freeway.
8/24/2017 45Roadside monthly NO2 concentrations
Golder monthly NO2
roadside monitoring
readily shows
compliance with
SEPP(AAQ) annual
objective
8/24/2017 46Emission factor selection
2010 COPERT Australia g/VKT
2010 PIARC g/VKT
8/24/2017 47Emission factor selection
2010 COPERT Australia g/VKT
2010 PIARC g/VKT
8/24/2017 48Emission factor selection USEPA Moves 2014 brake wear 8/24/2017 49
Emission factor selection

8/24/2017                   50
Emission factor selection

 USEPA Moves 2014
 tyre wear

8/24/2017                       51
Emission factor selection

 USEPA Moves 2014
 tyre wear

8/24/2017                       52
Emission factor selection

  Contributions of Tire
  Wear and Brake Wear to
  Particulate Matter
  Emissions Inventories for
  On-Road Mobile Sources,
  Sonoma Technology, April
  2015

8/24/2017                           53
Emission factor selection
            PM10                        PM2.5

8/24/2017                          54
Filtration systems
Impact of tunnel ventilation structure emissions on ambient air quality are negligible.
NHMRC 2008 - the most effective way to manage air quality both in and around
tunnels is through vehicle fleet emission reductions.
M5 East tunnel trial 2012 – cost of PM10 reduction ($ per tonne) is substantially
greater than the cost of implementing emission standards for wood heaters,
replacing diesel locomotives and providing shore side power at Port Botany.
NZTA 2013 - the available evidence to date suggests that the effectiveness of
pollution control technology for removing emissions from vehicles in tunnels is
questionable.
EPA Victoria 2014 - previous tunnel ventilation system approvals did not require
filters as emissions are diluted to a point where filters would not provide a significant
benefit to the community.
8/24/2017 55Ultrafine particles
No EPA Victoria background data on ultrafine particles - represent a sub-
fraction of PM2.5, which is monitored.
No ambient air quality standards in Australia or overseas for PM1 or PM0.1.
WHO note that “while there is considerable toxicological evidence of
potential detrimental effects of ultrafine particles on human health, the
existing body of epidemiological evidence is insufficient to reach a
conclusion on the exposure-response relationship to ultrafine particles.
Therefore no recommendations can be provided at present as to guideline
concentrations of ultrafine particles”.
No recognised standard methods for measuring ultrafine particles in
ambient air in Australia or overseas.
8/24/2017 56IAC interim advice
Issue:
“Concern about the appropriate background data has also been raised by EPA”
Response:
EPA Victoria has not raised concerns about the use of Footscray data as background
Issue:
Precinct 15 was not included in the modelling
Response:
Receptors in Precinct 15 were included in the model
Issue:
Contour plots were not provided
Response:
Contour plots were provided in Appendix E of Technical Report G
8/24/2017 57IAC interim advice
Issue:
Ventilation stack modelling was restricted to a radius of 1 km
Response:
Modelling was conducted over a 10 km by 10 km grid
Issue:
There are 32 additional exceedances of the PM10 criteria…with project contributions up
to 23 µg/m3….for the ‘normal’ scenario with two lanes operational.”
Response:
The number of exceedances and project contribution quoted are for the sensitivity
analysis which assumed three lanes at maximum capacity, 24 hours per day and 40
km/h, not normal operation
8/24/2017 58IAC interim advice
Issue:
“EPR AQ1…should include a requirement in the design to include provision for the
retrofitting of pollution control equipment.”
Response:
EPR AQP3 allows for provisions for the retrofitting of pollution control equipment
Issue:
The influence of grades within the tunnel has not been taken into account
Response:
Emission factors were adjusted for grade, one of the advantages of PIARC factors
8/24/2017 59IAC interim advice
Issue:
Modelling should have been done on emission factors for vehicles not in-tunnel
standards for NO2
Response:
Modelling was conducted using NOx vehicle emission factors. A sensitivity analysis
was also conducted looking at the unlikely event that NO2 was emitted at a
concentration equal to the in-tunnel criterion 24 hours per day.
Issue:
“The AQIA predicts that there will be up to an 87% increase in PM10 levels at
sensitive receptors along Millers Road”
Response:
Modelling predicts that there would be a 3.3% to 5.3% in PM10 concentrations at the
most impacted receptor on Millers Road, depending on the averaging period
8/24/2017 60You can also read