PRESENTATION OF NEPAL - Prepared by Basudev Pokharel Mechanical Engineer Ministry of Physical Infrastructure and Transport Nepal - unece
←
→
Page content transcription
If your browser does not render page correctly, please read the page content below

PRESENTATION OF
NEPAL
         Prepared by
      Basudev Pokharel
    Mechanical Engineer
      Ministry of Physical
 Infrastructure and Transport
           Nepal.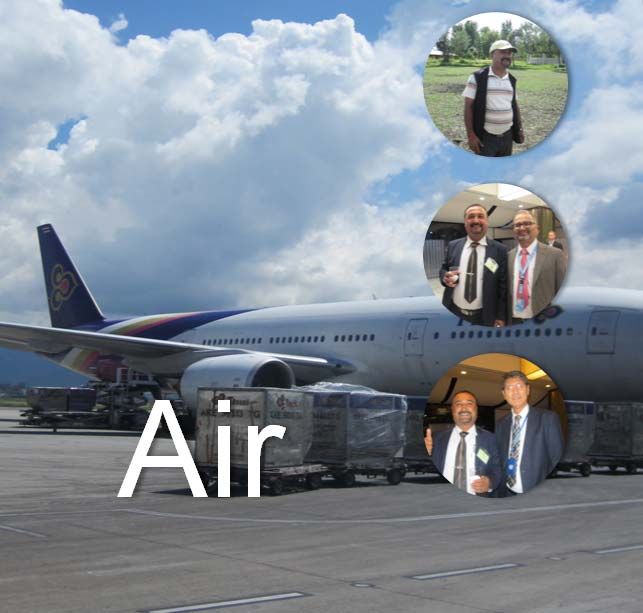
TITLE OF WORKSHOP

“Regional Capacity Building
Workshop on measurement of
Inland    Transport    CO2
Emissions and Mitigation
Policies”
TWO TRANSPORT

                Road
INTRODUCTION OF
NEPAL
Population: 26,494,504
Land area: 15 million
hectors
Mountains: 75 percent
Rural area: Almost 78 percent
Nepal is a landlocked country.Most of the people are unemployed and some migrate to other countries. Nepal’s current GDP per capita is about $1,000. It is the second largest country in the world to have more water resource. Its water resources are so big that it helps to provide immense potential for hydroelectric development.
Nepal is also rich in natural and
medical herbs found in mountain
region. There are coal, iron ore,
Magnesite,       copper,    cobalt,
limestone, pyrite and mica.

Nepal is also rich in its forest
resources. Nearly 1/3 rd of the
Nepal’s area is forested.
Mt. Everest is famous thing to see in
Nepal. Thousands of tourists come.
Nepal to see its Natural beauties and
sceneries.
People spend a lot of money in
trekking, hunting, mountain climbing
and many of other stuff.
Tourist from all around the world
comes to Nepal for rafting in these
dangerous rivers. There are also many
lakes in Nepal.
The Lord Budda Birth Place is Nepal
TRANSPORTATION
In Nepal, four different modes of
transportation are available:
    • Surface transportation: Roadways,
      Railways
    • Air     transportation:    Domestic,
      International
    • Water transportation: Ferries, Boats
    • Cable transportation: Rope-ways,
      Cable Car
ROAD STATISTICS The total of 23,209 km of road was constructed comprising 9,902 km black topped; 5,670 km graveled, and 7,637 km earthen (fair weather) roads. Regular and periodic maintenance work of the total 6,575 km road was carried out.
TRANSPORT
The number of transportation vehicles
registration has reached 1,280,690.
The maximum number of registered
vehicles is motorcycle followed by the
car.
During the span of 13 years the number
of registered vehicles has increased by
5.2 times.
CONTD…
Heavy-duty vehicles, like buses,
trucks and construction equipment
have also increased in number and
they consume a relatively large
quantity of petroleum products
emitting more and more GHG
emissions and pollutants causing
air pollution.
RAILWAY
The country has total railway line of 59 km.
The Nepal Railway Company (NRC) owns 53
km.
32 km from Jaynagar, India to Janakpur,
Nepal and
21 km from Janakpur, Nepal to Bijalpur,
India.

The Indian Railway manages the 6 km
railway line from Birgunj to Raxaul.
AIR TRANSPORT

Total Airport: 54; Working
Condition: 39; providing service
throughout the year 19 only. 8
airports are closed, 5 are under
construction and 2 are recently
proposed.
1 International Airport
CONTD…

Most of the airports are just
green long fields without
modern navigation system. In
some parts of Nepal air
transportation is the only
choice to get to their
destination.
CONTD..

The capital Kathmandu has links
with other cities such as; New
Delhi,  Kolkata,   Hong   kong,
Karachi, Dubai, Lhasa, Dhaka,
Colombo, Bangkok, Singapore,
Malaysia, China and other major
cities.
CONTD…

Total no of airlines: International
29 and Domestic 18.
Regular Domestic airlines: 7
Agni Air, Buddha Air, Guna Air,
Nepal Air Corporation, Sita Air,
Tara Air, Yeti Air.
NO OF VEHICLE

        1999/00    2012/13
Total   2,43,990   12,80,690
CONTD… The composition of motorcycles is the highest with 73.2% among registered vehicles in the Kathmandu valley followed by cars with the share of 18.5%. Public transportation constitutes only 2.5% of the total passenger vehicles in the Kathmandu Valley.
STUDY 1
Technology and Rural Upliftment Service
Team (TRUST) Pvt. Ltd submitted a study
report on “Detailed energy consumption
survey in transport sector of Nepal” to
WECS in 2000 where it has reported the
poor data management system. It is still
very difficult to get the exact number of
vehicles that are in running conditions, the
specific fuel consumption record and the
mileage of the vehicles by type.
STUDY 2
A study was conducted on “Economics of
reducing greenhouse gas emissions in South
Asia” Options and Costs in five South Asian
Countries: Bangladesh, Bhutan, Maldives,
Nepal and Sri Lanka, where the authors have
mentioned that the total energy-related GHG
emissions in the five South Asian countries
(without India) would be 3.3 times higher in
2030 than that in 2005 in the base case.
(Shrestha et.al., 2013).
STUDY 3
The Kathmandu Valley, Nepal’s
major urban center, now has air
pollution that is comparable to that
of other industrialized cities in Asia,
such as Bombay, Calcutta, Delhi,
and Shanghai (Tuladhar, 2008).
STUDY 4
A similar observation on “deterioration of air
quality and its impact on health” has been
reported by ICIMOD (2007). The rapid
increase in urbanization in the Kathmandu
Valley and the concomitant rise in the
number of vehicles are responsible for an
increased level of polluting gases and solid
particulate matters in the ambient air.
STUDY 5
The results of Shovakar Dhakal’s study
(2006) indicate that the Kathmandu Valley’s
motorized travel demand increased 8.7 times
in 2004 from nearly one billion passenger-km
in 1989 and suggest that it will increase to 27
billion passenger-km by 2025.
the rate of ownership of cars and
motorcycles is expected to double and the
length of road available per vehicle to
decline by one-third by 2025.
STUDY 6
Rapid population growth, urban sprawl,
and increasing motorization in the
Kathmandu       Valley    are    creating
complexity of traffic congestion, poor
public       transportation      system,
pedestrian and vehicular conflict, and
poor air quality are the major factors of
air polution(Udas,2012).
NEPAL VEHICLE MASS EMISSION
STANDARD, 2012:

“Maximum limitation of Positive Ignition
Engines, Type Approval and Conformity of
Production”
A. Verifying exhaust
     Limit Values,   emissions
                   Grams per Kilometer
Type of     Mass of    Mass of    Mass of
Vehicle     carbon     Hydrocarbo Nitrogen
            monoxide   n (HC)     Oxide (NO
            (CO)                  x)
Passenger   2.3        0.2        15
Cars
NEPAL VEHICLE MASS EMISSION
STANDARD, 2012:
Note: The driving cycle adopted by the vehicle
manufacturing countries in accordance with the principles
of EURO III driving cycle will be accepted.
B. Carbon Monoxide
Carbon Limit Values with catalytic converter
Monoxide At idle speed =0.3% by volume
At increased idle speed (>2000 rpm) =
0.2% by volume; and λ=1± 0.03NEPAL VEHICLE MASS EMISSION
STANDARD, 2012:
C. Low temperature test:
Limit Values, Grams per Kilometer
Type of Vehicle Mass of carbon Mass of
monoxide (CO) Hydrocarbon
(HC)
M1 and N1C11TRANSPORT EMISSION IN NEPAL 456 GjCO2e emissions from the transportation sector, which is nearly 5% of the net emission and remaining 95% from other sector (National Communication Report, 2004). 1,906 GjCO2e in Fiscal Year 2012/13. Note: GjCO2e: Giga-joules Carbon Dioxide Equivalent
NEPAL VEHICLE MASS EMISSION
STANDARD, 2012:

“Maximum     limitation   of Compression
Ignition Engines, Type Approval and
Conformity of Production”
”    Limit Values, Grams per Kilometer
A. Verifying
Type of      exhaust
          Mass       emissions
               of Hydrocarb Mass of PM
Vehicle   carbon     on (HC)   Nitrogen
                     and
          monoxide             Oxide
                     Nitrogen
          (CO)       Oxide(HC+ (NO x)
                     NOx)
Passeng   0.64       0.56      0.50       0.05
er Cars
CHALLENGES Inefficient structure, poor monitoring and lack of accountability of public. Weak resources of domestic and heavy dependence on foreign assistance in the road sector. 60% of the road development expenditure is received from donors. Poor accessibility in the remote hill and in the mountainous districts of the country.
CONTD…
Poor maintenance system of motor
vehicles     which       causes   an
increasing number of polluting
vehicles and road accident.
Unreliability of transit service.
Lack of integrated section policies
and an effective implementation
strategy.
COCLUSION
The number of vehicles is increasing year
by year and there are few old and not well-
maintained vehicles running on the
streets. They are the main culprits of
pollution. Besides, the freight carriers are
overloaded. They not only pollute but also
consume more fuel and thus emit more
GHG. The more vehicles are on the roads
the more emission of GHG.
GHG emission increased by 2.7 times
during this period.
CONTD…
Vehicle kilometer travelled and fuel
consumption by vehicle type has
been identified. The numbers of
vehicle that are registered at DoTM
and are in running condition are
calculated.
CONTD…
The introduction of bus rapid transit,
electric vehicles or hybrid vehicles
should be reduce the use of fossil fuel
and introduction of bio-fuel like ethanol
and biodiesel should be ultimately
reduce the GHG from transportation.
Law carbon       vehicles   should    be
considered.
CONTD…
 Maintaining   the   fuel   quality,
performing repair and maintenance
of vehicles in regular basis and
regular maintenance of road should
be reduce the vehicular emissions.
CONTD…
Petroleum products are also used
for other purposes in industries,
business centers, agriculture etc.,
such as for running captive
generator sets and water pumping,
causing more emission of GHG.
Thus, alternative energy should be
manage.
CONTD…
Though      GHG       emission      from    air
transportation is not that significant in
comparison to road transportation at the
present context, there is always possibility of
adding more airplanes for domestic flights
and this will also lead to increase in the GHG
emission in future. If the road infrastructure
is well established the number of air flights
can be maintained at the minimum level.
THE END
You can also read