Environmental protection Plan for the fee period March 2017 - February 2021 ADR Economic Regulation Agreement
←
→
Page content transcription
If your browser does not render page correctly, please read the page content below
Environmental protection Plan for the fee period March 2017 –
                       February 2021

           ADR Economic Regulation Agreement
Contents

-   REFERENCE CONTEXT

-   UPDATE OF CDP ANNEX 10 – 2017-2021 SUB-PERIOD

-   FINAL VALUES OF CDP INDICATORS – YEAR 4

                                                    2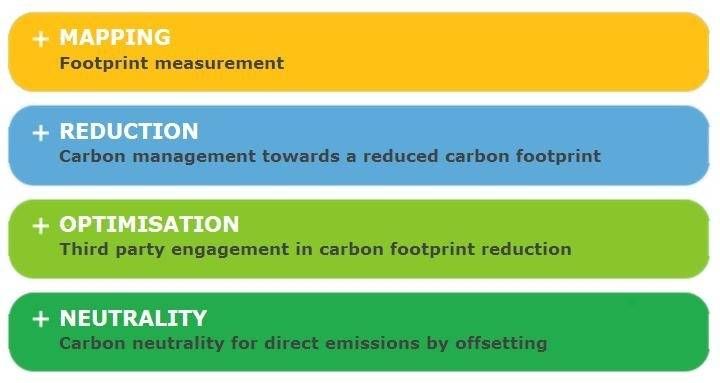
THE CONTEXT: ENVIRONMENTAL PROTECTION AT ADR
For ADR combining economic growth with environmental protection, while implementing
concrete measures for environmental sustainability, is a strategic priority
As early as 1999, our corporate commitment to environmental protection and our stance
towards sustainable development had led us to achieve the initial ISO 14001 certification of our
Environmental Management System, for the Fiumicino airport
The Ciampino airport also achieved its ISO 14001 certification in 2001
In 2012, after implementing its Integrated Quality, Environment and Workplace Safety System,
ADR Group issued its “Comprehensive Policy on Quality, Environment, Energy, and
Occupational Safety and Health”
The Planning Agreement with ENAC was a new opportunity to strengthen ADR's commitment to
respect the environment and to encourage sustainability in its business
3
Contents

-   REFERENCE CONTEXT

-   UPDATE OF CDP ANNEX 10 – 2017-2021 SUB-PERIOD

-   FINAL VALUES OF CDP INDICATORS – YEAR 4

                                                    4
CRITERIA USED TO DEFINE THE INDICATORS FOR 2017-2021

    To choose and define the environmental indicators to add to the update of the Planning
    Agreement for the 2017-2021 five-year period, ADR took into account the following 3
    factors:

  1. ENAC's guidelines for 2015

  2. ADR's Environmental Management System

  3. Analysis of Stakeholder Priorities

                                                                                         5
1 - 2015 ENAC GUIDELINES

                     MORE EFFECTIVE AND MEANINGFUL INDICATORS

                                   In July 2015 ENAC issued new GUIDELINES to define the
                                        methods to be used to prepare/assess environmental
                                                         protection plans

                                         GROUP I - PRIORITY TARGETS
                                         -  Energy saving
                                         -  Generation of electricity using renewable sources
                                         -  Reduction of emissions
                                         -  Noise abatement
                                         -  Treatment of waste water

                                         GROUP II - NON-PRIORITY TARGETS
                                         -  Energy saving
                                         -  Renewable sources
                                         -  Waste management and treatment
                                         -  Treatment of waste water
                                         -  Soil

                                         GROUP III – SECONDARY TARGETS
                                         -  Personnel training
                                         -  Indirect measures that impact the environment
                                         -  Efficiency of materials

                                                                                                6
2 - ADR'S ENVIRONMENTAL MANAGEMENT SYSTEM
A FUNDAMENTAL TOOL FOR ENVIRONMENTAL ANALYSIS AND PLANNING
Activities at the Ciampino and Fiumicino airports are governed by procedures
and instructions that are compliant with the UNI EN ISO 14001 Environmental
Management System (SGA)
Those systems are based on the Environmental Analysis document
It provides a clear, complete, concise and up-to-date picture of both the most
relevant aspects concerning the environmental impact of the company's
business, and of the most significant organizational and management aspects
73 - ANALYSIS OF STAKEHOLDER PRIORITIES
In 2015 we analyzed the priorities of ADR's stakeholders, by interviewing a significant cross-section
of employees, local and national institutions, environmental associations, consumers, etc.
The analysis carried out shows that, among the 25 factors considered, environmental issues are
perceived as particularly important. The two areas found to be of greatest importance are
atmospheric emissions and improving energy efficiency. Proper management of waste was also
found to be a particularly sensitive topic, in sixth place.
4,00
3,50
3,00
2,50
2,00
1,50
1,00
0,50
0,00
8CRITERIA USED TO DEFINE THE INDICATORS FOR 2017-2021
MORE EFFECTIVE AND MEANINGFUL INDICATORS
For both Ciampino and Fiumicino, the indicators were selected among those
included in ENAC's guidelines and based on the following assumptions:
to prefer indicators with "greater environmental impact";
to select indicators on which ADR can exert more influence;
to focus on measures that can improve the performance of existing processes
and infrastructure, not considering the improvements that will be provided by the
planned new infrastructure.
Taking into account the Environmental Analysis and the priorities highlighted by our
stakeholders, ADR has concentrated its efforts on four action areas:
saving energy and reducing emissions into the atmosphere
optimizing waste management
reducing water consumption
implementing a change of culture
9ACTION AREAS for 2017-2021 CDP ENVIRONMENT INDICATORS:
continuation of the change process
1. Saving energy and reducing emissions into the atmosphere: Over the last three years ADR has
strengthened its commitment to reduce airport energy consumption by constantly reducing the kWh consumed
per passenger from 4.25 kWh/pax to 3.76 kWh/pax. ADR has committed to measure and reduce CO2 emissions
into the atmosphere and in 2014 FCO achieved level 3+ ACA certification and level 3 for CIA. For the 2017-2021
five-year period ADR plans to continue to save energy, focusing on optimizing and automatically controlling air
conditioning and lighting and on producing energy using renewable sources.
2. Optimizing waste management: In 2013-16 ADR developed an innovative waste collection system that
has made it possible to significantly increase the proportion of properly separated waste. At present, at FCO a
'door to door' collection system is in place, which involves paying a fee based on how well waste is separated.
For the next 2017-21 regulatory period, we expect to further strengthen this approach by increasing the
percentage of properly separated waste.
3. Reducing water consumption: Over the past few years, water consumption has steadily declined; in fact,
despite an increase in the number of passengers served, the consumption of drinking water has fallen by about
33% from 2013 to 2016, thanks to specific special upgrade operations. For the 2017-2021 five-year period, ADR
plans to further lower its consumption, by continuing the upgrade works on the distribution networks and by
installing meters throughout the network.
4. Implementing a change of culture: environmental sustainability is tightly linked to a change of culture of
all the operators that work in the airport area. To encourage this change, ADR will increasingly add to contracts
with its suppliers, new clauses that include accountability for compliance with environmental regulations and
adoption of environmental sustainability values. ADR plans to implement systematic tools to help its suppliers
adopt and respect those principles.
10SELECTED INDICATORS
1. Reduction of electricity consumption
2. Electricity generation by installing photovoltaic systems
3. Reduction of CO2 emissions: Use of low emission vehicles
4. Separated waste collection of non-hazardous waste
5. Reduction of consumption of drinking water
6. Checking the observance of the environmental clauses
included in contracts
111 – Reduction of electricity consumption
UE benchmark THE MEASURES
(kWh EE/pax) - Lighting equipment and air conditioning systems
5 control systems (Building Management System, light
sensors, motion detectors, etc.)
4
- Implementation of FDD system
- Implementation of lamp generation system
- Interfacing management systems with FIDS and
video cameras
Media Panel UE* ADR
- Implementation of a consumption measurement
system
FCO – MWh used CIA – MWh used
84.000 10.700
83.651 10.650
83.500 10.628
10.600
83.231
10.574
83.000 10.550
82.810 10.521
10.500
82.500
82.390 10.467
10.450
82.000 81.969 10.414
10.400
81.500 10.350
2017 2018 2019 2020 2021 2017 2018 2019 2020 2021
122 - Electricity generation by installing photovoltaic systems
THE MEASURES
- Installation of latest-generation photovoltaic systems with high yields and low module
degradation over time
- Installation of other RE plants (at FCO)
CIA – Energy from traditional sources
FCO – Energy from traditional sources
(non-renewable)
(non-renewable)
100,0% 100,0% 100,0% 100,0%
99,5% 99,5% 99,5% 99,5%
99,0% 99,0% 99,0% 99,0%
98,7% 98,7%
98,5% 98,5% 98,5% 98,5%
98,0% 98,0%
2017 2018 2019 2020 2021 2017 2018 2019 2020 2021
133 - Reduction of CO2 emissions: ACA certification
AIRPORT CARBON ACCREDITATION (ACA) – ACCREDITATION STEP
LEVEL 1
LEVEL 2
LEVEL 3
LEVEL 3+
The objective of the principle of compensation, that started with the Kyoto Protocol of
2005, is the reduction of CO2 worldwide
GOAL WAS ACHIEVED BY FINANCING PROJECTS IN DEVELOPING
COUNTRIES, WHICH COMPENSATE A PORTION OF THE CO2 PRODUCED BY
HUMAN ACTIVITIES
14Worldwide ACA certification, 2015
157 certified airports worldwide
South
Level Europe Asia-Pacific Africa North America America
2 in 2 3 in 3
1. Mapping 29 in 14 countries 6 in 5 countries countries 3 countries
2. Reduction 37 in 15 countries 12 in 7 countries 1 8 1
3. Optimization 20 in 10 countries 11 in 6 countries 0 2 in 2 countries 0
3+. Neutrality 22 in 5 countries 0 0 0 0
Airports worldwide that handle over 30 million passengers
3+ Neutrality 3 Optimization
Fiumicino London Heathrow
Amsterdam Paris Charles de Gaulle
Frankfurt
FCO is globally one of the few Munich
airports (with more than 30 million
passengers) to have achieved the Hong Kong
level of neutrality (3+) under the Istanbul Ataturk
ACA emission certification system
etc.
153 - Reduction of CO2 emissions: Use of low emission vehicles
THE MEASURES
- Replacement of part of the current vehicle fleet with low emission vehicles (mainly
hybrid/electric)
FCO - % of non low-emission vehicles CIA - % of non low-emission vehicles
100% 95%
90%
95% 94% 85%
82%
90%
87% 75%
85% 70%
80% 65%
79%
75%
55% 55%
72%
70%
45%
65% 65%
40%
60% 35%
2017 2018 2019 2020 2021 2017 2018 2019 2020 2021
ADR's commitment to replace its corporate car-pooling vehicles with other low-emission models is part
of its environmental policy aimed at reducing emissions from airport activities, primarily from directly
managed assets.
164 - Developing separated waste collection in AIRPORT TERMINALS
THE MEASURES
UE benchmark - Strengthening the control system by defining an
70% analytical system to determine the fraction of waste
collected with the "door to door" method, in order to
optimize the different recycling lines
50%
- Development of culture by means of periodic
meetings with the sub-licensees
- Optimization of the waste disposal structure
- Rationalization of the waste collection service
Media Panel UE* ADR
FCO - % separated waste collection in airport CIA - % separated waste collection in airport
56% 41%
terminals terminals
40% 40%
55% 55%
39%
54% 54%
38% 38%
53% 53% 37% 37%
36% 36%
52% 52%
35% 35%
51% 51%
34%
50% 33%
2017 2018 2019 2020 2021 2017 2018 2019 2020 2021
175 - Reduction of consumption of drinking water
THE MEASURES
- Analysis and monitoring of consumption by installing meters distributed on the network
- Optimization of utilization by identifying the uses that can be served by other types of water
- Optimization and upgrade of distribution networks
UE benchmark
(liters of water used/pax)
33 FCO – liters of water used/pax
15,55
15,45
15,41
15,35
15,25 15,26
15,15
16 15,05
15,10
14,95 14,95
14,85
14,79
14,75
14,65
2017 2018 2019 2020 2021
Media Panel UE* FCO
186 - Checking the observance of environmental clauses included in
contracts
THE MEASURES
- Update of the ADR procedure that governs environment related behavior
- Strengthening of the clauses on environmental issues present in Special Tender
Specifications
- Setting up an Audit team
- Environmental audits
- Implementation of an environmental Vendor Rating system
FCO - % of contracts NOT audited CIA - % of contracts NOT audited
100% 100%
95% 95%
90% 90% 90% 90%
85% 85% 85% 85%
80% 80% 80% 80%
75% 75%
70% 70% 70% 70%
65% 65%
60% 60% 60% 60%
55% 55%
50% 50%
2017 2018 2019 2020 2021 2017 2018 2019 2020 2021
19FCO ENVIRONMENTAL INDICATORS – 2017-2021 CDP
Environmental Indicators - FCO
Objectives
Indicator UoM Baseline year 2015 CdP weight 2017 2018 2019 2020
Reduction of energy
Reduction of energy consumption at
consumption (kWh), compared 84.071.268 0,24 83.650.912 83.230.555 82.810.199 82.389.843
terminals
to the baseline year
MWh produced by traditional
Electricity generation by installing sources (non-renewable),
100% 0,19 100,0% 99,5% 99,0% 98,7%
photovoltaic systems compared to the MWh
consumed
Replacement of vehicles for car-pooling % of non low-emission vehicles
94% 0,10 94% 87% 79% 72%
with low-emission vehicles compared to ADRs vehicle fleet
Separated waste collection of non- % of separated waste in
50% 0,24 51% 52% 53% 54%
hazardous waste passenger transit areas
% reduction in consumption (in
Reduction of consumption of drinking liters) of drinking water
15,57 0,19 15,41 15,26 15,10 14,95
water consumed per pax, compared to
the baseline year
Checking the observance of the
environmental clauses included in % of contracts NOT checked 100% 0,05 90% 85% 80% 70%
contracts
20CIA ENVIRONMENTAL INDICATORS – 2017-2021 CDP
Environmental Indicators - CIA
Objectives
Indicator UoM Baseline year 2015 CdP weight 2017 2018 2019 2020
Reduction of energy
Reduction of electricity consumption consumption (kWh), compared 10.680.932 0,29 10.627.527 10.574.123 10.520.718 10.467.313
to the baseline year
MWh produced by traditional
Electricity generation by installing sources (non-renewable),
100% 0,24 100,0% 99,5% 99,0% 98,7%
photovoltaic systems compared to the MWh
consumed
Replacement of vehicles for car-pooling % of non low-emission vehicles
100% 0,13 90% 82% 70% 55%
with low-emission vehicles compared to ADRs vehicle fleet
Separated waste collection of non- % of separated waste in
34% 0,29 35% 36% 37% 38%
hazardous waste passenger transit areas
Checking the observance of the
environmental clauses included in % of contracts NOT checked 100% 0,05 90% 85% 80% 70%
contracts
21Contents
- REFERENCE CONTEXT
- UPDATE OF CDP ANNEX 10 – 2017-2021 SUB-PERIOD
- FINAL VALUES OF CDP INDICATORS – YEAR 4
22FCO: final accounting of the fourth year of the first sub-period
FCO - AMBIENTE
Increasing (i) vs ADR performance
Indicator UoM Weight
Decreasing (d) (Lug 15 - Giu 16)
1) Noise detection central unit Number of fixed noise detection units/aircraft movements x 100,000 20% i 6,32
2) Up-time of noise monitoring network % uptime/hours of operation of the airport 11% i 93,1%
3) Separated treatment of waste Tonnes of separated waste collected/total tons of waste 20% i 75,0%
% with respect to the legal limit (125 mg/L) of the annual average concentration
4) a. Wastewater treatment - COD (mg/L of
O2)
of oxygen required for the chemical oxidation of organic and inorganic 9% d 27,8%
compounds in wastewater samples of the wastewater treatment plants
% with respect to the legal limit (25 mg/L) of the annual average concentration
4) b. Wastewater treatment - BOD5 (mg/L
of O2)
of oxygen required for the biochemical oxidation of organic compounds in 8% d 42,4%
wastewater samples of the wastewater treatment plants
% with respect to the legal limit (35 mg/L) of the annual average concentration
4) c. Wastewater treatment - Total
Suspended Solids (mg/L)
of total suspended solids in wastewater samples of the wastewater treatment 8% d 21,9%
plants
5) Energy efficiency KWh of energy used in the terminal/m3 of terminal 10% d 143,5
23CIA: final accounting of the fourth year of the first sub-period
Increasing (i) vs ADR Performance
Indicator UoM Weight
Decreasing (d) (Jul 15 - Jun 16)
1) Noise detection central unit Number of fixed noise detection units/aircraft movements x 100,000 20% i 19,4
2) Up-time of noise monitoring network % uptime/hours of operation of the airport 11% i 93,0%
3) Separated treatment of waste Tonnes of non-separated waste collected/total tons of waste 20% d 64,5%
% of the annual average concentration of oxygen required for the chemical
4) Wastewater treatment oxidation of organic and inorganic compounds in wastewater samples of the 25% d 100,0%
wastewater treatment plants
5) Energy efficiency KWh of energy used in the terminal/m3 of terminal 10% d 124,1
KWh of energy not produced by renewable sources/Kwh of energy used by
6) Use of renewable sources of energy airport
14% d 1,00
synthetic indicator 19,73
24You can also read