The present status of our knowledge about the highest-energy particles in Nature - GSSI Colloquium: 24 February 2021 Alan Watson University of ...
←
→
Page content transcription
If your browser does not render page correctly, please read the page content below
GSSI Colloquium: 24 February 2021

The present status of our knowledge about the
     highest-energy particles in Nature

                 Alan Watson
            University of Leeds, UK
          Emeritus Spokesperson, Pierre Auger Observatory
                     a.a.watson@leeds.ac.uk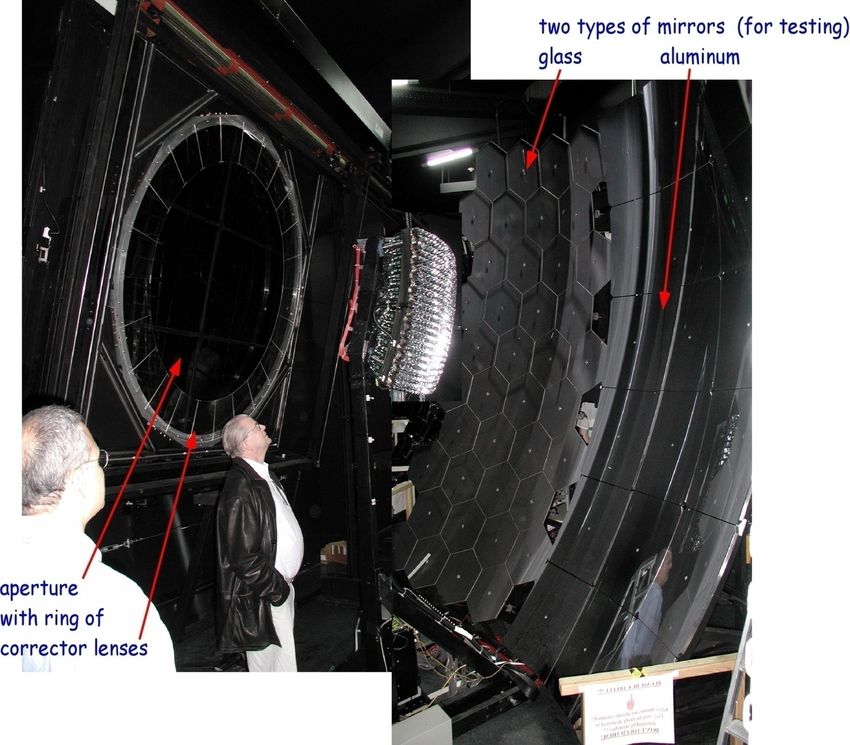
Compton            Vallarta   Anderson   Hess        Bothe Heisenberg   Clay      first row
Bethe             Teller         Oppenheimer            Rossi Auger                    second row
                                                                                                      2
Air Showers

                                              Simon Swordy
                                              - late 1990s
J A Simpson: Hess Lecture, Durban ICRC 1997                       3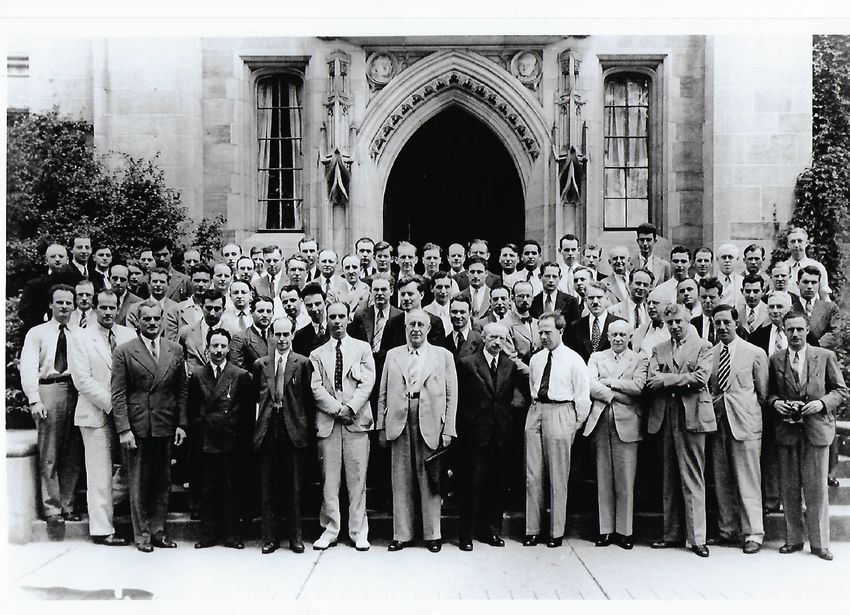
4
Tutorial on air showers

                      ~40 cm                                     ~50 cm

G R Evans: Mt Marmolda, Dolomites (3343 m) 1950   W B Fretter: Echo Lake (3230 m) 1949

                                                                                         5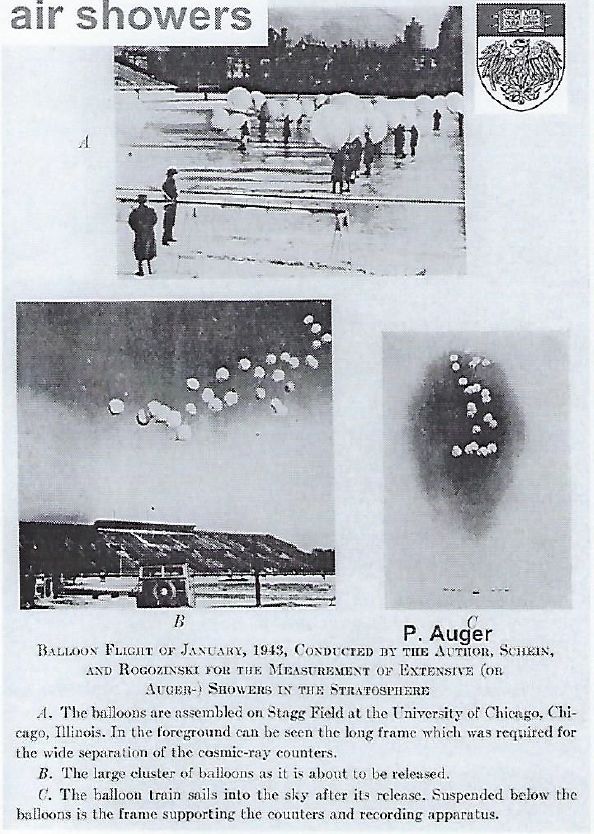
Accuracy of finding
                                          direction ~ 1°

Water-Cherenkov detectors

        ‘Fast timing’ gives the direction:
     Crucial when trying to establish the origin of the
       particles which travel across magnetic fields          6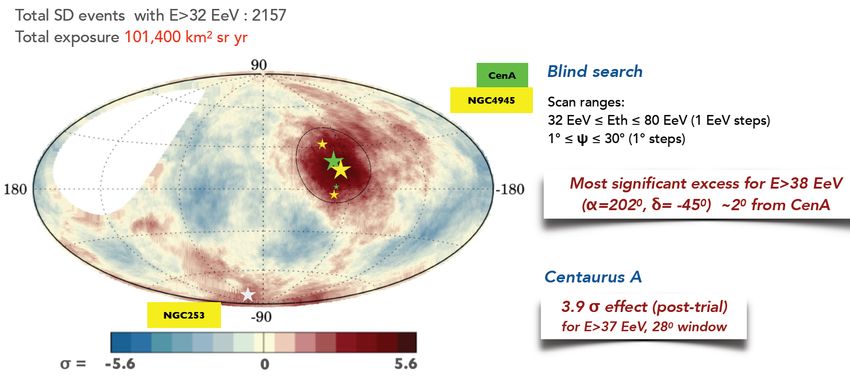
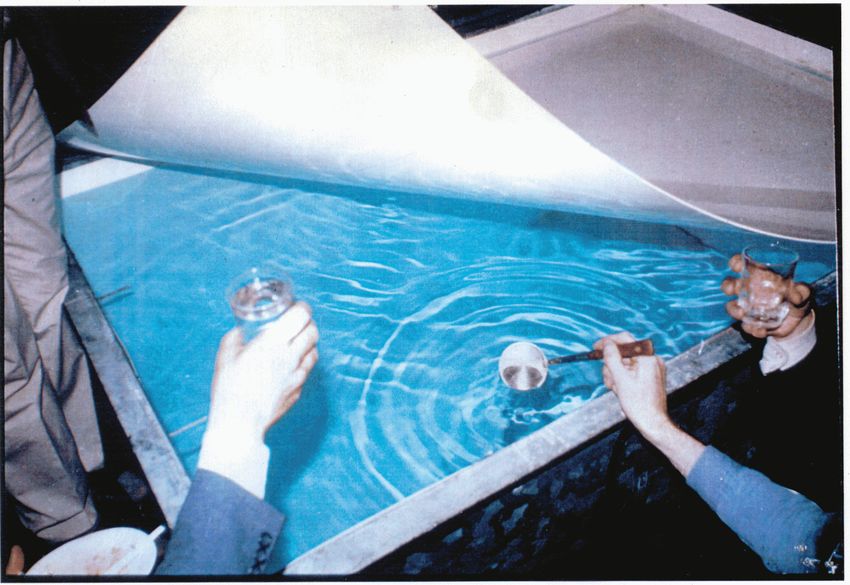
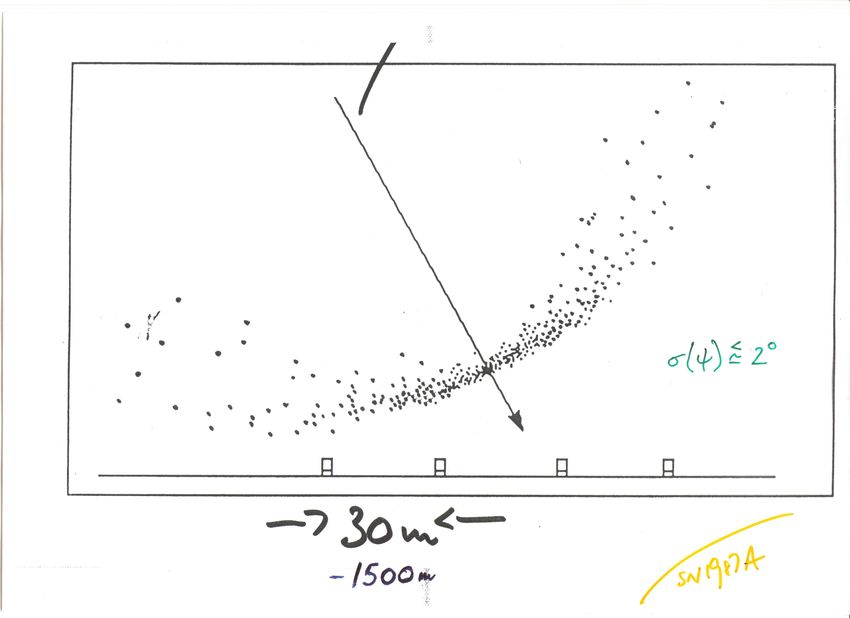
Event with energy of ~ 8 x 10¹⁹ eV recorded at UK Array,
              Haverah Park: 1967 - 1987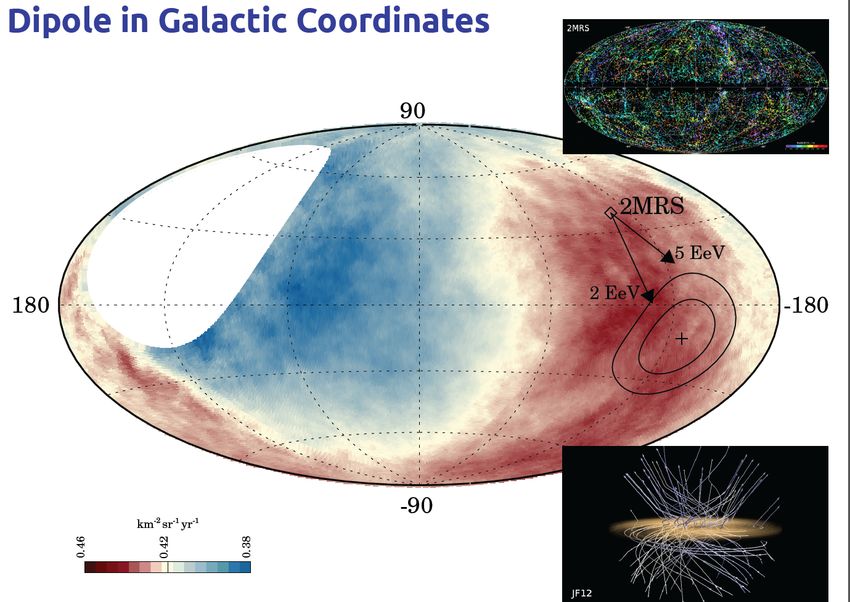
A tank was opened at the ‘end of project’ party on 31 July 1987. The
water shown had been in the tank for 25 years - but was quite drinkable!

                                                                           8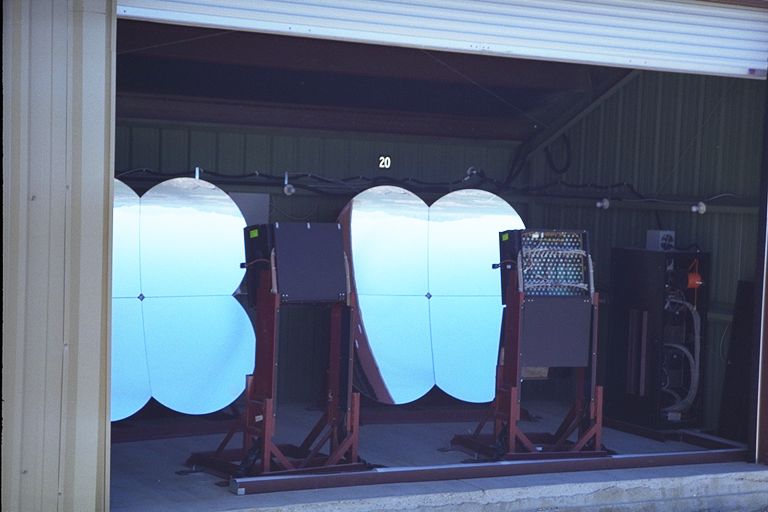
At ~ 3 x 10¹⁸ eV, ~ 15 km away:
5 W blue light bulb
moving at speed of light

                                                  Auroral
                                                   Light

                                        Visible

         250      300      350    400   450 nm

                                                            9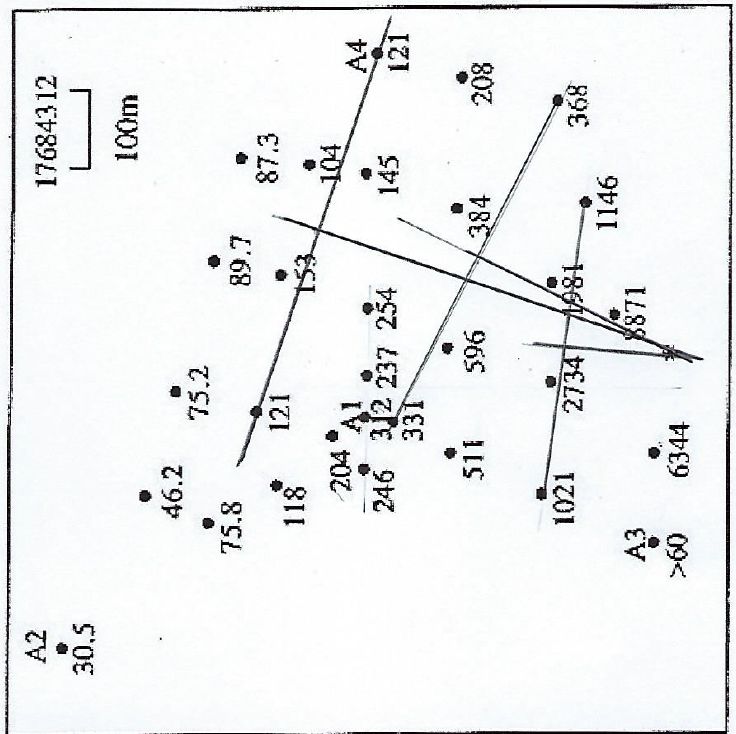
A Fluorescence Detector of the Utah University Group
                                                       10
x 1010
3 x 10²⁰ eV (?)
~ 50 Joules
Fly’s Eye Event: 15 October 1991
First reported in 1993 ApJ 441
144 1995 11~1990: different techniques gave different results –
- but agreed that rate is low:
~ 1 per km2 per century at 1020 eV
(~ 10/min on earth’s atmosphere)
• 1990: Need larger areas > 1000 km2
• 1991: Started work with Jim Cronin that led to creation
of the Pierre Auger Collaboration and Observatory
12The Design of the Pierre Auger
Observatory marries the two
techniques
- the ‘HYBRID’ technique
Fluorescence →
AND
Array of water-
Cherenkov detectors →
13
11
Enrique Zas, Santiago de CompostelaThe Pierre Auger Observatory: Malargüe, Argentina • 1600 water-Cherenkov
detectors: 10 m2 x 1.2 m
• 3000 km2
• Fluorescence detectors
L at 4 locations
.
LHC
H
C
• ~ three times area of Rome or
.
XLF .. eighth of area of Sicily
Majorca
CLF
Telescope Array in Northern Hemisphere is ¼ size 14The Auger Observatory Campus in Malargüe
The Office and Assembly Buildings in Malargüe
- funded by the University of Chicago ($1M)
1516
Fluorescence detector at Los Leones 17
A large event: 7 x 10¹⁹ eV

                                      Signal at 1000 m from
                                      densest part of shower (the core)
                                      is chosen to define the
                                      ‘size’ of the shower

                                                  Fall-off of signal
                                                  with distance

                 Footprint ~ 25 km2

                                                                       18
A Hybrid Event
Energy Estimate
- from area under
curve
(2.1 ± 0.5) x 1019 eV
must account for
‘invisible energy’ 19Getting the Energy and Xmax
202004: Data taking started with about 200 water-
Cherenkov detectors and two fluorescence
telescopes - 13 years after first discussions
Now over 80,000 km2 sr years for Energy Spectrum studies
HP After Michael Unger 2017
21Energy Calibration
3338 events
Most energetic event: S38 = 354 ± 11 VEM → EFD = (7.9 ± 0.6) x 1019 eV
Four FD Telescopes: Xmax = 763 ±8 g cm-2 E = (8.5 ± 0.4) x 1019 eV 22A Castellina: Highlight ICRC 2019 for this - and other slides 23
Spectral slope changes rapidly over most of energy range
                                                           24
Cosmic rays with energies above 8 EeV come from outside of our Galaxy: Science 357 1266 2017
3-D Dipole >8 EeV
(6.6 ± 1.2/0.8 )%
Significance ~ 6 sigma
25Dipole in Galactic Coordinates
43,533 galaxies
26Higher Energies: blind search above 32 EeV – Madison ICRC 2019 • 10 x 10 grid • Scan: 10
Other powerful sources: SGBs are nearby-candidates

                                                     28
29
Making Sky Maps to compare with data

• Weight contribution of objects in given catalogue according to EM flux

• Attenuation according to different distances

• Smearing angle ψ around each object - a free parameter

• Fraction of flux that is anisotropic, faniso, - a free parameter

• Test statistic: TS = 2 log[(ℒ (ψ, faniso)/ℒ (faniso= 0)]

• Scan in energy thresholds 32 EeV < Eth < 80 EeV in 1 EeV steps

• Four different catalogues and different models of spectrum and mass composition

   Will consider only two: γ-AGNs and Star Burst Galaxies

                                                                                    30
Results from the comparison of Sky maps with models
Object Eth ψ faniso TS Post-trial
Catalogue significance
Starburst 38 EeV 15 +/- 5◦ 11 +/- 5% 29.5 4.5 σ
γ-AGN 39 EeV 14 +/- 6◦ 6 +/- 4% 17.8 3.1 σ
31Question of Mass Composition
G Cocconi: Fifth ICRC, Guanajuato, Mexico, 1955
“We remain with the dilemma: protons versus heavy nuclei.
A clear cut decision cannot be reached yet.
I believe that up to the highest energies the protons are the
most abundant in the primary cosmic rays. However, I must
confess that a leak proof test of the protonic nature of the
primaries at the highest energies does not exist.
This is a very important problem. Experimentally it is quite a
difficult problem.”
32The variation of mass with energy
Xmax photons < 0.5 % above 10 EeV
protons
Data
Fe
dXmax/log E = elongation rate
Energy per nucleon is crucial
- Need to assume hadronic model
log (Energy)
33Given the necessity of using models, an important question is
“Are the cosmic-ray models adopted sensible?”
Here, the LHC results have proved an excellent test-bed
to evaluate three different models
• EPOS: parton-based Gribov-Regge Theory
• QGS: quark-gluon string model – multi-pomeron amplitudes
calculated to all orders (disfavoured by data)
• Sibyll: based on Dual-parton model – mini-jet model
• Each model has a different but self-consistent set of
phenomenological and theoretical assumptions to describe
hadronic interactions
This is ALL I really can tell you about the details of the models! 34Some Longitudinal Profiles measured at Auger Observatory
1000 g cm-2 = 1 Atmosphere ~ 1000 mb
rms uncertainty in Xmax < 20 g cm-2 from stereo-measurements 3536
37
38
Fraction of p, He, N and Fe as function of energy

       p                             few
                                     protons
Proton-dominance
Low Anisotropy
                                                     39
Potential as a neutrino detector
100 detectors hit
1019 eV, 4 µs, 13°Where we are now with data – the end of the beginning?
s ?
• Energy spectrum: well-measured with systematic uncertainties dominant until > 5 x 10¹⁹ eV
• New feature above ~1019 eV
ll u
• No declination dependence
s te
h i
• Arrival Directions: Anisotropies have been detected at last!!
• Low anisotropy around 1018 eV
f t
• Dipole above 8 x 10¹⁸
ll o
eV that grows with energy: significance over 6 sigma
a
• At highest energies γ-AGNs and Starburst galaxies starting to be seen
s
o e
• Mass Composition (dependent on hadronic models)
d
• Mainly protons from 1018 eV to ankle
t
a
• Getting heavier from 4 x 10¹⁸ eV
h
W
• At highest energies mass observed is consistent with medium (CNO) nuclei
• Only upper limits on neutrinos and photons
• BUT - absence of neutrinos quite consistent with observed mass distribution 41Remember Von Neumann’s elephant
JE3
log Energy
42Fit to model of Aab et al. JCAP 04 038 2017
• Identical sources in co-moving volume
• Rigidity-dependent acceleration: log10(Rcut/V) = 18.5 and γ ~1
43Ding, Globus and Farrar: arXiv 2101.04564 UHECR distribution and LSS
• UHECR distribution follows Large Scale Structure of Universe (Waxman 1997)
• All sources are standard candles in respect of luminosity, spectrum and
composition (2MRS catalogue 43,533 objects)
Conclusions:
Dipole anisotropy and evolution with energy explained
UHECRs > 8 EeV are NOT dominantly protons
44Ding, Globus and Farrar 2021 Auger Data
4546
‘Indirect’ multi-messenger astronomy

                                                  neutrinos, ν
                           Particles
                           and
                           photons                 n→     p + e- + ν

                                                   A (heavy nucleus)
                      e
                                       γ
                      +
                             e-                proton

                                           Cosmic ray accelerators produce cosmic
             Electromagnetic cascade
                                           rays, γ and ν with comparable luminosities
             → low energy gamma-rays
Unger, Farrar and Anchordoqui 2015
48Auger above 10 EeV
Auger ν-limit
49TA Results:
Important to recall that TA was When making comparisons with results from the Auger
designed specifically to check Observatory, the significantly smaller number of events
AGASA results with higher statistics from the TA Observatory should be kept in mind
Achieved: • Necessity to resort to models (and assumptions about
mass) to estimate primary energy
- Spectrum does show steepening √
• More limited checks on systematic uncertainties
- No clustering in arrival
• Necessity to make performance checks using Monte
directions is observed √
Carlo simulations (model and mass assumptions)
Reality of Hot Spot to be checked • Severe limitations in search for first harmonic in RA in
with TAx4 regions where point sources not expected:
Auger (> 8 EeV) TA (>8 EeV)
N 32187 ~3000
r = 0.47
p(> r)
= exp (-r2N/4) 2 x 10⁻⁸ 0.19
(9000 events p = 0.0069)
50Auger: RED
TA: BLACK
TA Spectrum compared with
Auger Spectrum:
Working Group results:
Deligny et al. ICRC 2019
TA: RED
Auger: BLUE
51TA measurements of Mass Composition
Reluctance from TA, in joint Working Group, to report data from measurements above 10 EeV
but:
Watson
2018 Paris
UHECR
meeting
“Fere libenter homines id
quod volunt credunt!”
arXiv: 2012.10372
My expectation:
TA mass estimates will move towards
those of Auger in an adiabatic manner
52What next? Auger Observatory Phase II
• AugerPrime: scintillators and radio antennae on top of water tanks.
Estimate mass more accurately: event-by-event at highest energies
Telescope Array: TA x 4 Area ~ 2800 km2
Main aim is to investigate the ‘Hot Spot’
Wider spacing (2.08 km) – 90% efficient at ~40 EeV 53Pierre Auger Observatory
End of Phase I: Summary of achievements
Papers published or in advanced stages of preparation
• Large Scale Anisotropy: Science and ApJ
• Energy Spectrum: PRD and PRL (editors highlights)
• High-energy anisotropy: under Collaboration review
• Xmax update (mass estimates): in preparation
• Photon limits published
• Neutrinos limits published
• Data Release: 10% of data publicly available from 15 Feb 2021
https://www.auger.org/opendata/
54You can also read