Prediction of long-term pattern and its extreme event frequency of rainfall in Cauvery delta basin - IJCRT
←
→
Page content transcription
If your browser does not render page correctly, please read the page content below
www.ijcrt.org                                              © 2021 IJCRT | Volume 9, Issue 4 April 2021 | ISSN: 2320-2882

     Prediction of long-term pattern and its extreme
    event frequency of rainfall in Cauvery delta basin
                           1
                            R.V.Gopika Shri, 2C.Surya,3N.Umashankar,4R.Parthiban,5R.Jayasankar.
1
    Bachelor of Engineering in Civil Engineering, 2 Bachelor of Engineering in Civil Engineering,3 Bachelor of Engineering in Civil
               Engineering,4Bachelor of Engineering in Civil Engineering,5Doctorate of Philosophy Civil Engineering,
                                                         1
                                                           Civil Engineering,
                                       1
                                         A.V.C College of Engineering, Mayiladuthurai, India.

      Abstract: A rain gauge is an artifact used in meteorological stations to help measure and collect precipitations that fall in a
      certain place. Precipitations are all hydrometeor tumbling to the earth from the climate, including precipitation, shower, hail,
      snow, and slush, mist, and so forth Downpour check networks give precipitation estimations a serious level of exactness at
      explicit areas at the same time, much of the time, the instruments are excessively inadequately conveyed to precisely catch the
      high spatial and worldly changeability of precipitation frameworks. Radar and satellite distant detecting of precipitation has
      become a suitable way to deal with address this issue adequately. Notwithstanding, among different wellsprings of
      vulnerabilities, the remote-sensing-based precipitation items are unavoidably influenced by testing blunders that should be
      assessed and described. While the rainfall is recorded by more than 3500 rain gauges set up by Indian Metrological
      Department and State Government. The precipitation value fluctuates from one spot to another and from one year to another.
      The annual average rainfall for the country is about 120cm and the country's Geographical area of km 2 is equivalent to 3916
      km3. The rainfall is measured by an instrument called a rain gauge. Rain gauge is also known as ombrometer or pluviometer.
      The rain gauge is classified as Recording and Non-Recording. The Standard non-recording rain gauge prescribed by the IMD
      is Symon's gauge. The details of the rain gauge can be obtained by Indian Standards IS 4986 2002. In our project, we have
      collected the data of rainfall from the year 2010-2020 in Mayiladuthurai District, Nagapattinam District, and Tanjore District.
      The details are to be studied then compared and analyzed in MS Excel and SPSS software. By using the collected rainfall data
      around 12 stations, we have prepared the chart. We have planned to set up the Standard Rain Gauge at AVC College of
      Engineering.

keywords - Hydrology, Rainfall, Cauvery delta zone, Trend, Monsoon, Frequency, Precipitation, Standard Rain Gauge, Data
collection, Chart Analysis, volume, etc.

I. INTRODUCTION
Hydrology is the science that envelops the investigation of water on the Earth's surface and underneath the outside of the Earth, the
event and development of water, the physical and synthetic properties, and its relationship with the living and material parts of the
climate. The average rainfall in India is 125 cm. India being a tropical country, its agriculture relies on the monsoon. In the current
examination, the Cauvery delta zone (CDZ) was picked for precipitation investigation as it is the rice bowl of Tamil Nadu state. It
covers the streams Cauvery, Vennaru, Kudamuruti, Paminiar, Arasalar, and Kollidam. The significant dams worked by this locale
are Mettur and Bhavanisagar. Canal irrigation, well irrigation, and tank irrigation are being practiced in this zone. Thanjavur locale
is a part of the Cauvery delta with rich and prolific soil. This region is contributing the significant piece of the food grains
dominatingly paddy to the state pool and subsequently ordinarily known as "Granary of South India". The northeast monsoon
(NEM) is the wettest period with the highest mean rainfall falling in November and December at all stations examination, the
southwest storm (SWM) is the driest season with the least mean precipitation tumbling from June to September. The Cold Weather
period (CWP) occurs between January to February. The hot weather period (HWP) occurs between March to May. Mayiladuthurai
districts receive the highest (405.61 mm) and Thanjavur districts (2.34 mm) recorded the lowest.

       IJCRT2104664            International Journal of Creative Research Thoughts (IJCRT) www.ijcrt.org                   5570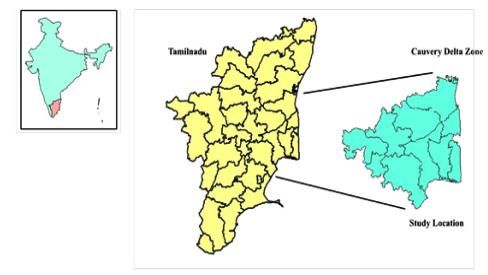
www.ijcrt.org © 2021 IJCRT | Volume 9, Issue 4 April 2021 | ISSN: 2320-2882
II. MATERIALS AND METHODS
2.1 Estimation of Rainfall data
The ordinary precipitation is the normal worth of precipitation at a specific date, month, or year over a predetermined 30-year time
span or something like that. The normal rainfall is updated every ten years like the Arithmetic average method, Comparison method,
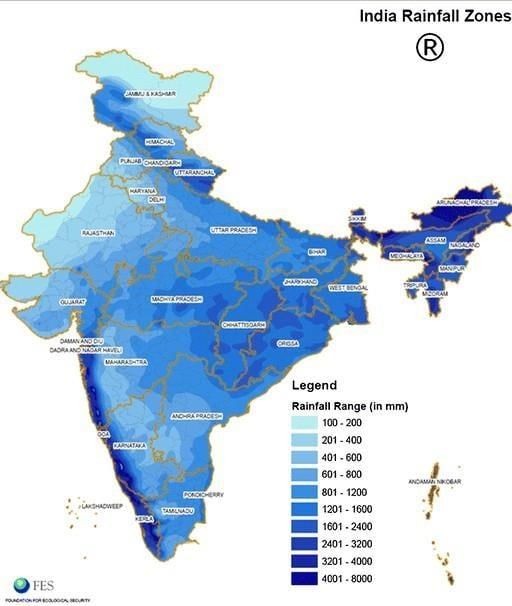
Normal ratio method, Isohyetal map method. The India Meteorological Department (IMD) defines four homogeneous rainfall zones
to represent the geographical distribution of regional Indian rainfall. These four homogeneous rainfall zones are northwest India
(NWI), northeast India (NEI), central India (CI), and south peninsula (SPIN), shown in Fig.1
Fig.1 Variability of precipitation
2.2 Kaveri delta zone
The Vennar River or Vennaaru is a waterway and distributary of the Kaveri River in the Kaveri delta. It moves through the
Thanjavur, Tiruvarur, and Nagapattinam locale of Tamil Nadu, India. Nagapattinam has a tropical savanna environment (Köppen
As) with a wet season from the upper east storm between October and December. During the remainder of the year, precipitation
is light to direct and well underneath expected evapotranspiration. Temperatures are hot to boiling consistently, with severe
stickiness
Fig.2 Cauvery Delta Zone Highlighted from Tamil Nadu
2.3 Study Location
Mayiladuthurai lies between 11º 1018’ northern latitude and 79º 6526’ of eastern longitude. Thanjavur lies between 9º 50' and 11º
25' northern scope and 78º 45' and 79º 25' of eastern longitude. Nagapattinam lies somewhere in the range of 10º10' and 11º20'
northern scope and 79º15' and 79º50' eastern longitude.
IJCRT2104664 International Journal of Creative Research Thoughts (IJCRT) www.ijcrt.org 5571
www.ijcrt.org                                            © 2021 IJCRT | Volume 9, Issue 4 April 2021 | ISSN: 2320-2882
2.4 Analysis and tools
 Mean, Standard Deviation (SD), and Coefficient of Variation (CV) was computed for rainfall and rainy days using MS word. SPSS
programming was utilized to examine the pattern of precipitation and Rainy days.
2.5 Study period
 The daily Rainfall observation from 2010 to 2020 were collected for all three Districts viz., Mayiladuthurai, Thanjavur, and
Nagapattinam district and were used for various calculations involved in the study.

Rainfall and rainy days variability statistics Rainfall Rainy days

                                             Fig 3 monthly normal of 10 years rainfall

The monthly rainfall normal arrived using observed data revealed that November the month having highest rainfall (405.61mm, 373.45 mm, and
216.19 mm for Mayiladuthurai, Nagapattinam, and Thanjavur respectively) for a month in all the three study locations.

     IJCRT2104664           International Journal of Creative Research Thoughts (IJCRT) www.ijcrt.org                         5572
www.ijcrt.org © 2021 IJCRT | Volume 9, Issue 4 April 2021 | ISSN: 2320-2882
2.6 DATA COLLECTION
The below table shows the comparison of rainfall data, it was very helpful in the study of hydrological and finding volume.
Year Mayiladuthurai Nagapattinam Thanjavur
2010 1627.6 1340.39 1769.7
2011 1129.4 1046.17 848.3
2012 852.1 884.17 699
2013 1274.6 856.47 1083.7
2014 1408 1014.55 816.3
2015 1691.4 1520.07 1047.6
2016 744.4 767.01 1119.9
2017 1366.3 1202.64 811.1
2018 1225 908.45 591.9
2019 1918.4 1403.95 889.5
2020 676.1 753.9 831.7
Table 1
Show of every day, week after week, month to month, or yearly precipitation information is shown either as specks or line joining
the dabs is known as Chronological chart
Yearly data-2010 to 2020
11.1018’N,79.6526’E
Max rainfall at 2019=1914.8mm
Min rainfall at 2016=744.4mm
11.1051’N,79.7421’E
Max rainfall at 2020=1749.3mm
Min rainfall at 2016=736.7mm
IJCRT2104664 International Journal of Creative Research Thoughts (IJCRT) www.ijcrt.org 5573www.ijcrt.org © 2021 IJCRT | Volume 9, Issue 4 April 2021 | ISSN: 2320-2882
11.2391’N,79.7361’E
Max rainfall at 2015=1992.8mm
Min rainfall at 2016=718.8mm
11.3307’N,79.7204’E
Max rainfall at 2015 =1925.1mm
Min rainfall at 2016=526mm
11.1981’N,79.6050’E
Max rainfall at 2015=1785mm
Min rainfall at 2016=759.4mm
Chronological charts are plotted with a moving mean. A moving mean may be used to damp out or smooth out the oscillations of
some of the random variables such as precipitation, streamflow, etc.
The above charts show the annual rainfall and average annual rainfall of stations in the chart.
IJCRT2104664 International Journal of Creative Research Thoughts (IJCRT) www.ijcrt.org 5574www.ijcrt.org © 2021 IJCRT | Volume 9, Issue 4 April 2021 | ISSN: 2320-2882
III. RESULTS AND DISCUSSION
3.1 Results of Descriptive Statics of Study Variables
This study of rainfall in the Mayiladuthurai, Nagapattinam, and Thanjavur district for the past 10 years is carefully studied and the
charts are prepared, based on the intensity of rainfall. Concerning the collected data and charts the maximum rainfall and the
minimum rainfall is calculated. The Volume of rainfall in Mayiladuthurai, Nagapattinam, and Thanjavur district are 25371126.44kl,
19056730.760kl, and 11064669090kl. Then a Standard rain gauge is implemented in our institution as per IS code. The information
acquired from this undertaking will assist us to take up comparable activities with mental fortitude and trust in the future course of
activities.
IV. ACKNOWLEDGMENT
We take great pleasure in conveying our thanks to our Head of the Department, 1Dr.R.JAYASANKAR M.E, Ph.D., for his
technical idea for the completion of the project.
References
[1] A textbook of Hydrology by Dr.P.Jayarami Reddi.
[2] Comparison of rainfall measurements from multiple instruments by X.c. Liu, T.c.Gao, and L.Liu from A College of Meteorology
and Oceanography, PLA university of science of technology, Nanjing, China.
[3] Estimating rain rates from tipping bucket rain gauge measurements by Jianxin Wang, Brad L.Fisher, and David B. Wolff.
[4] Sources of errors in rainfall measurements by Polarimetric radar: variability of drop size distribution noise, and variation of
relationships between R and Polarimetric parameters by guy on lee.
[5] Study of measurement of precipitation over an area by Permit Kumar Patil, Ajay Kumar Tandon, Assistant Professor, and
Resident Engineer, from Aisect University Raisen (M.P.), MSV International.
[6] E. Milewska, L. A. Vincent, Megan M. Hartwell, Kathleen Charlesworth, É. Mekis (2019), Adjusting precipitation amounts
from Geonor and Pluvio automated weighing gauges to preserve the continuity of observations in Canada.
[7] M. Szymanowski, M. Wieczorek, Marika Namyślak, M. Kryza, K. Migała(2018), Spatio-temporal changes in atmospheric
precipitation over south-western Poland between the periods 1891–1930 and 1981–2010.
[8] Spank U., 2010. Site Water Budget: Influences of Measurement Uncertainties on Measurement Results and Model Results.
[9] Leeper R.D. and Kochendorfer J., 2015. Evaporation from weighing precipitation gauges: impacts on automated gauge
measurements and quality assurance methods.
[10] Sigrid Dengel, A. Graf, T. Grünwald, M. Hehn, P. Kolari, M. O. Löfvenius, L. Merbold, G. Nicolini, M. Pavelka(2018),
Standardized precipitation measurements within ICOS: rain, snowfall and snow depth.
IJCRT2104664 International Journal of Creative Research Thoughts (IJCRT) www.ijcrt.org 5575You can also read