Madagascar rainfall climatology: Extreme Phenomena
←
→
Page content transcription
If your browser does not render page correctly, please read the page content below
Madagascar rainfall climatology:
                                Extreme Phenomena
T. Andry Arivelo, Professeur A. Ratiarison, Professeur M.Bessafi, Rodolphe Ramiharijafy

                                                 Abstract
Most don't surrender us consciously counts how much the climate fluctuates of one decade or one
century toward the next. The survey of climatology on a long period in term of precipitation is to
unique sense to use to note and to verify the reality. For the case of Madagascar, various statistical
techniques have been applied to the data of precipitations in order to have the climatology and to
detect the events that pass what is normal also. For the climatology of the precipitations, AURELHY
(Analysis Using the Relief for the Hydro meteorology) is one of the applied methods that consist in
analyzing the meteorological field while taking automatically into account the influence of the relief, it
has been presented by P.Bénichou and The Bréton in 1993. Modelling of the drift of the topography
and interpolation of the mistake by kriging is the philosophy of this method. With regard to the
detection of the extreme events, SPI (Standardized Precipitation Index) presented by Mc Kee and all in
1986 is the applied method especially of it. Besides, the SPI method is hardly bound to the gamma
distribution because the data of precipitations are not normally distributed as the Gaussian distribution.

Key words: orography - AUREHLY - Analysis of the Main Component - interpolation - kriging -
Standardized Precipitation Index

 1 - Introduction

       Madagascar is an island situated in the zone of the West South of the Indian Ocean, separated of
the continent African by the channel of Mozambique. On a tabular scale, the tropical climate reigns in
this island with one dry season during the southern winter and one season of rain during the southern
summer.
       Madagascar possesses a varied relief; in a general way the East part is dominated by a chain of
mountain and the west part by a sloping relief. Of this fact, Madagascar is not plain therefore the
orography has an importance on the rain regional climatology. This model of orography forces the
wind coming from the East to rise up and that often leads some precipitations (rainfall).
       In this study, we will use the data of the monthly cumulative precipitations recorded on 59
stations of Madagascar.
       The goal of this survey is to find the extreme phenomena climatology. For it, we use the map of
Madagascar rainfall climatology with the help of the analysis using the relief for the survey of the
hydro Meteorology (AURELHY), after having retorted Madagascar in 7 regions climatologic. The
extreme phenomena climatology themselves will be analyzed by" Standardized precipitation index"
(SPI).

2. METHODS.
2.1 ANALYZE USING THE RELIEF FOR THE SURVEY OF
    THE HYDRO METEOROLOGY (AURELHY)
         This method, conceived to the Subdivision of Hydro Meteorology of the Direction of the
National Meteorology, permits to code, under vector shape, the surrounding landscape each of the
station meteorological. Thus, this landscape being defined like a scalar, it can be associated to the data
of rainfall: the precipitations determined in each of the sites are valued according to the parameters of
the relief (dominant winds, relief).
The principle consists in writing the quantity of precipitation in two parts:

                                                    1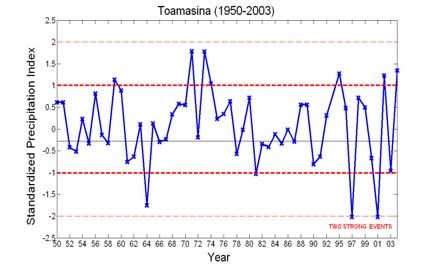
Y(P) = Y(x, y, T) =f(T) +εε(x ,y )

 Y(P) precipitation in the P point
 f(T) equation of regression of the rainfall bound to the relief
 T landscape vector
  ε (x, y) interpolation of the residues, rainfall not depending of the relief,

       The topography intervening in a linear way, the krigeage will only apply on the part which is
not explained by the relief (that is to say on the residues of the regression).
To be able to establish a relation between the relief and the quantities of the rainfall, it is necessary for
us to determine the landscape surrounding a point of site numerically (NMT).
      To determine the vector T, the AURELHY method considers that the landscape surrounding a
point M is a square matrix 11*11 of middle altitude. Indeed, the ray of influence of the relief on the
rainfall data being fixed to 25 kilometres. The 121 altitudes neighbouring of our point are important
being specified that the stitch chosen for this survey is of 5 km.
      These quantitative values presenting multiple relations between them, it is necessary for us to
summarize information brought by these scalar by destroying it least possible. This operation is
achieved by an analysis in main components (A.C.P).
      The MNT field is to stitch 5kmx5km, so the landscape is arranged in a square grid formed of
11altitudes X 11altitudes =121 altitudes of a landscape.

                                                                                        121 Altitudes
   The point of the station                                                            (Points of MNT )
   p

          5 Km

         Altitude

Reconstruction of the landscape
        After having made all calculations (ACP, krigeage, clean vectors, clean values…), the
software AURELHY rebuilds the landscape according to the following diagram:

                                                               x 1 c        +
                                                                                                      x   c2
                                  =
                                                                    c
                                                                   x 3                                 c
                                                                                                      x 4
           F (T)

                                                               x   c5        +
                                                                                                      x   c6
                                                                                               +…

                                                      2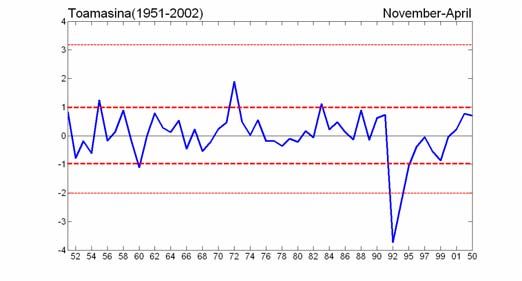
The numeric field of the first member is equal to the average of the fields used for the ACP
added of the other shapes typical topographies of landscape multiplied by coefficients, named
predictors. These different typical shapes represent the clean vectors of matrix of ACP.
C1, C2, C3, C4,…are the predictors descended of an ACP calculated on the biggest oblong zone not
including the maritime domain
2.2 STANDARDIZED PRECIPITATION INDEX (SPI)
- Presented by Mc Kee and all as method to measure the severity of the drought or the one of rain for a
particular station.
- it is noted that some data have not normally been distributed but they are rather adapted to the
gamma distribution to extract the probability of the precipitation.
- SPI tried to normalize values of precipitation in order to try to calculate the Z-Score for a normal
distribution, Z-Score = (x-µ)/δ. In this x expression is the average of precipitation accumulated in one
point and µ the average precipitation accumulated of the survey zone. δ the variance
In the software SPI, one notes:
SPI-1: monthly precipitations
SPI-2: Bimonthly precipitations
…………………………………
SPI-12: Yearly precipitations etc.........
We must have the longest possible chronological set in order to have a statistical sense in the
analysis. Granting the literature, we need at least of 50 years of monthly data.
Therefore, the gamma distribution is hardly bound in the SPI that is defined by:
For x> 0,
1 α −1 − x / β [1]
g ( x) = α x e
β Γ(α )
According to [1], g(x) has two parameters to define the curve
1 4A
α= 1 + 1 + [1.1] β = x [1.2]
4 A 3 α
the shape of the curve the scale of the curve
A is an intermediate stage in the calculation of the α parameter.
ln( x)
A = ln( x) − [1.3]
n
with x the quantity of monthly precipitation
n: numbers of precipitation observations.
The objective of this next stage of calculation is to have g(x) gamma of distribution similar to the
distribution Gaussian by the probability accumulated data by:
x x
1 [1.4]
G( x) = ∫ g ( x)dx = αˆ ∫
ˆ
xαˆ −1e− x / β dx
βˆ Γ(αˆ )
0 0
However, the values of zeros can contain in the distribution of precipitation that made the gamma
function not definite, otherwise x=0.
In this case, the accumulated probability becomes:
3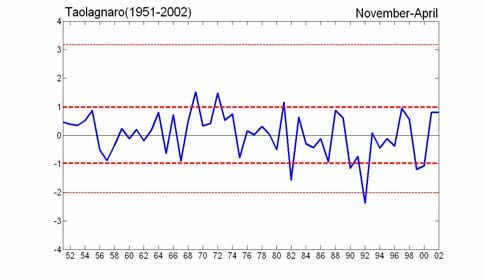
H(x) = q + (1-q) G(x) [3] with q = m/n,
  q is the probability of m zero in the number of the hopeless value
  n is the number of precipitation observations
            Now, the Z or the value of SPI is gotten easily by using an approximation provided by
 Abramowitz and Stegun (1965) that is going to convert this probability accumulated to the variable
 uncertain normal standard Z:
 Pour 0 x> 1400mm for the High Plateau region
 250mm> x> 1400mm for the western region.

  The region of the south, the western part is rigorously drier than the east region. The orography effect
 would explain this result in part as the uprising forced of the wind of the South-east upwards by the
 oriental mountain leading some rainfall orography in the east region and would constitute a process of
 drying therefore in the west because the humidity has been deposited in the oriental region.
 The high plateau is also under the influence of the trade wind and the orography effects that are going
 to lead the meaningful influence of the quantitative precipitations in this place. Thus, the high plateau
 contributes to a process of drying the western region in the south zone and in the central.
 By using the regionalization, AURELHY method can rebuild the map of rainfall.

  3-2) Reconstitution of the pluviometric map of Madagascar
         By injecting into the program the accumulated monthly average data, we get the following maps
of rainfall.

                                                                    4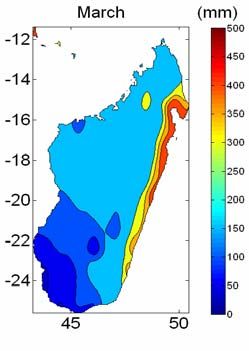
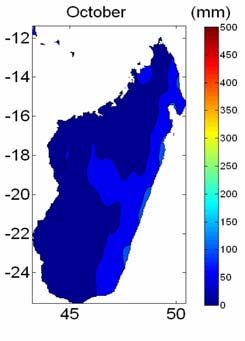
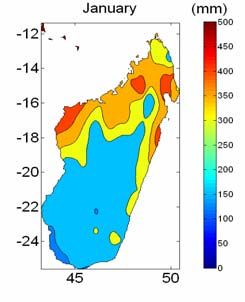
Picture 1: The monthly average of rain in Madagascar since 1950 to 2003

- In the months of November and April, the West part of the island is dry.
- For the months of December and March, we find almost 300 mm to 350 mm of precipitation in the
east part and a drought in the South westerly part.
During the months of January and February, we find a lot of rain (around 300mm to 400mm) in the
east and North parts of Madagascar, because the CITZ present at this moment.
During the six months, of the may till October, the West and the high plateau of Madagascar are
nearly dry. In the coastal east part, we find about 50 mm of precipitation.

                                                 5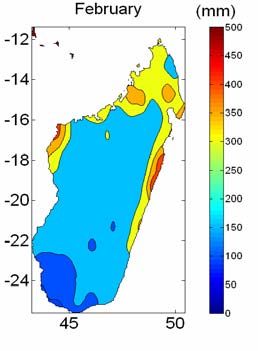
3-3) The phenomena extreme pluviométriques of some regions of Madagascar
we introduce in the software SPI the data coming from the result of the rain cartography. As SPI
represents the Z-Score (normal distribution), it corresponds to the value of the gaps between all
precipitations of the month of January in relation to the average (picture 2a-b) for the stations of
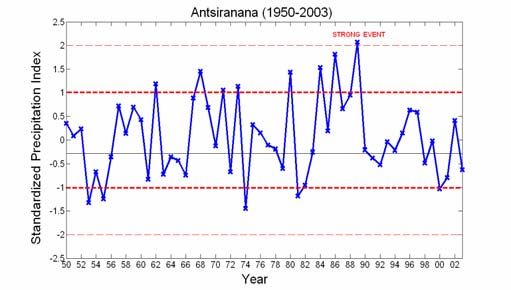
Antsiranana and Toamasina. SPI has a particular significance for the values above +1 or below -1.
Picture 2a : SPI-1 of the mohth January for Antsiranana Picture 2b : SPI- of the month January for Toamasina
Picture 3a : SPI.6 during the april-november Toamasina Picture-3b : SPI.6 during the april-november for Tolagnaro
We can consider like normal events of the precipitation the values of SPI between 1 and -1.
Thus, for
2 < SPI (value) ≤ 3 mean that such a region 0,5< SPI ≤ 1... slightly humid
had known an extremely humid event -0,5 < SPI ≤ 0,5... normal
1,5< SPI ≤ 2. Very humid . -1< SPI ≤0,5... slightly dry
1< SPI ≤ 1,5... humid -1.5< SPI ≤ -1... dry
-2< SPI ≤-1,5... very dry
-3≤ SPI ≤ - 2... extremely dry
Accumulating the monthly precipitations, of 1950 to 2003, it notes, in the month of January:
For the case of Antsiranana [Fig.2a SPI-1] that:
- there was a lot of rain during the years 1968, 1980, 1984, 1986 and 1988,
- there was drought in 1952 ,1955 and 1974
For the case of Toamasina [Fig 2b SPI-1]
- it rained a lot during the years 1970, 1972, 1995 and 2002,
- there was drought in 1964 ,1997 and 2001.
6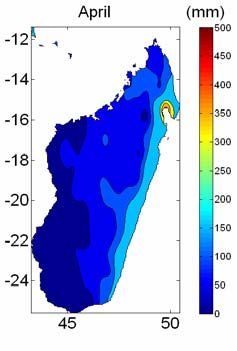
By accumulating the data of six months, of April to November:
-For the case of Toamasina [Fig. 3a SPI-6], during the year 1992, the drought sat there. And it rained
a lot in this region in 1972.
-For the case of Taolagnaro [3b SPI-6], it rained a lot during the years 1968 and 1972. The drought
existed in this region in 1992.

4 - conclusion
 The forçage of the orography takes an important role on the regional climate of Madagascar.
The CITZ and the wind of the South - east are essentially the type of atmospheric circulation which
dominates on the meteorological model of rain in Madagascar.
The classification of precipitation underlines that the drought increases by moving at the same time
southwards and toward the west.
The continuation of this work, by the spectral method, consists in answering the different crucial
questions as:
 How many times the drought or the flooding occur in a given region?
 How was the gravity of the droughts or the floodings?
 How had spilled the droughts or the floodings?
 How long were the lengths of the droughts or the floodings?

5- Bibliographie
BELTRANDO G., CHEMERY L., 1995: Dictionnaire du climat. Ed. Larousse, Paris. 344p.
BERNARD DUCHIRON, 2002 : Variabilité inter annuelle de la pluviométrie dans l’espace riverain de l’Océan Indien
BESSAFI M., AND M.C. WHEELER, 2005: Modulation of south Indian Ocean tropical cyclones by the Madden-Julian
oscillation and convectively-coupled equatorial waves. Mon. Wea. Rev., à paraître.)
CH. BECK, J. GRIESER and BRUNO RUDOLF : 2004 A new Monthly Precipitation Climatology for the Global Land
Areas for the period 1951 to 2000
CH. BECK, J. GRIESER, BRUNO RUDOLF, U.SCHNEIDER: 2005, Global Precipitation Analysis Products of the
GPCC
CHRISTOPHER K. WILKE : Spatio-temporal method in Climatology
DANIEL S. WILKS.: 1995, Statistical Methods in the Atmospheric Sciences
DONCQUE Gérald, 1971 : Contribution géographique à l’étude du climat à Madagascar
DUCHEMIN J.B., 1996 : Biogéographie de Madagascar.
ERICH J. PLATE : 1982, Engineering meteorology
GERALD DONQUE : 1975, Contribution géographique à l’étude du climat de Madagascar
JACKSON I.J.,1989: Climate, Water and Agriculture in The Tropics. Longman.London. 328p.
JEANNE I. RANDREMANANA R., ROBERT V., ARIEY F., TOMBO M.L., WILMÉ L.,RANIVOARISOA S.&
VON STORCH H., ZWIERS F.Z., 1999: Statistical Analysis in Climate Research Cambridge University Press, UK,
JONATHON SHLENS : A Tutorial on Principal Component Analysis
PASCAL BARBIER, 2003 : Cours de Map Info V7.1- livret1
P.QUENEY : 1974, Elément de météorologie
MARK R JURY and S ELVIS NKOSI: 2000, Easterly flow in the tropical Indian Ocean and climate variability over
south-east Africa
MC GREGOR G.R.ET NIEUWOLT S., 1998 : Tropical Climatology. John Wiley & Sons eds,Chisester (UK).339p.
MCKEE, T.B., N.J. DOESKEN AND J. KLEIST, 1993. The Relationship of Drought Frequency and Duration to Time
Scales. 8th Conference of Applied Climatology. 179-184 MCKEE, T.B., N.J. DOESKEN AND J. KLEIST, 1994.
Drought Monitoring with Multiple Time Scales. 9th Conference on Applied Climatology. 233-236.
MR JURY and EJ MPETA : 2005, The annual cycle of African climate and its variability
N.FACHEREAU,S.TRZASKA,M.ROUAULT and Y.RICHARD: 2002, Rainfall variability and changes in southern
Africa during the 20th Century in the Global Warming context
OEZTUERK, A, 1981. On the Study of a Probability Distribution for Precipitation Totals. Journal of Applied
Meteorology. 20:1499-1505.
484p.
SAIDI MOHAMED ELMEHDI : Cours d’Hydrologie et de Climatologie, Faculté des Sciences et Techniques
MARRAKECH.
YVES GRATTON : Le krigeage, la méthode optimale d’interpolation spatiale.

                                                      7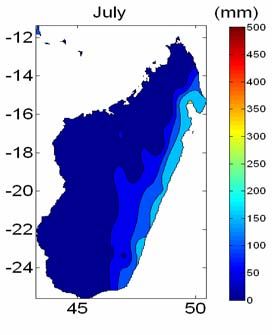
You can also read