Preliminary Prediction of Rice Planting for Planting Season 2019, 2020, and 2021, Based Water Balance in Freshwater Swampland
←
→
Page content transcription
If your browser does not render page correctly, please read the page content below
BIO Web of Conferences 20, 01004 (2020) https://doi.org/10.1051/bioconf/20202001004
ICWEB 2019
Preliminary Prediction of Rice Planting for Planting Season
2019, 2020, and 2021, Based Water Balance in Freshwater
Swampland
Vika Mayasari1* and Anna Hairani1
1
Indonesian Swampland Agricultural Research Institute (ISARI), Banjarbaru, Kalimantan Selatan
Abstract. Climate change that has occurred in recent years causes a shift at the beginning of rice
planting. Rice crop failure due to flooding or drought is the main cause of the low Cropping Index in
the freshwater swampland such as happened in Swampland Agro Science Park of Banjarbaru.
Therefore, this study was carried out to determine the preliminary prediction of the rice planting season
for planting season (M T) 2019, 2020, and 2021 based on water balance. As for what can be analyzed
was the rainfall data as input compared to evapotranspiration through the Hargreaves approach. Then
the output obtained in the form of net rate which used to measure the amount of rain every year.
M eanwhile, the water requirement for rice was calculated during the period of growth to harvest. After
that, the water balance simulation was performed from the difference in water bubbles (net yield rate)
with the water needs in the rice field. Based on this water balance simulation obtained that the
beginning of rice planting for M T 2019 is M ay IV-June IV, M T 2020 is June I-July I, and M T 2021 is
June II-July II.
1 Introduction of Banjarbaru (TSPLR) due to a mistaking in starting
planting time. Therefore, predicting the beginning of
There are three growing seasons (MT) in Indonesia, rice planting in TSPLR for MT 2019, 2020, and 2021
namely: (a) MT-I or rainy season (MH), November to subject to climate anomalies needs to be studied.
February; (b) MT-II or first dry season (MK-I), also
called Gadu season, March to June; and (c) MT III or 2 Materials and Methods
second dry season (MK-II), July to October. However,
due climatic anomalies such as the drought period (El 2.1 Research sites and time
Nino year) and /or wetness (La Nina year), it causes a
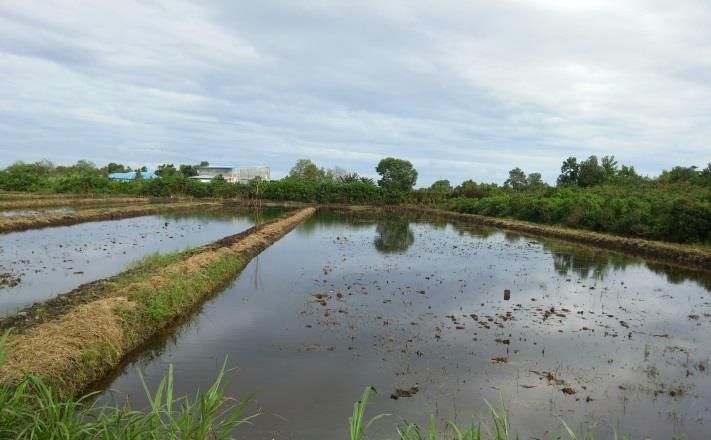
shift in the beginning and the end of the growing The research was located in 5 ha of freshwater
season so that it has negative impacts on crop swampland at Swampland Agro Science Park of
productivity, especially rice [1]. Banjarbaru at 3°26'9.38 "latitude and 114 ° 47'47.66"
South Kalimantan has a flat topography but still east longitude (Fig. 1). The study was conducted for 12
has mountainous areas, valleys, which lie between the months from January to April 2019. The observation is
Java Sea and the Makassar Strait, resulting in the being in progress until for the next two years.
emergence of complex climatic conditions. This causes
a shift at the beginning of the growing season, 2.2 Data collection
especially for rice [2].
According to the most recent data [3], it is Hydroclimatological data such as rainfall, temperature,
estimated that the total area of swampland in Indonesia and humidity were obtained from Syamsuddin Noor
is 34,93 million ha consisting of peatlands and mineral Banjarmasin Meteorological Station. Rainfall data was
lands. From those areas, about 10.87 million ha further processed into an analysis of daily rainfall
consisting of 2.34 million ha freshwater swampland fluctuations over the past 30 years. Meanwhile, data of
and 8.54 million ha tidal swampland is suitable for maximum and minimum temperature, average
agriculture. Freshwater swampland consists of three temperature, and average relative humidity were used
typologies, i.e. shallow freshwater swampland (water for the calculation of evapotranspiration.
depth 100 cm) with inundation time at least
three months. Freshwater swampland has an average Evapotranspiration was calculated using the
planting index of 100 or can only be planted once with Hargreaves method. The ET0 value was calculated
moderate soil fertility since nutrient supply from based on air temperature data measured continuously
overflowing rivers [4]. This indicates the big potential by temperature and humidity sensors at the study site.
of the freshwater swampland to be developed as barn The formulation [5] is as follows:
food by adjusting the appropriate time of planting.
Failure of planting to harvest failure is the main
problem that occurs in Swampland Agro Science Park
Corresponding author : vikamaya.balittra@gmail.com
© The Authors, published by EDP Sciences. This is an open access article distributed under the terms of the Creative Commons Attribution
License 4.0 (http://creativecommons.org/licenses/by/4.0/).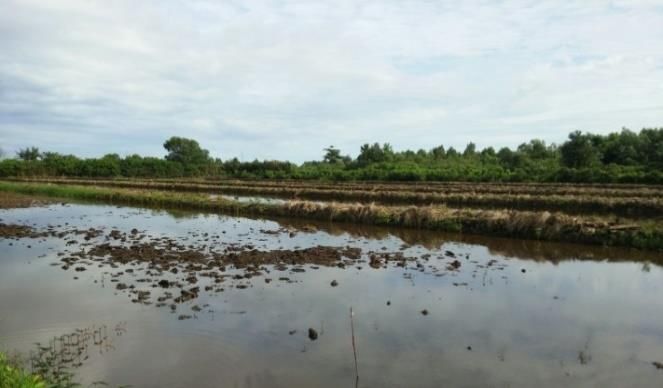
BIO Web of Conferences 20, 01004 (2020)                                                 https://doi.org/10.1051/bioconf/20202001004
ICWEB 2019

   ET 0 = 0.000938Ra (T max-T min) 0.5 (T Average +17.8)    (1)             For rice production, the calculation of irrigation
             R0: Extraterrestrial radiation (M J m-2h-1)              water during land preparation is based on the water
             T max: M aximum daily temperature (ºC)                   necessary to replace water losses due to evaporation
             T min: M inimum daily temperature (ºC)
                                                                      and percolation in paddy fields. The fields should be
             T average : Average daily temperature (ºC)
                                                                      saturated during the land preparation for 30 days, with
                                                                      a water level of 250 mm or 8.33 mm/day. The van de
                                                                    Goor and Zijlstra formulation [6] was used to
                                                                      determine the amount of water needed.

                                                                      IR: M .ek/(ek-1)                                        (2)
                                                                          IR = water requirement in the paddy field (mm/day).
                                                                          M = 1.1ETo + P (mm/day), is the peak water
                                                                                    requirement.
                                                                          ETo = evaporation (mm/day).
                                                                          P = percolation (mm/day).
                                                                          k = M .T/S
                                                                          T = time for land preparation (days).
                                                                          S = water needs for fulfillment.

                                                                            The percolation rate depends on the
                                                                      characteristics of the soil, namely the type of soil and
                                                                      its processing characteristics. Water percolation was
                                                                      provided during the growth of plants to clear the
                                                                      subsurface soil layer. The amount of percolation water
                                                                      ranges from 1 to 3 mm/day. In this study, percolation
                                                                      was determined at 2 mm/day. Water layer replacement
                                                                      was scheduled for 2 times as 50 mm of each, which is
                                                                      one and two months after transplantation [6].
                                                                            Next, the consumption of consumptive water was
                                                                      calculated by multiplying the coefficient of rice plants
                                                                      by evapotranspiration. Then the water substitute layer
       Figure1. Research site at Swampland Agro Science Park of       (WLR) and the land preparation needs were calculated.
                        Banjarbaru (A) and (B)                        The total amount of it was the value of plant water
                                                                      needs. Since planting in a different time, water needs
                                                                      are also different. The channel maintenance was
   2.4 Water Balance (Net Rate)
                                                                      calculated as 5% of the highest rainfall data.
                                                                            Determination of the beginning of the growing
   The water balance is based on the law of conservation
                                                                      season needs to consider the amount of rainfall needed
   of mass, where any change in groundwater content for
                                                                      for soil tillage and the initial phase of growth. The
   a range of time must be the same as the difference
                                                                      highest amount of water needed in one planting period
   between the amount of water added to the soil and the
                                                                      is for soil tillage. Soil tillage takes 15-20 days with
   amount of water coming out of the soil. The remaining
                                                                      water requirements of 150-250 mm [7].
   water is usually called the net rate.

   ∆θ: Changes in volumetric soil water content (cm3cm-3);            2.6 Estimation of water balance in the field for
   ∆h: Changes in water depth equivalent (mm);                             MT 2019, 2020 and 2021
   ∆t: Time interval (h).
   Z: Depth of plant rhizosphere (mm);                                Estimation of water balance was calculated based on
   r: Rain intensity, rainfall (mm h-1),                              the percent of water loss (80% for dry years, 50% for
   et: Evapotranspiration rate, evapotranspiration (mm h -1),         normal years, and 20% for wet years) multiplied by the
   ro: runoff rate, run-off (mm h-1),                                 number of years then added with 1 [6].
   GW: Capillarity rate of groundwater, groundwater (mm h-1),
   dp: Percolation rate, deep percolation (mm h-1),
   qi: Irrigation rate, irrigation (mm h-1);                          2.7 Determination of initial planting time
   QD: Drainage rate, drainage (mm h-1).
                                                                      Planting time was determined from the results of the
   2.5 Determination of water requirements for                        water balance simulation with the beginning of the
       swampland rice                                                 initial planting time which comply with the global
                                                                      planting plan in MT 2018. Then the results of the
   Water requirements for swampland rice are determined               simulation were compared to the results of net rate
   at three growth phases; early vegetative, reproductive,            estimation for MT 2018 to find out whether MT 2018
   and ripening. Calculated by entering data on the                   was a dry, normal, or wet year. The verified planting
   coefficient of rice plants at the time of planting.                time of 2018 was used as a benchmark for simulating


                                                                  2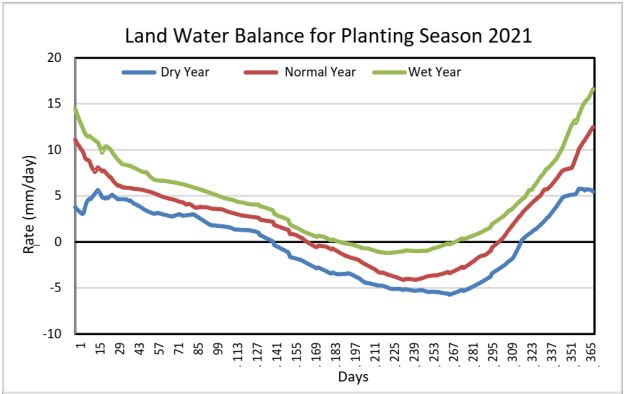
BIO Web of Conferences 20, 01004 (2020)                                               https://doi.org/10.1051/bioconf/20202001004
ICWEB 2019

  shift at the beginning of the planting season for MT             preparation, based on the Directorate General of Water
  2019, 2020, and 2021. In another word, the planting              Resources [10] in irrigated areas is taken at 250 mm if
  time was simulated according to fluctuations in the              the land has been left fallow for a period of fewer than
  early dry season shift resulted from the analysis of the         2.5 months.
  MT 2018 water balance.
                                                                    Table 1. Prediction of rice crop water needs for M T 2019.
  3 Results and Discussion
  3.1 Net water balance rate for the past 30 years

  Rainfall over the past 30 years shows fluctuations in
  rainwater    runoff      after  being     reduced      by
  evapotranspiration. Information about when the dry
  season occurs and when the wet season can be seen
  clearly. Net rate with positive sign means a wet
  condition, while net rate with negative sign indicates a
  dry condition. Furthermore, this data will be used as a
  discourse for the selection of initial rice planting
  scenarios for the next 3 years (MT 2019-MT 2021) and
  also as a reference for setting the water level in the
  land.
        The availability of groundwater, which is mostly
  derived from rainfall, is an important limiting factor for
  increasing crop production [8]. The analysis shows that
  the pattern of rainy and dry seasons in Banjarbaru City
  during the last 30 years has shifted every year. For the
  dry season, each year experienced a backward shift in
  the range of 1 to 30 days for 3 consecutive years, then
  advanced once in the range of 20 to 30 days, then a
  backward again of 1 to 10 days for 2 consecutive years.
  This can be interpreted as the initial hypothesis that
  shifting backward from 1 to 30 days occurred every
  year in MT 2019-2021.                                             Table 2. Prediction of rice crop water needs for M T 2020.

  3.2 Rice crop water requirements

  In rice cultivation, there are three growth phases. Time
  duration, rice underwent a vegetative phase (beginning
  of healing until the formation of panicle/primordia),
  reproductive (primordia to flowering), and maturation
  (flowering until the grain is ripe) [9].           Water
  requirements in the three phases above vary, namely in
  the phase of active tillers formation, maximum tillers,
  panicle formation, pregnancy phases, and flowering
  phases.
        The results of the calculation of water needs (10-
  day basis or dasarian) to plant rice twice a year showed
  that the highest water demand for 2019 was predicted
  to occur in September in the second week of week III
  at 1,094mm/day (Table 1). In 2020 the highest water
  demand of 1,112 mm/day occurred in October in the
  first week of week II (Table 2). In 2021 the highest
  water demand in the second week of October IV was at
  1,112 mm / day (Table 3).
        The need for water to replace the water layer
  (WLR) is determined according to the Directorate
  General of Water Resources [10]. The amount of water
  needed to replace the water layer was 50 mm/ month
  (or 1.67 mm/day) within a month or two after
  transplantation. The amount of water needed for land


                                                               3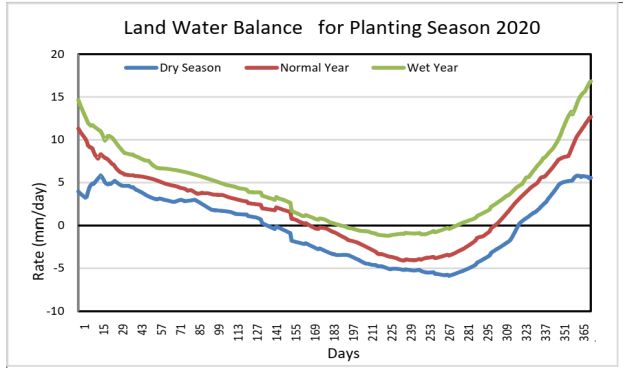
BIO Web of Conferences 20, 01004 (2020)                                                      https://doi.org/10.1051/bioconf/20202001004
ICWEB 2019

       Table 3. Prediction of rice crop water needs for M T 2021.           local wisdom and natural signs such as prey structures
                                                                            are increasingly difficult to recognize and can no
                                                                            longer be used by the community [12].
                                                                                  Estimated net rates for 2019, 2020, and 2021 are
                                                                            categorized as dry years, normal years, and rainy years.
                                                                            Because it is calculated based on 30 years of data, the
                                                                            results can be cross-checked with the calculation of the
                                                                            net rate of 2019 as a reference point. BMKG 2019
                                                                            stated that based on the results of calculations and
                                                                            analysis accompanied by consideration of physical
                                                                            conditions and atmospheric dynamics in the region of
                                                                            Indonesia and its surroundings, the forecast of the 2019
                                                                            drought in Banjarbaru City occurred in May IV-June
                                                                            III with a comparison of the average rainfall for 30
                                                                            years is the same. Besides, the shift in planting time,
                                                                            even though only about 10 days (dasarian), had the
                                                                            potential to reduce yields by up to 40% (Irianto 2000 in
                                                                            Wakhid et al. 2016). Various research results also
                                                                            indicated that the determination of planting time should
                                                                            accommodate the amount and distribution of rain and
                                                                            the requirements of a series of dry days to avoid
                                                                            drought during the planting period. These requirements
                                                                            need to be considered and used in the initial
                                                                            determination of the MT.


   3.3 The initial scenario of rice planting

   This preliminary planting simulation uses a basis
   starting from MT 2019, then continued to MT 2021.
   The estimated net rate was included as a parameter of
   water availability for each year category such as rainy
   year, dry year, normal year, wet year.
         The simulation results show that the most
   appropriate time to initiate rice planting for the 2019
   MT period was May IV-June IV, and for the MT 2020
   in June I-July I. MT 2021 is June II-July II. The timing
   of planting was chosen based on simulation results
   which showed a negative value which means the start
   of the dry season.
         The initial MT determination criteria are the main
   key     to     provide     accurate     planting    time
   recommendations. Plant growth and production are
   dynamic functions, non-linear interactions between
   weather, soil, food transport dynamics, and plant
   physiology per day so that they cannot be estimated
   based only on initial planting conditions where the
   average climate during the growing season [11].
   Related to climate change, several climate change
   indicators that can be observed are rising air
   temperatures, changes in rainfall patterns, rising sea
   levels, and increasing extreme climate events. Also,                            Figure 2. Water balance on M T 2019-2020.


                                                                        4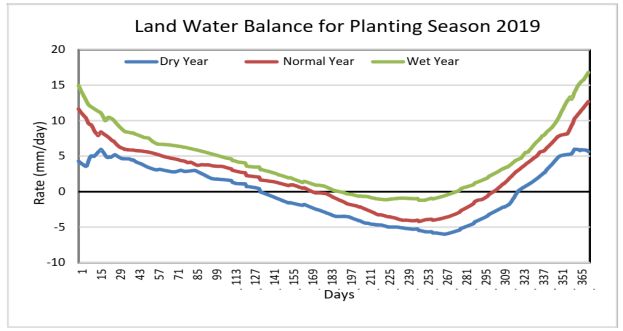
BIO Web of Conferences 20, 01004 (2020)                                            https://doi.org/10.1051/bioconf/20202001004
ICWEB 2019

  4 Conclusion                                                        Jakarta, (2009)
                                                                  10. Direktorat Jenderal Pengairan, Pedoman perkiraan
  Based on the results of the analysis, it can be                     tersedianya air, Badan Penerbit Departemen PU,
  concluded that to predict the start of the swamp rice               Jakarta, (2006)
  season, data components such as rainfall, temperature,          11. E. Surmaini, and H. Syahbuddin, J. Litbang Pert.,
  and relative humidity are needed for 30 years. The year             35, 2, 47-56 (2016)
  2019 is the year of control of the analysis of the              12. A. Pramudia, W. Estiningtyas, E. Susanti, and
  determination of the beginning of planting and the                  Suciantini, in Haryono, M. Sarwani, I. Las, and E.
  results were close to reality, so the components that               Pasandaran (eds.), Kalender Tanam Terpadu, 55-
  exist in the simulation of water balance in the field can           100, IAARD Press, Jakarta, (2013)
  be used to predict the beginning of the planting season
  of the following year. The final results obtained based
  on this water balance simulation that the initial
  estimate of MT 2019 swamp rice planting was May
  IV-June IV, MT 2020 June I-July I, and MT 2021 is
  June II-July II. A pumping schedule is adjusted with
  data on water level results from recording equipment.

  Recommendation
  Measurement of water level in the land is highly
  required as a supporting factor for land water
  management so that the resulting product will be more
  optimal as well as a guideline in the preparation of land
  pumping schedules for drainage and irrigation.

  References
  1. E. Runtunuwu, H. Syahbuddin, and F. J. Agron.
     Indonesia 40 (1) : 8 – 14, (2012)
  2. Stasiun Klimatologi Kelas I Banjarbaru, Bull.
     Prakiraan Musim Kemarau Di Kalimantan Selatan
     Tahun 2018, BMKG, Banjarbaru, (2018)
  3. S. Ritung, E. Suryani, D. Subardja, Sukarman, K.
     Nugroho, Suparto, Hikmatullah, A. Mulyani,
     C.Tafakresnanto, Y. Sulaeman, R. E. Subandiono,
     Wahyunto, Ponidi, N. Prasodjo, U. Suryana, H.
     Hidayat, A. Priyono, and W. Supriatna, Sumber
     Daya      Lahan     Pertanian     Indonesia Luas,
     Penyebaran, Dan Potensi Ketersediaan, IAARD
     PRESS, Jakarta, (2015)
  4. M. Syakir and Dedi Nursyamsi., Kebijakan
     Pemerintah Dalam Pengembangan Lahan Sub
     Optimal Secara Produktif, Inklusif, dan Ekologis,
     in Prosiding Seminar Nasional Lahan Suboptimal
     Tahun 2015, PUR-PLSO,UNSRI, 8 – 9 October
     2015, Palembang, Indonesia, (2015)
  5. G. H. Hargreaves, and Z. A. Samani, J. Irrig. Drain.
     Eng., 108, 225–230, (1982)
  6. Direktorat Irigasi dan Rawa, Standar Perencanaan
     Irigasi, Kriteria Perencanaan Bagian Perencanaan
     Jaringan Irigasi KP-01, Dirjen Sumber Daya Air,
     Kementerian PU, Jakarta, (2013)
  7. Yoshida, Shouichi. Fundamental of Rice Crop
     Science. The International Rice Research Institute,
     Los Banos, the Philippine, (1981)
  8. J.A.I. Paski, G.I.S.L. Faski, M.F. Handoyo, and
     D.A.S. Pertiwi, J. Ilmu Lingk., 15, 2, 83-89, (2017)
  9. A.K. Makarim, dan E. Suhartatik. In. Publikasi
     Balai Besar Penelitian Tanaman Padi, 295-330,
     Badan Penelitian dan Pengembangan Pertanian,


                                                              5
You can also read