Meter Audits in the Industrial Areas of the City of Tshwane
←
→
Page content transcription
If your browser does not render page correctly, please read the page content below
Meter Audits in the Industrial Areas of the City of Tshwane
F Sheriff *, T Westman **, N Meyer ***
* City of Tshwane, PO Box 1022, Pretoria, South Africa, 0001, e-mail: fazels@tshwane.gov.za
** City of Tshwane, PO Box 1022, Pretoria, South Africa, 0001, e-mail: trevorw@tshwane.gov.za
*** WRP Engineers, PO Box 1522, Brooklyn Square, 0075, e-mail: nielm@wrp.co.za

Keywords: Management Information System; Industrial consumer meter audits; Increased revenue.

Abstract
The City of Tshwane has undertaken various initiatives over the past 10 years to
quantify and reduce its non-revenue water. The City of Tshwane has an advanced
Management Information System in place which is used for, amongst other things, to
identify areas with high non-revenue water levels, graphically display the demand per
stand and to graphically display where un-metered stands are located. Through
assessment of the outputs available in the management information system it
became apparent that there were unmetered or unbilled stands in some of the
industrial areas. It is crucial that all industrial consumers are metered properly
because these consumers contribute to approximately 30% of the total water
consumption of Tshwane even though they represent only 3% of the total number of
consumers. This implies that if a relatively small number of industrial or commercial
consumers are not correctly metered and billed, the impact can be severe on the
water sales and non-revenue water of the municipality.
  It was recognised that detailed field inspections were required to investigate the
metering and billing anomalies pointed out by the management information system in
industrial areas. In this regard, the City of Tshwane initiated a series of meter audit
exercises in industrial areas to locate un-metered connections and to determine any
anomalies with the metering and billing. Key issues, which were identified through
the field inspections, included unmetered connections, broken meters and meters
which do not appear on the billing system. What appears on paper to be a relatively
simple process was in fact very complicated and time-consuming. The water supplies
to each property were shut down completely to ensure that all unmetered
connections could be identified. This included many large car manufacturers
including BMW, Nissan and Ford who each produce thousands of vehicles each
week and so great care had to be taken to minimise any problems to the customer.
   Of the 1423 connections audited, 97 un-metered connections and 142
broken/malfunctioning meters were identified. The municipality installed new meters
as a matter of priority and the water sales figures before and after the intervention
were collected and compared. From the results for three of the five areas (which are
already available), it is clear that the exercise has been a great success. The
increase in metered consumption for three of the five areas was 180 000kl/yr which
will result in an additional income of approximately R1.4million/yr (about
$140 000/yr). Based on these initial results, it has been agreed to repeat the exercise
throughout all industrial/commercial areas in the city.
  This paper clearly highlights the importance of effective metering and billing in
areas with large water users. It also illustrates the potential increase in metered
consumption that municipalities may achieve through similar exercises.
Introduction
The importance of water conservation has been highlighted through various studies
throughout South Africa. The rapidly increasing water demands cannot be sustained
indefinitely and many parts of South Africa are already in a situation of severe and
permanent water stress. Other areas face the prospect of prolonged and more
frequent periods of water shortage as the demand for water outstrips the available
resources. Water conservation is therefore becoming a major issue and government
is requesting water utilities to actively implement programmes aimed at reducing
water demand and non-revenue water.
The City of Tshwane is one of the largest municipalities in South Africa and covers
an area of 2 200km2 supporting a population of approximately 2.3 million people. The
area is located in the industrial heartland of South Africa and includes the capital city
of Pretoria and several other former municipalities which have all been incorporated
into what is now known as the City of Tshwane. An average of 750 Ml/day (± 270
million m3/yr) of potable water is supplied to the area which is distributed to
approximately 370 000 consumer meters via a network of 9 700km of mains.
  The City of Tshwane has developed a water demand management (WDM) strategy
that incorporates a full spectrum of initiatives aimed at reducing water demand and
non-revenue water. These initiatives include, but are not limited to, the timeous and
effective repair of all reported leaks, active leakage control, implementation of a
management information system, upgrading of worn out reticulation networks, meter
audits to detect metering and billing anomalies, replacement of old consumer meters,
implementing selected pressure management and adapting water tariffs every year
to control excessive demand.
  A number of the WDM initiatives, identified through the strategy, have been
successfully implemented over the past few years and the impact on the overall
water demand and the non-revenue water as a result of these actions are shown in
Figure 1.

                                                        250    354 000                360 000                     365 000       370 000         10
                                                               Connections            Connections                 Connections   Connections
                                                                                                                                                     Total Length of Mains in a specific year (thousand km)
                                                                                                                                                9
   Water Sales / Non-Revenue Water (million m /annum)

                                                        225                                         Length of
                                                                                                    water mains
                                                                                                                                                8
  3

                                                        200
                                                                                                                  201
                                                                                                                                 195            7
                                                                                       190
                                                        175
                                                                                                                                                6
                                                                 175

                                                        150                                                                                     5
                                                              Water Sales

                                                                                                                                                4
                                                        125

                                                                                                                                                3
                                                        100
                                                                                                                                                2
                                                                            88
                                                         75
                                                                        Non-revenue
                                                                                               75                          77                   1
                                                                        Water                                                              73

                                                         50                                                                                     0
                                                                    2005                  2006                       2007           2008

Figure 1: Graphical summary of water demand for the City of Tshwane over the last three years.
The results shown in Figure 1 indicate that the overall water demand and the non-
revenue water reduced over the last few years, even though the number of
consumers and length of water mains increased over the same period. This was
achieved through implementing a range of WDM interventions and carrying out
maintenance activities, which included repairing approximately 29 000 reported leaks
per year and replacing approximately 26 000 old / faulty consumer meters every
year.
   This paper will focus on one of the initiatives included in the WDM strategy of
Tshwane, namely the undertaking of meter audits specifically in industrial areas with
large water consumers. The paper will also illustrate how the management
information system was initially used to identify billing and metering anomalies in
these areas.

Management Information System
One of the tools available in Tshwane to monitor water demand is an advanced
management information system, which is used for, amongst other things, to:
  -   identify district metered areas (DMA’s) with high non-revenue water levels;
  -   graphically display the demand per stand to determine extreme high or low
      demands and to;
  -   graphically indicate which stands are metered to determine where un-metered
      stands are located. See Figure 2 to Figure 4 for different examples of some of
      the available outputs from the management information system.

Figure 2: Screen from Management Information System of the City of Tshwane showing the DMA’s with
a colour coding which is based on the non-revenue water levels.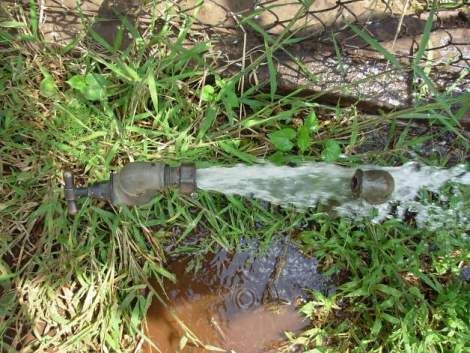
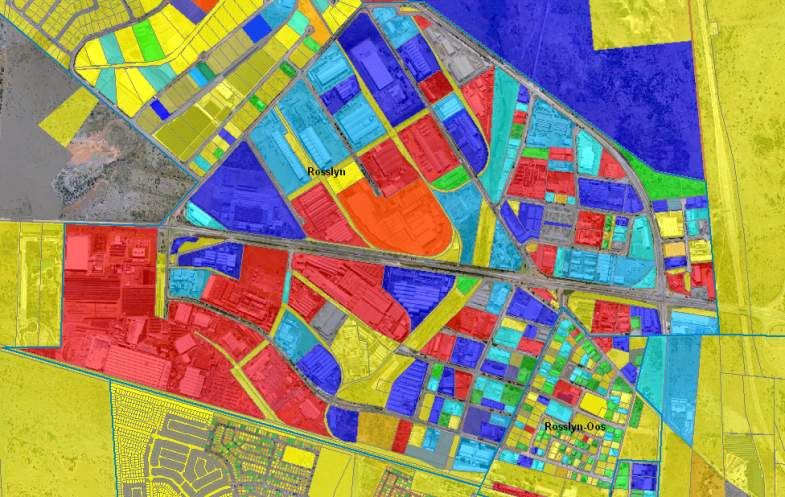
Figure 3: Screen from Management Information System of the City of Tshwane showing the Average
Annual Daily Demand (AADD) for the different stands in an industrial area.

Figure 4: Screen from Management Information System of the City of Tshwane showing the metered
stands in blue and the un-metered or unbilled stands in purple for the same industrial area shown in
Figure 3.

  Through assessment of the outputs available in the management information
system it became apparent that there were unmetered or unbilled stands in some of
the industrial areas (see Figure 4). It is crucial that all industrial consumers are
metered properly because these consumers contribute to approximately 30% of the
total water consumption of Tshwane even though they represent only 3% of the total
number of consumers. This implies that if a relatively small number of industrial or
commercial consumers are not correctly metered and billed, the impact can be
severe on the water sales and non-revenue water of the municipality.

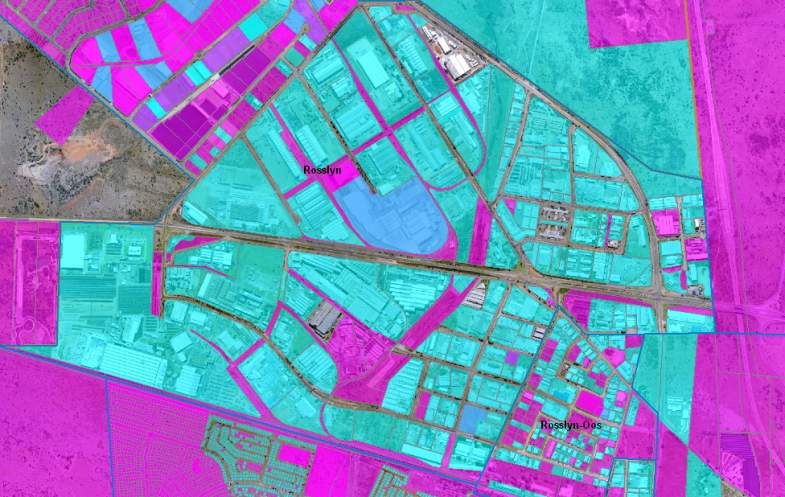
It was recognised that detailed field inspections were required to investigate the
metering and billing anomalies pointed out by the management information system in
industrial areas. In this regard, the City of Tshwane initiated a series of meter audit
exercises in industrial areas to locate un-metered connections and to determine any
anomalies with the metering and billing.

Meter Audits
The five largest industrial areas in Tshwane were identified for meter audits in an
effort to ensure that all consumers in these areas are correctly metered and billed.
The different steps of the audits are described below.

Field Investigation of existing metered connections and un-metered
connections
Field inspections were carried out which included the identification and capturing of
all relevant meter information, meter readings, problems observed with the meter
installations and consumer details (see Figure 5). The typical problems identified
during the field investigations included illegible meters, buried isolating valves which
had to be exposed, broken meters, stolen meters, incorrect meter installations, un-
metered connections and erratic meters. A standard form was prepared for the
capturing of all the information. Where possible a copy of every consumer’s water bill
was requested and attached to the capturing form for the verification of meter and
account details.

Figure 5: Example of a field technician completing a form during a meter audit exercise undertaken in
the industrial areas of the City of Tshwane.
Water Supply Tests
As part of the meter audit, a water supply test was carried out for every consumer to
detect if there were any un-metered connections. These tests were carried out as
follows:
- The consumers were informed of the water test in a letter distributed before
the commencement of the audit;
- Each consumer was contacted for the arrangement of an agreed date and
time for the test;
- The supply test was carried out by the investigation team. All known
metered connections to the stand were temporarily shut-off by the audit
team;
- Water usage points such as tank inlets, hydrants and taps within the stand
were monitored / opened to verify that there were no un-metered
connections (flow and pressure reduced to zero);
- All un-metered connections identified during the course of the water supply
test were recorded together with details of the supply points (hydrants and
taps) receiving un-metered water.
A number of water supply tests were carried out for large industrial consumers.
These included large car manufacturers (BMW, Nissan, and Ford), breweries (SAB-
Miller) and food manufacturing factories (Premier Foods, Sunbake). For these
industries arrangements for the tests had to be made well in advance due to the
impact on production and of the fire risks associated with temporary shutting down
the water supply. The Fire Department provided the necessary backup where the
fire risk was considered serious.
Meter Installations and Replacements
Based on the outcome of the meter audits the municipality undertook the necessary
meter installations, as summarised as follow:
- The first priority was to install meters for connections where meters had
been stolen or unlawfully removed. (see Figure 6)
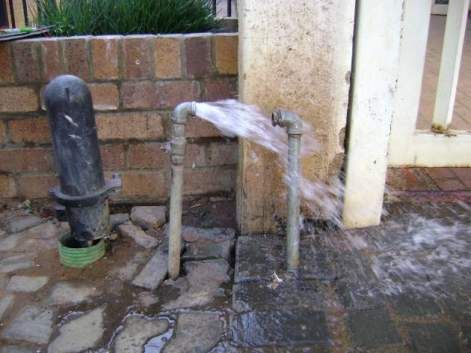
- Meters were installed on all un-metered connections (see Figure 7). Many
of the older stands had un-metered fire connections, and in some instances
these pipes had been connected to the normal reticulation of the stand;
- Meters that were illegible, broken or severely erratic were replaced. A
summary of the meter installations and repairs per area are summarised
below.
- At a few stands water leaks were identified upstream of the consumer
meters. These leaks were repaired during the meter replacement exercise.
- Meters which were located inside stands were moved out to the roadside in
an effort to simplify the reading of the meters by the municipal meter
readers.
A summary of the meter installations in the industrial areas are summarised in
Table 1.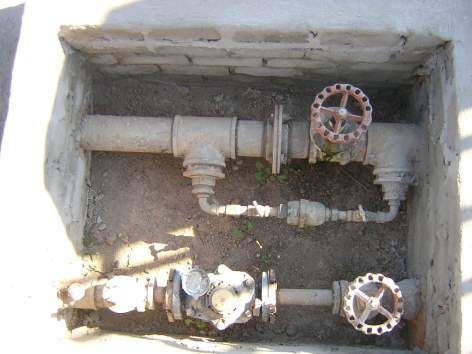
Table 1: Summary of Meter Installations in Industrial Areas.
Industrial /          Number of     Un-metered        Replace meter (Illegible, broken,     Repair Leak
Commercial Area       Connections   connections       stolen or erratic)                    at meter
                      audited
                                                      Main Meter        Sub-meter of
                                                                        combination meter

Rosslyn North         138           7                 28                11                  4

Rosslyn South         236           3                 6                 6                   4

Pretoria Industrial   144           7                 1                 19                  4

Pretoria West Light   355           52                9                 24                  5
Industrial

Waltloo &             550           28                54                18                  8
Silvertonadale
Total                 1423          97                64                78                  37

Figure 6: Photos of connections where meters had been stolen or unlawfully removed.

              Un-metered
              Connection

                                                               Un-metered
                                                               Fire
                                                               Connection

Figure 7: Photos of un-metered Fire Connections identified during the meter audits.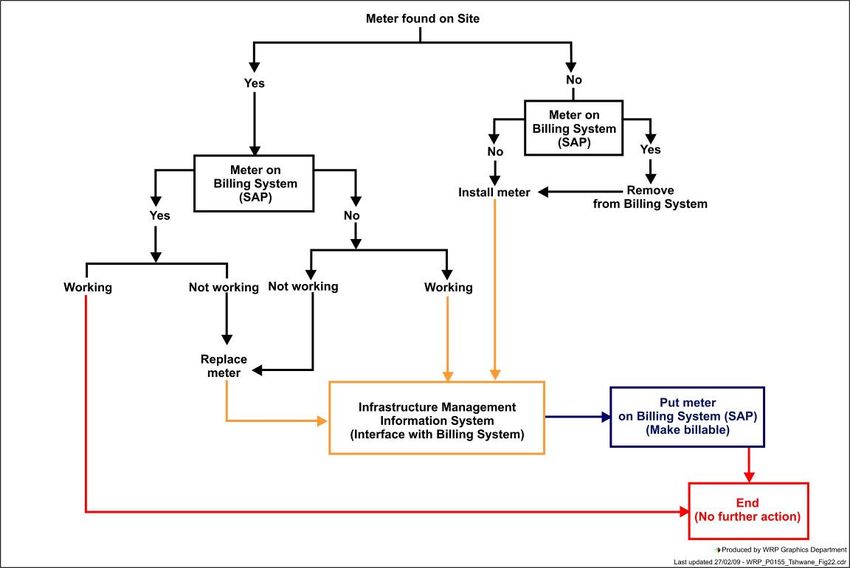
Updating of billing system
The City of Tshwane billing system had to be updated to ensure that it reflected all
the existing meters identified during the audit as well as all the new meters which
were installed. This process to update the billing system was summarised in a flow
diagram to ensure that all the different scenarios would result in the billing of all
active connections. (Figure 8)
   An Infrastructure Management Information System (IBIS) manages the installation
and management of all water meters in the city. Any updated information on meters
is interfaced on a daily basis from IBIS to the SAP billing system to ensure that all
new or replaced meters will be read and billed. Meters, which previously existed on
site but did not appear on the billing system, had to be placed manually onto the
billing system.

Figure 8: A flow diagram that summarises the process of updating the billing system to ensure that it
reflected all the existing meters as well as all new meter installations

Results
Of the 1423 connections audited, 97 un-metered connections and 142
broken/malfunctioning meters were identified. The municipality installed new meters
as a matter of priority and the water sales figures before and after the intervention
were collected and compared. The results for three of the five areas are summarised
in Table 2 (the results for the remaining two areas are expected by March 2009).
Table 2: Summary of Results.
Industrial/            No. of           Increase in          Cost of              Increase in        Return on
Commercial Area        Connections      Consumption          Interventions (R)    Revenue            Investment
                       audited          (kl/yr)
                                                                                  (R/yr)

Rosslyn North          138              60 000 kl/yr         R338 541             R438 000           10 months

Rosslyn South          236              36 000 kl/yr         R438 238             R278 000           1 Yr, 6 Months

Pretoria Industrial    144              87 600 kl/yr         R455 897             R678 000           8 Months
Total                  518              183 600 kl/yr        R1 232 676           R1 394 000

   From the results for three of the five areas (which are currently available) it is clear
that the meter audit and subsequent meter installation exercise has been a great
success. The increase in metered consumption for three of the five areas was
180 000kl/yr which will result in an additional income of approximately R1.4million /yr
(about US$140 000/yr). The additional income was calculated based on the increase
in metered water consumption and on the increase in tariff for industrial effluent
discharge. In the City of Tshwane the effluent discharge tariff is calculated using the
water consumption and, therefore, an increase in water consumption will also result
in additional charges for effluent discharge.

Conclusions
Based on the results presented, the meter audit exercise has been highly successful
showing payback periods of less than two years in some cases payback periods of
less than one year, making it a highly viable intervention. Any payback period of less
than two years are usually considered feasible for water demand management
interventions. The next step for the City of Tshwane will be to extend the meters
audits to all other non-domestic consumers (e.g. flats, hotels, office buildings).
  This paper clearly highlights the importance of undertaking detailed field work in
conjunction with using other systems such as a management information system, to
reduce non-revenue water. It also illustrates the potential increase in metered
consumption that water utilities may achieve through similar exercises.

Acknowledgements
The procedures on meter audits discussed in this paper were mainly developed with the assistance of the following
individuals:
- Mr Darryl Cassel (City of Tshwane)
- Mr Trevor Westman (City of Tshwane)
- Mr Nico Schmulian (City of Tshwane)
- Mr David Moore (WRP Engineers)
- Mr Guy Price (WRP Engineers)

References
BSI (1991) A Guide to the Selection and Application of Flowmeters for flow measurement in closed conduits, BS
     7405, September 1990.

Furness, R.A. (1990), The effect of Installation on the performance of flow meters, Keynote presentation to the
    South African Society of Engineers, Rand Afrikaans University Johannesburg, South Africa, October 1990.

Queensland Environmental Protection Agency & Wide Bay Water (2003) Managing and reducing losses from
    Water Distribution System, Manual 2, Water Audits (EP, Brisbane).

Queensland Environmental Protection Agency & Wide Bay Water (2003) Managing and reducing losses from
    Water Distribution System, Manual 7, Managing Apparent Losses (EP, Brisbane).

Seago, C.J. & McKenzie, R.S. (2006) An assessment of Non Revenue Water in South Africa. South African Water
    Research Commission Report Project: K5/1535.
Westman, T.F. (1997) Water meters: A guide to selection. An internal guideline document developed for the City
of Tshwane employees.
Wegelin, W.A., McKenzie, R.S. & Davidson, D. (2009) The benefits of non-domestic consumer meter audits and
retrofitting – the Ekurhuleni Case Study, Paper presented at the IWA Water Loss Conference in Cape Town.You can also read