PROTOTYPE HILL CHART TESTING OF A SAXO UNIT
←
→
Page content transcription
If your browser does not render page correctly, please read the page content below
_______________________________________________________________________________________________
  IGHEM-2010, Oct. 21-23, 2010, AHEC, IIT Roorkee, India

              PROTOTYPE HILL CHART TESTING OF A SAXO UNIT
                            Emmanuel Côté, Jr. Eng. and Éric Cloutier, Eng.
                                       Test Engineers, Hydro-Québec,
                           5565, rue De Marseille, Montréal, Qc, Canada, H1N 1A4

  SYNOPSIS
  Performance tests of hydraulic turbine prototypes are often carried out at a specified net head and efficiency is
  assumed to be constant with head or to behave like a model. However, in a power plant where head is low and
  can double from a season to another, these assumptions are not accurate. Since its 10.5 MW “Saxo” turbines are
  operated at a net head varying from 8 to 20 meters, power plant operation would benefit having accurate
  performance charts based on prototype measurement for the entire net head operating range.

  The main objective of the efficiency measurement was to validate contractual efficiency guarantee clauses using
  current meters with hydraulic conditions near the specified net head. The second objective was to extend the
  knowledge of the unit efficiency to all the operating net heads and reproduce the hill chart of the turbine based
  on prototype testing. In order to do that, a permanent measuring system was installed to measure efficiency using
  the transient time acoustic method calibrated with the current meters to measure the flow.

  Major differences were revealed as the hill chart of the turbine was redrawn and compared with the one based on
  non-homologous model testing. The prototype peak efficiency is lower than expected since model testing
  showed an increase with net head on all the operating range while prototype testing showed a decrease in
  efficiency at higher heads. The peak efficiency also occurs at a lower flow than expected.

  These tests now allow the operation of the power plant with knowledge of the unit’s performances over all their
  net head operating range, thus allowing a far more efficient power production.

  POWER PLANT
  The hydraulic power plant is located on Gatineau River near the town of Mont-Laurier in Québec, Canada. It has
  been commissioned in 2007 on an already existing dam and reservoir with 5 vertical axial flow Kaplan turbines.
  As shown on figure 1, each one of the “Saxo” turbines has its own penstock with an elbow upstream of the fixed
  guide vanes and is coupled directly to its own generator rotating at 200 rpm. The water flow exits the draft tubes
  directly into the river. While the specified net head of the turbines is fixed at 18 meters, one particularity of this
  power plant is that the upstream water level changes a lot with the seasons which causes the net head to vary
  from 8 to 20 meters during a year.

                                                Figure 1: Unit configuration

                                                             1
_______________________________________________________________________________________________
  IGHEM-2010, Oct. 21-23, 2010, AHEC, IIT Roorkee, India

  OBJECTIVES
  The contract with the generator unit supplier specified that the guaranteed unit efficiency would be for a net head
  of 18 meters and that the absolute testing were going to be done with a measurement set up that complies with
  the IEC 60041-1991 [1] as much as possible. Hence, measurements were done on the unit near the specified net
  head using a current meter structure in the penstock to measure the flow.

  However, for the purpose of unit’s operation optimisation, their characteristics also needed to be known over all
  their net head operating range. Therefore, efficiency testing at different net head was necessary. Since head
  variation plan over the year cannot be changed rapidly for unit testing, a simpler measurement set up that could
  be left on the unit for an extended period of time and accessed remotely was set up to carry out additional testing
  during the year at different head.

  This paper will explain how the complete characterisation of the small “Saxo” units was done firstly by using the
  absolute contractual testing at the specified net head and secondly by extending the net head range with simpler
  testing over a variety of net heads within the operating range.

  CURRENT METERS MEASUREMENTS
  Flow
  The current meters method was used to determine the discharge. In an ideal case, according to IEC 60041 [1]
  and ISO 3354 [2], the current meter section would have been installed in a straight section of conduit at least
  twenty pipe diameters downstream and five diameters upstream of any irregularity. However, given the
  geometry of the present unit’s penstock illustrated on figure 1, the supporting structure was installed less than
  one diameter upstream of the 90° intake elbow and approximately three diameters downstream of the diverging
  section.

  To allow accurate flow measurement in possible irregular flow conditions, 44 current meters were distributed
  along eight radius and six concentric circles in addition to the four current meters placed near the center
  (figure 2). On the outermost ring, eight small current meters with 50 mm propeller were used. The other current
  meters used 120 mm propeller. Using the velocity profile given by the current meters, the flow can be integrated
  to cover the whole section using the numerical method detailed in ISO 3354 [2].

                                         Figure 2: Disposition of the current meters

                                                             2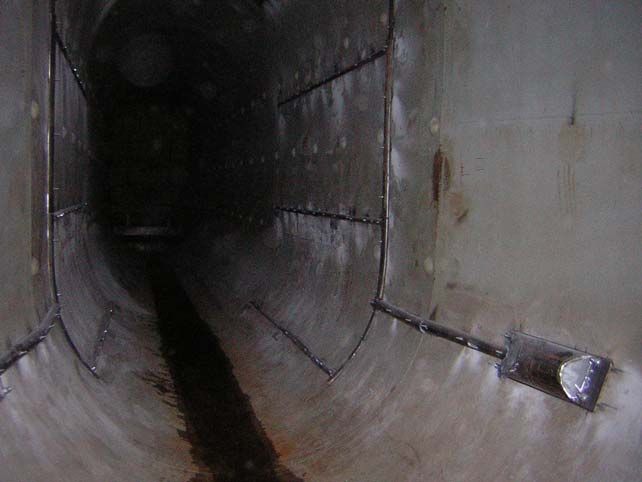
_______________________________________________________________________________________________
  IGHEM-2010, Oct. 21-23, 2010, AHEC, IIT Roorkee, India

  A moving frame with current meters was also installed in the stop log gate slot approximately one meter
  downstream of the trash racks to scan the velocity profile at the water intake. Two rows of ten current meters
  with 100 mm propellers were distributed on the frame shown on figure 3. This second method for measuring the
  flow is used for its simplicity of deployment in order to be transferred on the other units for individual
  performance measurements. In comparison with penstock measurements, a moving frame at the intake has the
  major advantage of reducing greatly the installation costs and the productions losses caused by extended unit
  downtime.

                                       Figure 3: Moving frame at the intake of the unit

  The results of the first three runs with this method were similar to the contractual ones measured in the penstock.
  The difference between the two methods is less than 0.35 % for those first three runs. Unfortunately, after those
  runs, current meters were damaged by logs that managed to pass through the trash racks.

  The transient-time acoustic method for measuring the flow was also used in the penstock upstream of the
  diverging section. It will be discussed in the extended net head testing section of this paper.

  Head
  The net head was calculated using the four static pressure measured at the upstream contractual section between
  the divergent and the current meter structure, the two static pressure at the downstream section located at the end
  of the draft tube, the elevation of those sections as well as average water velocity at those sections. The pressure
  transducers for each section were placed at the same elevation in order to be independent of possible inaccuracy
  in the power plant reference benchmarks.

  Output
  The generator output was measured using the three wattmeter method with an accuracy of ±0.1 %. To improve
  the accuracy of the measurement, calibrated voltage and current transformer were installed.

  Correction applied
  Since the current meters structure has been installed downstream of the static pressure taps, its head loss is taken
  into account in the net head measurement and would be imputed to the turbine if no correction would have been
  applied. Losses caused by the main structure, the current meters and the pipes for the wires were estimated using
  literature and CFD analysis. The following relation gives the correction applied as a function of the flow:

                                            ΔHn = -9.49×10⁻⁵ Q2            (kPa)

                                                              3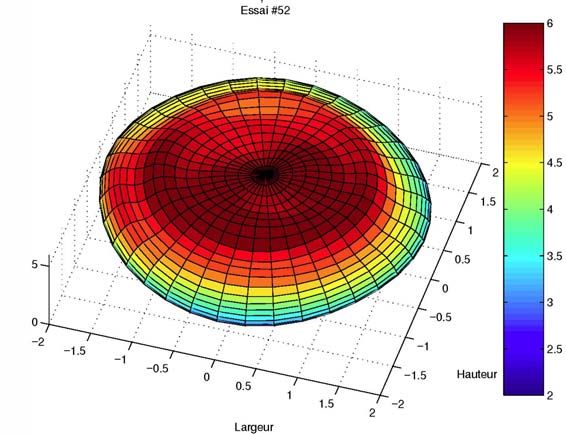
_______________________________________________________________________________________________
  IGHEM-2010, Oct. 21-23, 2010, AHEC, IIT Roorkee, India

  Efficiency results
  The performance tests lasted two days and over 60 steady state points were taken at different fixed blade position
  while varying the wicket gates opening. Results differ from what was expected from the non-homologous model
  testing (figure 4). The difference probably lies in the imprecision of the model testing caused by the upstream
  90° elbow not being correctly modelled.

  As it can be seen on the 100% blade opening curve on figure 4, the efficiency dropped steeply after 10 MW on
  the first testing. To respect the contractual guarantee, other testing was conducted after increasing the maximal
  blade opening to the mechanical maximum that corresponds to 107% of the original nominal opening. That
  simple modification of the blade opening illustrated as the blade 107% curve on figure 4 allowed a gain of
  efficiency of up to 4% at higher outputs.

                                         90

                                         89

                                         88
                   Unit efficiency (%)

                                         87

                                         86

                                         85

                                                                                          Blades 100%
                                         84                                               Blades 85,65%
                                                                                          Blades 76,60%
                                                                                          Blades 66,28%
                                                                                          Blades 56,59%
                                                                                          Blades 27,02%
                                         83                                               Blades 107%
                                                                                          Expected performances curve
                                                                                          Blades 45,44%
                                         82
                                              3   4            5          6          7          8            9           10       11
                                                                            Unit output (MW)
                                                         Figure 4: Efficiency vs. unit output at 18 meters

  Because of the configuration of the unit’s penstock, the current meters have been installed near irregularities
  such as a diverging section and a 90° elbow. During the first two tests, communication was lost with one current
  meter at the bottom of the section. As illustrated on figure 5, the velocity profile was not very well distributed at
  higher flow. The mean value of the index of asymmetry as stated in ISO 3354 standard [2] is 0.053. This value is
  slightly higher than the recommendation, but a higher number of current meters were used to compensate. In this
  case, 43 current meters were measuring while the IEC 60041 recommends a number of current meters between
  24 and 28.

  To calculate the level of confidence in the results, an evaluation of the uncertainty caused by the number of
  measurement points have been done and the uncertainty on the resulting flow caused by the imperfections in the
  velocity distribution has been evaluated at ±0.5%.
                                                                                                                 Velocity (m/s)

                                                                                                         Height (m)

                                                             Width (m)

                                                      Figure 5: Velocity distribution at the measuring section

                                                                                 4
_______________________________________________________________________________________________
IGHEM-2010, Oct. 21-23, 2010, AHEC, IIT Roorkee, India
EXTENDED NET HEAD TESTING
Simplified measurement set up
Since net head is relatively low and encounters major variations during the year, assuming that the efficiency is
constant with head is not accurate. Model testing could also have given knowledge of the unit’s efficiency over
all its operating range, but since they were done on a non-homologous model, confidence in the model’s hill
chart testing is quite low. Therefore, to make sure that the unit can be operated optimally, prototype efficiency
testing needed to be done over a wider range of net head.
In order to be able to leave a permanent measuring system at the power plant for an extended period of time, a
simplified measurement set up for relative efficiency testing was installed. Instead of the current meter structure
that was not made to be left in the penstock for a long time, a transient-time acoustic system was used to measure
the flow. The acoustic flowmeter computed the flow by integrating the water velocities measured by ultrasonic
probes at a cross-section of the penstock along eight paths in two cross planes. More detail on the acoustic
method for measuring the flow can be found in appendix J of IEC 60041 code [1]. The probes were installed
before the contractual testing so their resulting flow could be compared with the one coming from the current
meters and be calibrated with it as an index. The net head pressure was given directly by a differential pressure
transducer connected to the upstream and downstream sections. Output power was given by permanent
wattmeter while gate and blade position were also given by permanent transducers. All signals were connected to
a data acquisition system which could be accessed remotely.
Probes
Wires
Figure 6: Installation of the transient time acoustic probes.
Testing method and data processing
The acquisition system was acquiring data continuously, sampling each signal at 100 Hz and saving its average
every 10 seconds. That way, the net head profile could be followed and when desired conditions were reached, a
testing procedure was executed. The procedure consisted of moving the wicket gates in “on cam” mode to move
the blades to a given position. After a five minutes hydraulic stabilization, “off cam” sliding gates testing was
done by moving the gates from -10 % to +10 % of the “on cam” gate position while the blades remained in
position. Since the rate of the regulator for the opening of the gates could not be lowered to less than 0.1 % per
second, a 30 seconds pause was done at every percent of gate opening to make sure hydraulic conditions were
stable. The last steps were repeated for every 10 % of blade opening, starting at 20 %.
Each step of gate opening is processed and after the resulting flow and output have bean converted to the average
specific energy. A reversed “U” shaped curve is drawn on the efficiency chart for each blade opening. Supposing
that the turbine is operated with optimal cam relationship (adjustments will be made in the regulator based on
these testing), the efficiency curve at a given net head is plotted by connecting the tangent of all the constant
blade opening curves normalized at the same specific energy (figure 7). Each intersection of two curves gives an
operating point with all the desired parameters that are normalized back to its measured specific energy to be
placed on the prototype hill chart.
5_______________________________________________________________________________________________
IGHEM-2010, Oct. 21-23, 2010, AHEC, IIT Roorkee, India
Efficiency vs flow normalized at 16.5 m
89
88
87
86
85
Unit efficiency (%)
84
83
82 Best CAM 100% Blade
90% Blade 80% Blade
81
70% Blade 60% Blade
80 50% Blade 40% Blade
30% Blade 20% Blade
79 15% Blade
78
15 20 25 30 35 40 45 50 55 60 65 70 75
Flow (m³/s)
Figure 7: Off CAM parabolas and best CAM efficiency curve
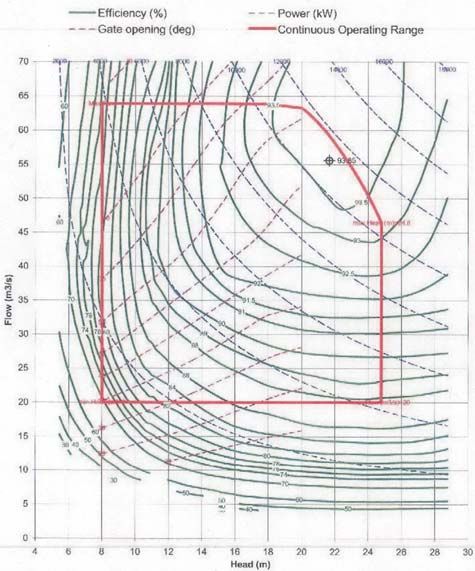
Prototype hill chart
Height days of testing at six different net head were done between February and June 2009. The resulting
prototype hill chart which summarise the main characteristics of the generator unit is shown at figure 8
Figure 8: Prototype hill chart of the unit as measured
Since the testing, efficiency at higher flow as well as maximal flow and output have been increased by allowing
the blades to be opened seven percent more.
An interesting fact observed is that at lower head, beyond a certain maximal output, more gate opening led to a
decrease of output and a drastic loss of efficiency. Moreover, another important fact for operation is that
regardless of the head, the peak in efficiency occurred almost at a constant flow.
6_______________________________________________________________________________________________
IGHEM-2010, Oct. 21-23, 2010, AHEC, IIT Roorkee, India
Figure 9 presents a comparison between the measured prototype turbine hill chart and the one based on non-
homologous model testing.
Figure 9: left: ©Voith-Siemens, 2007: Expected prototype turbine performances;
right: Hydro-Québec, 2009: Measured prototype turbine performances
Major differences appear as the two hill charts are compared. It can be partially explained by the fact that the
model used for the testing was not a homologous representation of the prototype. It had for instance its elbow
downstream of the runner instead of upstream. Based on the model testing, efficiency should have increased with
head in all of the operating range before reaching its optimum slightly before 22 m of net head. However,
prototype testing showed a slight decrease in efficiency between 17 and 19 m of net head. Model also indicated
that the peak of efficiency should have occurred near 55 m³/s of flow while prototype testing showed that the
decrease in efficiency started between 45 and 50 m³/s.
During the contractual current meters tests, the head remained between 18.5 and 20.0 meters while the
guaranteed efficiency was for the specified net head of 18.0 meters. At first, to convert the results, the model hill
chart was used, but after the determination of the prototype hill, a significant correction was done to the results.
When flow and output are converted to the specified net head using the prototype hill, efficiency is 0.5% higher
than when converted with the model hill. Using the model hill could have caused a penalty to the manufacturer.
CONCLUSIONS
Even with unfavourable conduit configuration, the current meters method for measuring the flow has given
reliable results to characterise the performances of the 10.5 MW “Saxo” turbine. Increasing the number of
current-meter compensated for the irregularity of the flow. A simplified measurement set up using the transient-
time acoustic method for measuring the flow also allowed measuring the turbine’s performances over all of the
large net head operating range and redrawing its hill chart based on prototype measurement.
For guaranty verification purpose, the measured hill chart allowed a much more precise conversion of the results
to the specified net head, the efficiency being 0.5% higher than it would have been converting with the model
hill. The prototype hill chart testing will also allow doing optimal cam adjustments and like it can be seen on
figure 4 and 7, cam adjustment is critical in turbine’s efficiency optimisation and it was way off.
Operation will also benefit having accurate performance curve upon all the net head operating range. The
information needed to get the optimal efficiency in all of the operating conditions is now accurate and it was
shown that operating the unit using the model’s performance characteristics would have cause an important loss
of efficiency and money. For all those reason, those prototype efficiency testing will be profitable even with
small units like those one.
7_______________________________________________________________________________________________
IGHEM-2010, Oct. 21-23, 2010, AHEC, IIT Roorkee, India
REFERENCES
1. IEC 60041, “International Standard: Field acceptance tests to determine the hydraulic performance of
hydraulic turbines, storage pumps and pump-turbines”, third edition, 1991-11.
2. ISO 3354, “Measurement of clean water flow in closed conduits - Velocity-area method using current
meters in full conduits and under regular flow conditions”, second edition, 1988-07-15.
3. Éric Cloutier, “Rapport ES-2008-2018 - Groupe 03 - Détermination du rendement du groupe par la méthode
jaugeage aux moulinets – Centrale …”, Hydro-Québec, 2010-04-08
4. Emmanuel Côté, Éric Cloutier, “Groupe 3 - Rendement à chutes multiples – Centrale …”, Hydro-Québec,
2010-07-19
BIOGRAPHY
Emmanuel Côté graduated in mechanical Engineering from the University of Sherbrooke in 2007. Since 2008,
he works for Hydro-Québec Production’s testing department. He has already performed testing of hydraulic
turbine performances using the department’s main methods such as: current meters, transient-time acoustic,
pressure-time, thermodynamics and different index.
Éric Cloutier graduated in mechanical Engineering from the University of Sherbrooke in 1997. Since 1999, he
has worked on the commissioning of Hydro-Quebec's major power plants. He has performed many performance
tests using different methods and is responsible for the engineering team of the testing department.
8You can also read