Research on Statistics of Passenger Transfer Flow at Urban Rail Transit Station - IOPscience
←
→
Page content transcription
If your browser does not render page correctly, please read the page content below

IOP Conference Series: Earth and Environmental Science

PAPER • OPEN ACCESS

Research on Statistics of Passenger Transfer Flow at Urban Rail Transit
Station
To cite this article: Kunkun Zhu and Qiangqiang Li 2021 IOP Conf. Ser.: Earth Environ. Sci. 634 012105

View the article online for updates and enhancements.

 This content was downloaded from IP address 46.4.80.155 on 12/02/2021 at 15:01
CCESEM 2020 IOP Publishing
IOP Conf. Series: Earth and Environmental Science 634 (2021) 012105 doi:10.1088/1755-1315/634/1/012105

Research on Statistics of Passenger Transfer Flow at Urban
Rail Transit Station

 Kunkun Zhu1,a, Qiangqiang Li1*
 1
 School of Highway, Chang’an University, Xi’an 710064, Shaanxi, China
 a
 2018121212@chd.edu.cn
 *
 Corresponding author’s e-mail: 18788868586@163.com

 Abstract. With the continuous advancement of urbanization, the urban rail transit network
 continues to be dense, and the number of transfer stations increases, resulting in an increase in
 the flow of interchange passengers. This paper introduces pedestrian detection into the
 statistics to realize real-time statistics of passenger transfer flow. This article first determines
 the research scenario and simplifies the transfer path. Then, the pedestrian detection model is
 constructed by using the histogram of gradient directions (HOG) and support vector machine
 (SVM), and combined with the continuous adaptive mean shift algorithm (CamShift) to design
 and realize the transfer path passenger flow statistics. Finally, the algorithm was trained and
 tested through the samples obtained at Xi'an Xiaozhai subway station, and the test results
 obtained have high accuracy.

1. Introduction
In recent years, the urban rail transit network has been improved, the number of transfer stations in the
line network has increased year by year, and the transfer passengers have large numbers and
complicated transfer routes. How to realize real-time statistics of transfer passengers flow has great
significance to the operation and management of urban rail transit transfer stations.
 In the existing research, many scholars have used Automatic Fare Collection date (AFC) to study
the characteristics of passenger flow in stations [1-2]. However, AFC data only provides data on
passenger flow in and out of the station, and there are few statistics on transfer passenger flow.
Therefore, the article considers the introduction of pedestrian detection technology into the transfer
flow statistics of urban rail transit to realize real-time statistics of transfer route passenger flow.
 Domestic and abroad research on pedestrian detection is mainly based on template matching and
statistical learning. The basic idea of template matching is to collect image samples of different parts
of pedestrians, and achieve the purpose of pedestrian detection by constructing a similarity
combination relationship model between the samples and the targets. Philomin V. et al. [3] obtained a
multi-pose template, specified indicators to measure the similarity between the evaluation sample and
the template, and finally used a hierarchical template for matching. Lin Z. et al. [4] extract the local
and global features of pedestrian images, and hierarchically use local feature decision trees to achieve
pedestrian detection. The main idea of statistical learning is to process the sample algorithmically,
extract its characteristic data, and then train the classifier to classify the characteristic data.
Papageorgiou. et al. [5] designed to use Haar wavelet to extract features from positive and negative
samples, and select support vector machines (SVM) to train the feature data. The model learns from
the samples and does not rely on any prior models or motion-based segmentation. Dalal N. et al. [6]

 Content from this work may be used under the terms of the Creative Commons Attribution 3.0 licence. Any further distribution
 of this work must maintain attribution to the author(s) and the title of the work, journal citation and DOI.
Published under licence by IOP Publishing Ltd 1
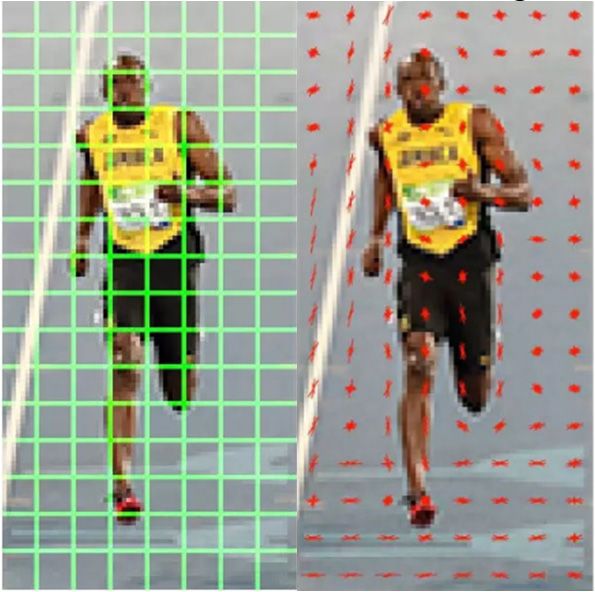
CCESEM 2020 IOP Publishing
IOP Conf. Series: Earth and Environmental Science 634 (2021) 012105 doi:10.1088/1755-1315/634/1/012105

designed the use of directional gradient histogram (HOG) for feature extraction of samples, and the
combination with SVM has an excellent effect. Jia Shijie et al. [7] first calculated the Haar features of
pedestrian heads, used the Adaboostclassifier to learn the samples, and used the continuous adaptive
mean shift algorithm (CamShift) for pedestrian tracking. For crowded people, the average accuracy of
this method reached 98.2%.Experiments show that the pedestrian features of the HOG descriptor are
significantly better than the existing human detection feature set. Therefore, the article combines
HOG-SVM and CamShift to realize the statistics of transfer passenger flow paths.

2. Research scenario determination
As the transfer path becomes more and more complex, in order to improve the pertinence of the model,
the transfer path is simplified. The main transfer methods are divided into: cross transfer, L-type
transfer, T-type transfer, and H-type transfer [8].
 Cross transfer: The station generally has three floors, the first floor is the station hall floor, and the
lower two floors are the cross-intersecting platform floor. Advantages and disadvantages: The transfer
lines in both directions are shorter and the transfer efficiency is higher; but passenger flow gather in
the centre of the platform, which is likely to cause congestion.
 L-shaped transfer: The two transfer platforms intersect in an L-shape, and passengers can transfer
through the passage or escalator at the intersection of the platforms. Advantages and disadvantages:
The direction of passenger flow transfer is clear, but the transfer distance is long due to the transfer at
both ends of the platform.
 T-shaped transfer: The transfer platforms intersect in a T shape, and the middle of one platform is
connected to one end of the other platform, and the transfer is carried out through escalators or stairs.
Advantages and disadvantages: the transfer distance in one direction is longer, and the other is shorter,
which is suitable for passengers with unbalanced transfer directions.
 H-type transfer: The two transfer platforms are arranged in parallel, connected by a transfer
passage, and the platform and the transfer passage are H-shaped. Advantages and disadvantages:
Generally, the H-type transfer distance is long (generally more than 100m), and it is difficult to use
other transfer methods to use the H-type transfer.
 Because of the cross-shaped, T-shaped, H-shaped, and L-shaped transfer paths, the transfer path
generally contains one-way passenger passages, stairs, and escalators, and the flow of passengers is
simple; especially when the pedestrian density is high at the escalator, pedestrians stand side by side,
the speed is basically the same. In order to effectively carry out transfer passenger flow statistics, this
paper considers the one-way passage, stairs or escalators in the above transfer path as the detection
scene.

3. Pedestrian detection technology
Considering the effectiveness and feasibility, this article uses statistics-based pedestrian detection
counting. This method is generally divided into feature extraction and classification recognition.
Feature extraction is to simplify the target image into a segment of identifiable feature data, and
classification recognition is a two-classification problem, that is, whether the target is a pedestrian.
The positive and negative samples after feature extraction are added to the classification model for
training, and the trained classifier is used to judge the target to realize pedestrian detection.

3.1. feature extraction
This paper uses HOG to extract features from images.
 Since the colour will greatly increase the computational complexity, the original image is processed
in grayscale first. The HOG feature divides the image into 64×128 windows. First, calculate the
gradient and amplitude of all pixels in the windows using convolution. Next, combine the 3*3
windows without overlapping into one unit, and classify the gradient of each pixels in unit by
direction(For example, 0-360° is divided into 9 categories, each category is 40°). Then sum the
magnitude of the gradient in each direction to get the gradient histogram of each unit. Finally regard

 2
CCESEM 2020 IOP Publishing
IOP Conf. Series: Earth and Environmental Science 634 (2021) 012105 doi:10.1088/1755-1315/634/1/012105
the 3*3 unit as a blockand the histogram of each unit in blocks is combined into a one-dimensional
vector and normalized. The HOG feature is the result of connecting all the normalized vectors of the
blocks. The schematic diagram of HOG features is shown in Figure 1.
Figure 1. Schematic diagram of HOG features
3.2. Classifier
The feature data of the image will be input into the classification machine to segment the sample.
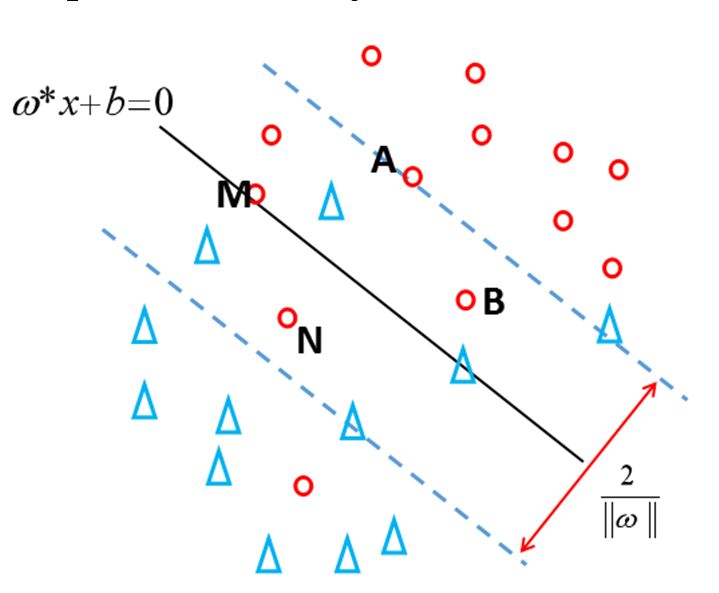
SVM is a two-class classification model. Its purpose is to find a hyperplane to segment samples. The
principle of segmentation is to maximize the interval. In this way, positive samples of pedestrians can
be distinguished from negative samples of other objects.
Figure 2. SVM hyperplane
Assume that the training set T is defined as the feature set of HOG:
T={(x1 ,y1 ),(x 2 ,y 2 ),...((x N ,y N ))}
(1)
x i ∈ R n , yi ∈ {+1, −1}, i = 1, 2,...N
Where is the i-th HOG feature vector, yi is the positive and negative sample label, +1 represents
the pedestrian sample label, and -1 other sample labels.
The geometric interval between the training set T and the hyperplane is defined as follows:
ω b
γ i =yi ⋅ xi + (2)
ω ω
The minimum geometric interval of all sample points is required. At this time, the problem of
solving the optimal segmentation hyperplane of the SVM model can be expressed as an optimization
problem, and after transformation, the equation (3) is obtained.
1 N N N
L( w, b, a ) = min ai a j yi y j ( xi ⋅ x j ) − ai (3)
α 2
i =1 i =1 i =1
Finally, find the optimal solution.
3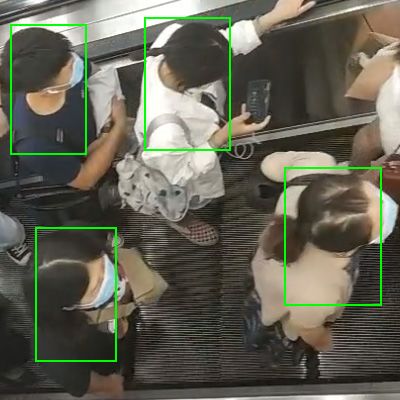
CCESEM 2020 IOP Publishing IOP Conf. Series: Earth and Environmental Science 634 (2021) 012105 doi:10.1088/1755-1315/634/1/012105 And calculate w*, b* according to the following formula: N w * = ai* yi ( xi ⋅ x j ) (4) i =1 N b = y j − ai* yi ( xi ⋅ x j ) * (5) i =1 In this way, the optimal hyperplane is obtained: w * ⋅ x + b* = 0 (6) 4. Target tracking Pedestrian detection can determine the location of pedestrians in the image, that is, a search window containing pedestrian targets. However, in order to count the passenger flow, it is necessary to use the target tracking method to track the identified pedestrian, that is, to determine the position of the pedestrian in the subsequent frames of the video to realize the passenger flow statistics. The commonly used multi-target tracking method is MeanShift. Figure 3. Schematic diagram of MeanShift principle Set the center point of the search window as X. Then draw a circle with a specific radius with X as the center, calculate the distance from all points in the circle to X. Next, take the average of distance to get the mean shift value of the center point. Finally the center point moves to the point in the direction of the mean shift, and then moves to the next point in the same way. Bradski G. R. et al. [9] proposed the CamShift algorithm based on the MeanShift algorithm. The main idea is to use MeanShift to obtain the center point of the tracking target for each frame, as the initial value of the MeanShift algorithm for the next frame, and repeat the iteration. The basic steps as follows: • Initialize the search window in HOG-SVM; • Determine the search area and convert the image into a color probability distribution image; • Iterative search using MeanShift algorithm, the end condition of the iteration is to reach the maximum number of iterations or iterative convergence; • Obtain the center position and window size of the search window from the results of step 4, and substitute them into step 2 as new parameters to achieve continuous tracking. 5. Case Analysis 5.1. Sample collection and feature calculation Select transfer route from line 3 to line 2 in Xi’an Xiaozhai station which is T-shaped transfer station. The detection time is 7:30-8:00. At this time, on the escalator from Line 3 to the station hall in the transfer path, most of the passenger flow is a single-direction passenger flow. The positive sample extracts the head and shoulders information of the passenger flow for HOG calculation. Select the head and shoulders of the pedestrian in the video frame to mark it with a 4
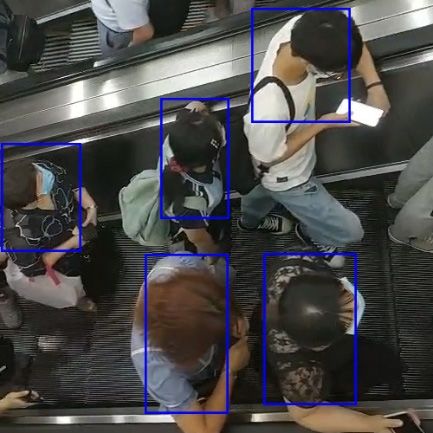
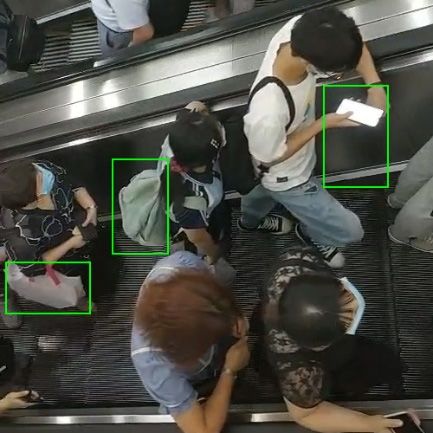
CCESEM 2020 IOP Publishing
IOP Conf. Series: Earth and Environmental Science 634 (2021) 012105 doi:10.1088/1755-1315/634/1/012105

rectangular box, and the marking box is required to include the head and shoulders of the pedestrian as
much as possible. A total of 1665 positive samples from different positions were obtained, as shown in
Figure 4(a). After background extraction, the detection point interferers include moving escalators,
other parts of pedestrians, such as backpacks, handbags, mobile phones, trunk parts, and a total of
1701 negative samples are obtained, as shown in Figure 4(b).

 .
 (a) Positive sample extraction (b) Negative sample extraction
 Figure 4. Sample extraction

 The HOG feature data of the positive and negative samples are divided into a training set and a test
set. The training set accounts for 60%, the validation set accounts for 20%, the remaining 20% is
confused, and the negative samples are mixed into the positive samples as the test set. Input the
training set into the SVM with set parameters, train the classifier, and save the first classifier. Use the
trained classifier to detect negative samples to obtain difficult cases, and then perform a second
learning on the difficult cases to reduce the false detection rate in this way. Finally, it is substituted
into the test set for inspection. The accuracy rate is about 91.54%.
 Table 1. Test set sample
 Positive sample Negative sample
 total Accuracy
 numbers correct numbers correct
 Positive sample 318 293 15 13 333 91.90%
 Negative sample 39 36 301 274 340 91.18%

5.2. Target tracking
In this paper, target tracking is implemented using the built-in function of Python_Opencv, and the
search window box obtained by pedestrian detection is input into this function to achieve tracking.
Figure 5 shows the statistical process.

 Figure 5. Passenger flow statistics

 5
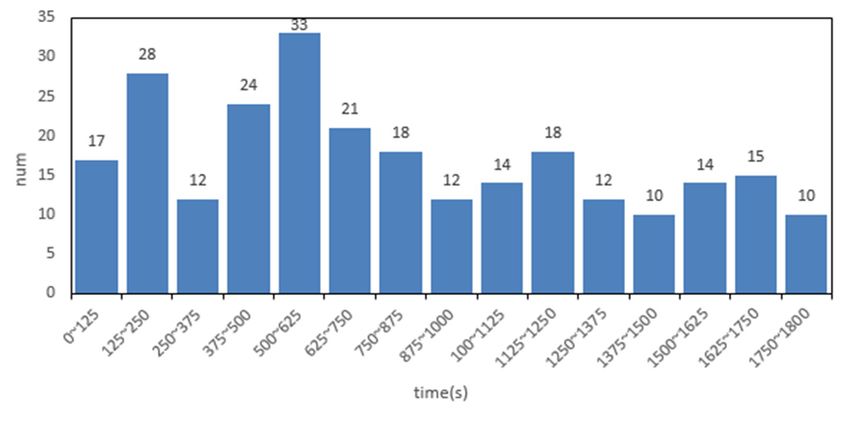
CCESEM 2020 IOP Publishing
IOP Conf. Series: Earth and Environmental Science 634 (2021) 012105 doi:10.1088/1755-1315/634/1/012105

 According to Figure 5(a), after training on difficult cases, interference objects such as backpacks
and targets can be distinguished well, reducing the false detection rate. As for pedestrian tracking,
CamShift performs well in tracking. The model is basically running well. The picture below shows the
passenger flow time series data collected by the video with a time scale of 1s.

 (a) Test data

 (b) Actual data
 Figure 6. Passenger flow time series data

6. Conclusion
With the development of cities, the urban rail transit network continues to be dense, and the pressure
of passenger flow continues to increase. With the increase of transfer stations, the flow of transfer
passengers is also increasing. In view of its complex path and large fluctuations over time, this paper
introduces pedestrian detection into the statistics of interchange passenger flow.
 First, the research scenario is determined, the transfer path is simplified, and the pertinence of the
model is improved. Next, extract the HOG feature of the sample, and input the feature data into the
SVM classifier for training and testing. The final test shows that the trained classifier can accurately
distinguish passengers and other objects.Finally, use CamShift to track the location of passengers, so
as to realize the statistics of the transfer passengers. The obtained test results show that the model has
high accuracy for the statistics of transfer passengers flow.

References
[1] You Qing. (2019) Analysis of Passenger Flow Characteristics of Zhengzhou Rail Transit
 Based on AFC System. Urban Express Rail Transit, 32(06): 56-62.
[2] Wang Xingchuan, Yao Enjian, Liu Shasha. (2018) Urban rail transit passenger flow
 prediction during large-scale events based on AFC data. Journal of Beijing Jiaotong
 University, 42(01): 87-93.

 6
CCESEM 2020 IOP Publishing
IOP Conf. Series: Earth and Environmental Science 634 (2021) 012105 doi:10.1088/1755-1315/634/1/012105

[3] Philomin V., Duraiswami R., and Davis L. (2000) Pedestrian tracking from a moving vehicle.
 In: Proceedings of the IEEE Intelligent Vehicles Symposium 2000 (Cat. No.00TH8511),
 Dearborn, MI, USA, pp. 350-355.
[4] Lin Z., Hua G., and Davis L. S. (2009) Multiple instance Feature for robust part-based object
 detection. In: 2009 IEEE Conference on Computer Vision and Pattern Recognition,
 Miami, FL, pp. 405-412.
[5] Papageorgiou, Oren M., Poggio T. (1998) A general framework for object detection. In:
 Sixth International Conference on Computer Vision (IEEE Cat. No.98CH36271),
 Bombay, India, pp. 555-562.
[6] Dalal N., Triggs B. (2008) Histograms of oriented gradients for human detection. In: 2005
 IEEE Computer Society Conference on Computer Vision and Pattern Recognition
 (CVPR'05), San Diego, CA, USA, pp. 886-893 vol. 1.
[7] Jia Shijie, Wu Huabin, Zhang Yuanyuan. (2015) Automatic statistics of human flow in
 shopping malls based on human head target detection. Journal of Dalian Jiaotong
 University, 36(03): 82-86.
[8] Sha Bin, Yuan Zhenzhou, Miao Jianghua, Cao Shouhua. (2006) Comparative analysis of urban
 rail transit transfer modes. Urban Transportation, (02): 11-15.
[9] Bradski G. R. (1998) Real time face and object tracking as a component of a perceptual user
 interface. In: Proceedings Fourth IEEE Workshop on Applications of Computer Vision.
 WACV'98 (Cat. No.98EX201), Princeton, NJ, USA, pp. 214-219.

 7
You can also read