Australia: SVOD Study - An Examination of Usage, Paying Subscribers, Content Supply & Demand - Media Partners Asia
←
→
Page content transcription
If your browser does not render page correctly, please read the page content below
Australia: SVOD Study
An Examination of Usage, Paying
Subscribers, Content Supply & Demand
July 2019

                               Private & Confidential
CONTENT
§ Overview      3

§ Methodology   7

§ Report ToC    12

OVERVIEW

           3
INTRODUCTION & STUDY OBJECTIVES

This first edition of SVOD Australia study provides the most up-to-date information
on the penetration, paid accounts, and use profiles of the major players in
Australia's vibrant and dynamic SVOD ecosystem.

The study investigates consumer adoption of entertainment and sports services,
with a focus on the supply and demand of content across all major streaming
platforms, uncovering the importance of access to specific types of programming.
Using primary research with robust samples, supplemented by exhaustive desk
research, the findings include an executive summary and comprehensive report with
analysis and charts.

AMPD Research is the consumer insights division of Media Partners Asia. AMPD
Research offers clients the latest innovation in consumer insights. We specialize in
media measurement, audience growth, content development, and revenue
optimization. Our platforms and services offer unparalleled insights into the supply
and demand for video and entertainment content globally.

                                                                                       4
Australia SVOD OVERVIEW
Viewers and Paid Subscriptions
§ With 10.7 Mn. viewers & 5.3 Million paying subscribers, Netflix leads 2nd place local service, Stan with its 3.4 Million Users & 1.4 Million. paying subscribers.
§ Foxtel Now’s year-old D2C service, has attracted 1.7 Million viewers and half a million paying subs, with Sport-specific SVOD services heavily fragmented.
Viewers (Mil.) Paid Subscribers (Mil.)
10.7
People 15+ (Millions)
5.3
3.4
1.4 1.7 1.5 1.5
1.0 1.3
0.5 0.6 0.6 0.8 0.7
0.3 0.2 0.3 0.2 0.2 0.1
Netflix Stan Foxtel Now Prime Video NRL Optus Sport hayu. AFL Live Pass Kayo Sports beIN Sports
Connect (D2C)
Users per
paying sub
2.0 2.4 3.3 2.1 2.6 1.5 3.3 2.4 1.7 3.1
Source: AMPD Research, April 2019 5
Base: All Respondents 15+ (N=2,089)
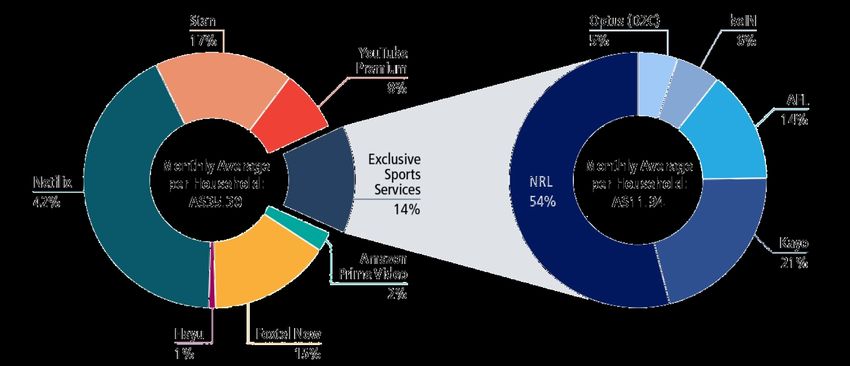
Source: AMPD Research Australia VOD Study, April 2019SHARE OF SVOD HOUSEHOLD SPEND BY SERVICE (A$)
§ The average monthly spend on SVOD services per household is A$35.30. Of this 14% is spent on sports SVODs (A$11.94).
§ Netflix commands the largest share of SVOD household spending with 42% share of wallet followed by Stan and Foxtel Now in 2nd and 3rd respectively.
§ NRL Live Pass occupies over half the sports SVOD share of household spend (54%) followed by Kayo (21%) and AFL Live Pass (14%) respectively.
A5.x. How much do you pay for your subscription to …? 6
Base: N=1200
Source: AMPD Research Australia VOD Study, April 2019METHODOLOGY
7METHODOLOGY - I
Data Collection and Sampling
Sample Distribution - Geographic Data Collection
(% & N= by State & Territory) § The Australia SVOD Study was conducted as an interactive online survey.
The target population are internet users aged 15 years of age and above.
§ Respondents were sampled according to representative quotas for age,
gender and state or territory, correspond preliminary estimated resident
population (ERP) of Australia at 31 December 2018 provided by the
Australian Bureau of Statistics.
§ The sample sourced was a consumer panel powered by Dynata.
NT: 0.5% Fieldwork Period & Sample Size
N=10 QLD: 21.7% § A total sample size of 2089 respondents completed a structured survey
WA: 10.4% N=454 composed of primarily closed-end questions with four open-ended
N=218 questions related to unmet needs.
SA: 8.2%
§ On average, respondents spent 18 minutes to complete the survey which
N=171 NSW: 28.2%
ACT: 2.2% was fielded between April 6-16, 2019.
N=589
N=45
Confidence Level & Margin of Error
§ Online access panels are by definition non-probability based samples.
TAS: 2.3% VIC: 26.5% However, at 95% confidence level the predicted margin of error
N=49 N=554 is 2.14%. This means, there is a 95% chance that the real value is within
±2.14% of the surveyed value.
Total Sample Size: N=2089
8METHODOLOGY - II
Demographics and Universe Projections
Sample Distribution - Demographic Representative Measurement
(% & N= by Age and Gender) § The survey is designed to be representative of the Australian population
aged 15 and over and projectable at a National level only, i.e. samples
are not designed to support regional comparisons.
Gender Female: 51% Male: 49% Projecting to a National Universe
§ The nature of online surveys and adherence to The Australian Market &
Social Research Society (AMSRS) Code of Professional Behaviour, limits
15-19 years 6% N=118 the practicable ability to interview those under the age of 15 years.
§ To yield projections for total market, i.e. including users aged 0-15,
20-34 years 27% N=570 AMPD Research used data collected by respondents on household
WA: 10.4% composition & the presence of children in order to estimate the total
N=218 user-base (viewers) of individual video-on-demand (VOD) services.
35-44 years 17% N=357 § For the purpose of determining household penetration estimates, where
the respondent is also the VOD service account holder, the projection
45-54 years 16% N=338 assumes the panellist represents the characteristic of the household in
which they they reside.
55 and over 34% N=705
0% 25% 50% 75% 100%
9METHODOLOGY - III
Household Income Profile, Data Quality and Calibration
Sample Distribution – Monthly Household Income Data Quality
(A$ % ) § AMPD Research uses stringent measures to ensure data integrity and
quality respondents, including logic & repetition tests and open-ended
questions for screening-out bots. Additional measures include checks for
speeders, straight-liners and non-response.
Less than A$ 2,000 16% N=143 Calibration & Adjustments
§ Online surveys can generate inflated results for certain question types &
topic areas. AMPD Research has developed a set of validated1
A$ 2,000 – 4,999 35% N=724
proprietary formulae to adjust for respondent over-claim to ensure
accuracy that includes the following areas:
A$ 5,000 – 9,999 24% N=504 • Claimed usage & subscription: We adjust for overclaim by
WA: 10.4% weighting responses based on recency of exposure, where more
N=218
recent engagements are given a greater significance.
A$ 10,000 – 14,999 8% N=173
• Claimed viewing duration: Respondents typically have difficulty in
recalling time spent viewing, so we employ a method that asks the
A$ 15,000 & above 4% N=87 number of movies, TV shows and sports events watched in past 7-
days and a apply a standard minutage to each type of event.
• Cancel/Upgrade Intent: We apply weights to responses as follows:
Refused/Don’t know 12% N=257
ü 1. Definitely will happen - 80%; 2. Probably will happen - 50%;
3. Probably won’t happen - 20%; 4. Definitely won’t happen –
0% 25% 50% 75% 100% 0%;
1 The AMPD Research proprietary formulae for adjusting over-claim in online community panels has been validated by comparing observed and recalled behaviour with passive media data and survey data.
10METHODOLOGY - IV
Net Promoter Score® (NPS) Calculation and Interpretation
Net Promoter Score (NPS) Net Promoter Score2
Q. How likely is it that you would recommend BRAND to a friend or § Net Promoter Score (NPS) is a widely used tool to gauge customer
colleague? loyalty and as a proxy for customer satisfaction.
§ The NPS is calculated on a scale of 0 - 10 in response to the question:
“How likely is it that you would recommend to a friend or colleague?”
§ Scores of 0 - 6 are considered “detractors”, 7 - 8 are “passives” and 9 -
10 are classified as “promoters.”
§ The final Net Promoter Score is calculated by subtracting the percentage
of customers who are “Detractors” from the percentage of customers
0 1 2 3 4 5 6 7 8 9 10
WA: 10.4% who are “Promoters.”
DETRACTORS PASSIVES PROMOTERS
N=218
Rated 0 – 6
Rated 7 – 8 Rated 9 – 10
NPS® Interpretation
- § NPS scores vary by sector, but a positive score is generally regarded as
- -
Unhappy customers who require urgent engagement &
Ambivalent Most Loyal “good”, a score of +50 is considered “excellent” and scores over +70
improvements to product or pricing to mitigate churn
- Customers are extremely rare.
-
Satisfied for -
Generally dissatisfied with current product offering
Now Satisfied • Detractors (0 - 6): Are unsatisfied by current product offering and
-
- - at very high risk of churning.
High potential risk of spreading negative sentiment about
product impacting brand perception & valuation
At Risk of Generate • Passives (7 - 8): While not included in the NPS calculation, they
Switching to Positive Word-
-
Competition of-Mouth
represent customers who may currently be satisfied with the current
Imminent risk of churn unless active re-engaged product, but are not loyal & susceptible to competitive offerings
• Promoters (9 - 10): Loyal & most satisfied customers.
NPS® = % Promoters − % Detractors
2 The Net Promoter Score® (NPS) methodology was developed by management consultancy, Bain & Company. Net Promoter®, Net Promoter Score® and NPS® are registered trademarks of Bain & Company, Inc., Fred Reichheld and Satmetrix Systems, Inc.
11REPORT ToC
12TABLE OF CONTENTS - I
INTRODUCTION CONTENT SUPPLY AND DEMAND SUMMARY
§ Background and Objectives § Available Content Supply by Service
§ Service Adoption & Content Demand by County of Origin
EXECUTIVE SUMMARY § Genres Demand Gaps by Age Cohort
METHODOLOGY ENTERTAINMENT SVOD SERVICE SUMMARIES
§ Data Collection and Sampling § Share of SVOD Households & Average Time Spent per User
§ Demographics and Universe Projections
§ Household Income Profile, Data Quality and Calibration FOXTEL NOW
§ Net Promoter Score® (NPS) Calculation and Interpretation § Age and Gender Profile
§ Content Supply Data Collection § Household Composition and Subscription Profile
§ Pay TV and SVOD Service Cross-Consumption
SVOD OVERVIEW § Content Supply Profile
§ Viewers and Paid Subscribers by Service § Underserved Categories & Genres
§ Share of SVOD Household Spend by Service § Growth and Marketing Conversion Metrics
§ Net Promoter® Scores by Service § Net Subscriber Gain/Loss Volumes – Current Run Rate
§ Age and Gender Profile § SWOT Analysis
§ Household Income Profile
§ Household Size and Presence of Children
§ Free Trial Conversion and Churn Indicators
13TABLE OF CONTENTS - II
HAYU PRIME VIDEO
§ Age and Gender Profile § Age and Gender Profile
§ Household Composition and Subscription Profile § Household Composition and Subscription Profile
§ Pay TV and SVOD Service Cross-Consumption § Pay TV and SVOD Service Cross-Consumption
§ Content Supply Profile § Content Supply Profile
§ Underserved Categories & Genres § Underserved Categories & Genres
§ Growth and Marketing Conversion Metrics § Growth and Marketing Conversion Metrics
§ Net Subscriber Gain/Loss Volumes – Current Run Rate § Net Subscriber Gain/Loss Volumes – Current Run Rate
§ SWOT Analysis § SWOT Analysis
NETFLIX STAN
§ Age and Gender Profile § Age and Gender Profile
§ Household Composition and Subscription Profile § Household Composition and Subscription Profile
§ Pay TV and SVOD Service Cross-Consumption § Pay TV and SVOD Service Cross-Consumption
§ Content Supply Profile § Content Supply Profile
§ Underserved Categories & Genres § Underserved Categories & Genres
§ Growth and Marketing Conversion Metrics
§ Growth and Marketing Conversion Metrics
§ Net Subscriber Gain/Loss Volumes – Current Run Rate
§ Net Subscriber Gain/Loss Volumes – Current Run Rate § SWOT Analysis
§ SWOT Analysis
14TABLE OF CONTENTS - III
YOUTUBE PREMIUM SPORTS SVOD SERVICE SUMMARIES
§ Age and Gender Profile § Share of SVOD Households & Average Time Spent per User
§ Household Composition and Subscription Profile
§ Pay TV and SVOD Service Cross-Consumption AFL LIVE PASS
§ Content Supply Profile § Age and Gender Profile
§ Underserved Categories & Genres § Household Composition and Subscription Profile
§ Pay TV and SVOD Service Cross-Consumption
§ SWOT Analysis
§ Growth and Marketing Conversion Metrics
§ Net Subscriber Gain/Loss Volumes – Current Run Rate
ENTERTAINMENT GENRE DEMAND BY COHORT § SWOT Analysis
§ Action & Adventure
§ Anime (Japanese) beIN SPORTS CONNECT
§ Comedy § Age and Gender Profile
§ Documentary § Household Composition and Subscription Profile
§ Drama § Pay TV and SVOD Service Cross-Consumption
§ Horror § Growth and Marketing Conversion Metrics
§ Reality TV § Net Subscriber Gain/Loss Volumes – Current Run Rate
§ Romance § SWOT Analysis
§ Sci-Fi & Fantasy
§ Thriller
15TABLE OF CONTENTS - IV
KAYO SPORTS OPTUS SPORTS
§ Age and Gender Profile § Age and Gender Profile
§ Household Composition and Subscription Profile § Household Composition and Subscription Profile
§ Pay TV and SVOD Service Cross-Consumption § Pay TV and SVOD Service Cross-Consumption
§ Growth and Marketing Conversion Metrics § Growth and Marketing Conversion Metrics
§ Net Subscriber Gain/Loss Volumes – Current Run Rate § Net Subscriber Gain/Loss Volumes – Current Run Rate
§ SWOT Analysis § SWOT Analysis
NRL LIVE PASS SUMMARY OF CONSUMER FEEDBACK
§ Age and Gender Profile § Verbatims of Areas for Improvement
§ Household Composition and Subscription Profile
§ Pay TV and SVOD Service Cross-Consumption APPENDICES
§ SWOT Analysis
OPTUS SPORTS
§ Age and Gender Profile
§ Household Composition and Subscription Profile
§ Pay TV and SVOD Service Cross-Consumption
§ Growth and Marketing Conversion Metrics
§ Net Subscriber Gain/Loss Volumes – Current Run Rate
§ SWOT Analysis
16ABOUT US
Insights that Power Media Growth
Strategies
AMPD Research offers clients the latest innovation in consumer insights. We
specialize in media measurement, audience growth, content development,
and revenue optimization. Our platforms and services offer unparalleled
insights into the supply and demand for video and entertainment content
globally.
We offer end-to-end evidence-based solutions that deliver actionable and
timely answers to key industry stakeholders, including
content creators, strategists, distributors, and investors.
AMPD Research is the consumer insights division of
17You can also read