Aegis Logistics Limited - "Positioned for growth" Investor Presentation
←
→
Page content transcription
If your browser does not render page correctly, please read the page content below
Aegis Logistics Limited
       “Positioned for growth”

     Investor Presentation
                     May 2018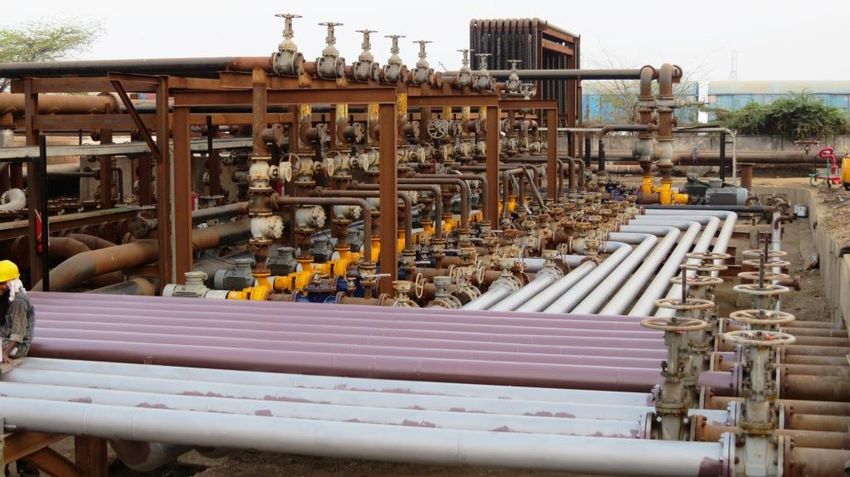
Safe Harbour

This presentation and the accompanying slides (the “Presentation”), which have been prepared by Aegis Logistics Limited (the
“Company”), have been prepared solely for information purposes and do not constitute any offer, recommendation or invitation
to purchase or subscribe for any securities, and shall not form the basis or be relied on in connection with any contract or binding
commitment whatsoever. No offering of securities of the Company will be made except by means of a statutory offering
document containing detailed information about the Company.

This Presentation has been prepared by the Company based on information and data which the Company considers reliable, but
the Company makes no representation or warranty, express or implied, whatsoever, and no reliance shall be placed on, the truth,
accuracy, completeness, fairness and reasonableness of the contents of this Presentation. This Presentation may not be all
inclusive and may not contain all of the information that you may consider material. Any liability in respect of the contents of, or
any omission from, this Presentation is expressly excluded.

This presentation contains certain forward looking statements concerning the Company’s future business prospects and business
profitability, which are subject to a number of risks and uncertainties and the actual results could materially differ from those in
such forward looking statements. The risks and uncertainties relating to these statements include, but are not limited to, risks and
uncertainties regarding fluctuations in earnings, our ability to manage growth, competition (both domestic and international),
economic growth in India and abroad, ability to attract and retain highly skilled professionals, time and cost over runs on
contracts, our ability to manage our international operations, government policies and actions regulations, interest and other
fiscal costs generally prevailing in the economy. The Company does not undertake to make any announcement in case any of
these forward looking statements become materially incorrect in future or update any forward looking statements made from
time to time by or on behalf of the Company.

                                                                                                                                       2
Strong Performance

        Revenue                                Normalized EBITDA*              PAT

            +22%                                          +24%                 +57%
                   4,791                                         306                  214

    3,939                                          247

                                                                        136

    FY17           FY18                            FY17          FY18   FY17          FY18

* Normalized EBITDA – Before Forex, Hedging Related Expenses
Financials are per IndAS; Rs. In Cr                                                          3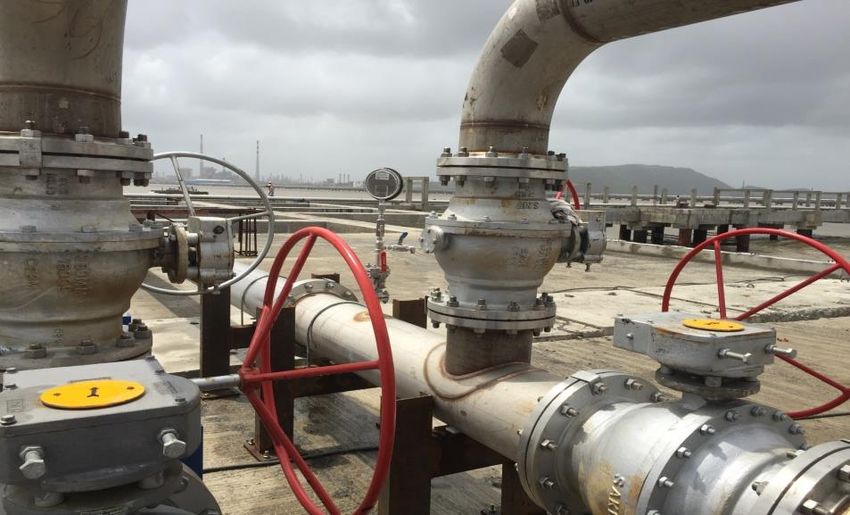
Current Business Break-up

               Liquid Division                                        Gas Division

▪ Business                                               ▪ Business
  – Third Party Liquid Logistics (3PL)                     – Third Party Gas Logistics (3PL)
  – O&M Services                           FY18 EBITDA     – Auto Gas Retailing and Packed LPG Cylinders
                                                             for Commercial segment
                                            Rs. 306 Cr
                                                           – Industrial Gas Distribution
                                         Liquid            – Marine Products Distribution (Bunkering)
                                          34%              – Gas Sourcing
                                                   Gas
                                                   66%
▪ Revenue Model                                          ▪ Revenue Model
  – Fee based Revenue Model                                – Fee based Revenue Model for Gas Logistics
  – Handling and Other Service Charges                     – Fees for Sourcing Business
  – O&M fees                                               – Retail Margin for Gas Distribution
                                                           – Handling and Other Service Charges

                                                                                                           4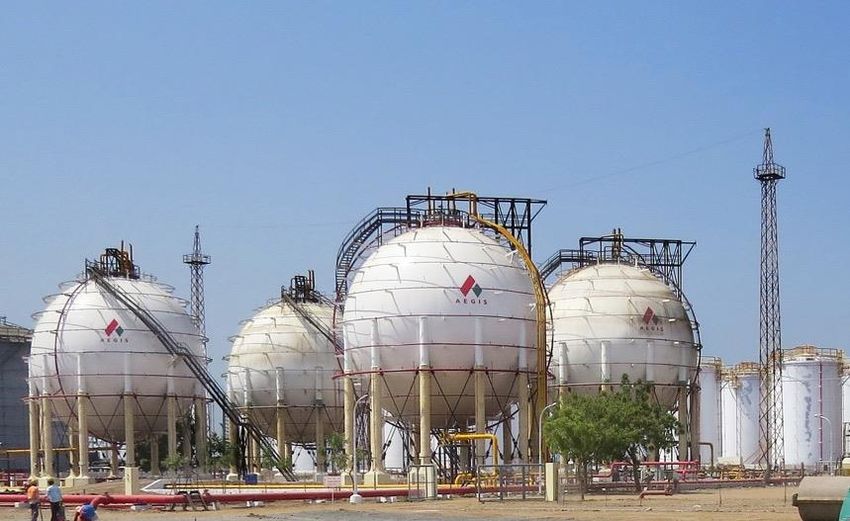
Gas Logistics
                5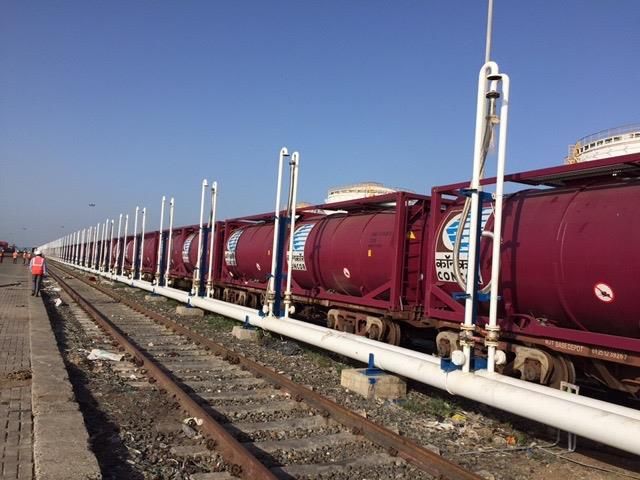
Gas Logistics - Capturing Complete Value Chain

       40%                             60%                                       Gas Distribution

                                                         Gas Logistics (3PL)
                                                              AND/OR
                   Gas Sourcing                            Sourcing Fees
                                                                                     Industrial

   Sourcing                         Shipping                  Terminalling           Auto Gas

Segment              Activity                   Revenue Stream
Gas Sourcing         Sourcing & Shipping        Sourcing Commission
                                                Throughput Fees, Handling &
Gas Logistics        Terminalling                                                   Commercial
                                                Value Addition Service Charges
                     Industrial, Commercial &
Gas Distribution                                Distribution Margin
                     Auto Gas

    Creating ‘Leading LPG Sourcing Player in India’ through Vertical Integration Strategy

                                                                                                    6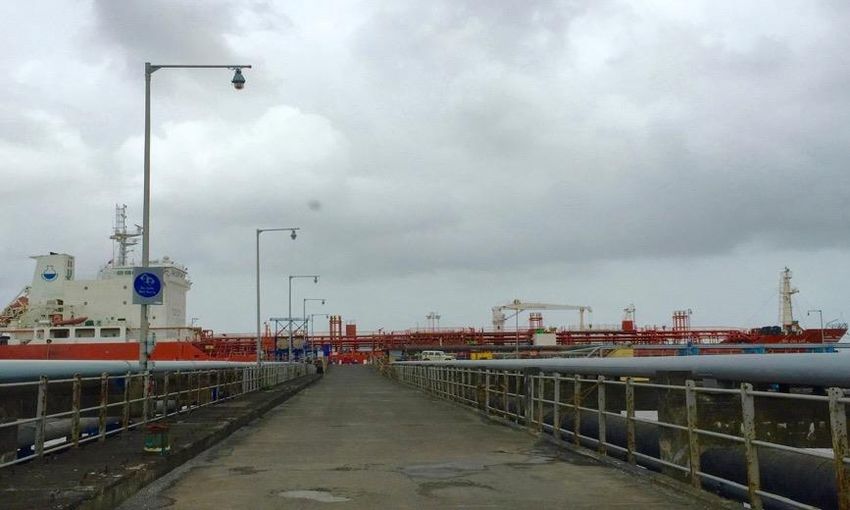
Demand Supply Gap exists for LPG in India...
             Consumption of LPG in India                            Imports of LPG in India
 ‘000 MT                                                ‘000 MT
                            +207%                                           CAGR 17%
                                              21,537                                          11,026

                                    14,331

                  10,456
                                                                                   4,484
    7,016
                                                                       2,883

                                                            853

   2000-01        2005-06           2010-11   2016-17     2000-01     2005-06     2010-11     2016-17

                               Incremental Demand in LPG met through Imports

•Source: PPAC
                                                                                                        7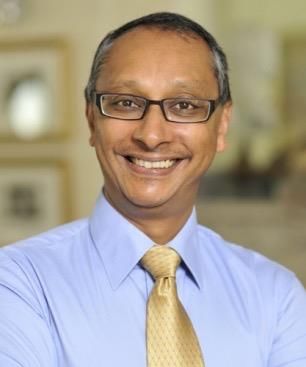
Metric

                                                             0
                                                                 5
                                                                     10
                                                                          15
                                                                                     Tons 20
                                                                                    Million 25
                                                                                                    30
                                                                                                         35
                                                                                                                   40
                                                  2004-05
                                                  2005-06
                                                  2006-07
                                                  2007-08
                                                  2008-09
                                                                                                                        Domestic Supply

                                                  2009-10
                                                  2010-11

    Source: PPAC/IOC and Management Estimates
                                                  2011-12
                                                  2012-13
                                                                                                                        Demand

                                                  2013-14
                                                  2014-15
                                                  2015-16
                                                2016-17(P)
                                                                          11

                                                  2017-18
                                                                                         21

                                                  2018-19
                                                  2019-20
                                                  2020-21
                                                  2021-22
                                                  2022-23
                                                  2023-24
                                                  2024-25
                                                  2025-26
                                                  2026-27
                                                  2027-28
                                                  2028-29
                                                  2029-30
                                                                                                                                          ...Increasing LPG imports will require new Terminal Capacity

                                                  2030-31
                                                                                          Imports

                                                  2031-32
                                                  2032-33
                                                  2033-34
                                                                               16
                                                                                                              36

                                                  2034-35
8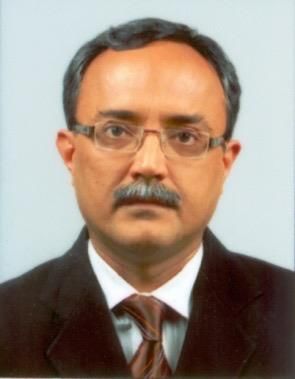
To Capitalize on this Opportunity

                                   Leading LPG Logistics Player in India

                                         JV with ITOCHU

✓   Efficient and Cost Effective
    Shipping for High Volumes                             Expansion -
                                                      Terminaling Capacity
✓   Strong Negotiating Power
                                                                             ✓   Growing LPG Market in India

✓   Financial Muscle
                                                                             ✓   Strong Customer Relationship

                                                                             ✓   Terminaling Capacity

                                                                                                                9
JV with ITOCHU
                           Aegis entered into a Joint Venture for its
                     Singapore based LPG Sourcing and Supply Business
                                             with
                         ITOCHU Petroleum Co., (Singapore) Pte Ltd
Aegis Logistics Limited sold 40% of its equity ownership in its wholly owned subsidiary, Aegis
 Group International Pte. Ltd. Singapore, to ITOCHU Petroleum Co., (Singapore) Pte Ltd., a
 wholly owned subsidiary of ITOCHU Corporation for a total consideration of $ 5.85 million

                                        Sold 40% in AGI               ITOCHU Petroleum Co.,
      Aegis Logistics Ltd
                                                                        (Singapore) Pte Ltd

                  60%       Aegis Group International Pte. Ltd (AGI)       40%
                                  Joint Venture to become a leading
                                     LPG sourcing player in India

                 Attaining Cost Leadership in the LPG import market
               Lowering the delivered price to most Competitive levels

                                                                                                 10
LPG Capacity Post Expansion
Static Capacity MT Throughput Capacity MT
63,300 5,000,000
Expansion in Haldia & Pipavav
Debottlenecking in Mumbai
25,000
2,500,000
28,100
25,400 18,300
5,400 8,100 1,400,000
1,300,000
750,000 6,00,000
20,000 20,000 20,000
250,000 1,100,000
5,00,000 7,00,000
2015-16 2016-17 2017-18 2015-16 2016-17 2017-18
Haldia Pipavav Mumbai
11Greenfield Capacity Expansion at Haldia
✓ Static Capacity
▪ 25,000 MT – 2 Fully Refrigerated Tanks of
12,500 MT each
▪ 24 carousel (Filling Points) bottling plant
✓ Throughput Capacity
▪ 2,500,000 MT at full utilization
Project Cost
✓ ▪ Rs 250 crs – LPG Terminal
West Bengal
▪ Rs. 25 crs – LPG Bottling Plant Haldia
✓ Means of Finance
▪ Internal Accruals
✓ Project Completed
Signed 20 years of MOU with
▪ Q3 FY17-18
a Large PSU as Anchor Customer
✓ Pipeline Connectivity
at the Current Market Throughput Rates
▪ Paradip -Durgapur Pipeline passes
through Haldia
Maps not to scale. All data, information, and maps are provided "as is" without warranty or any representation of accuracy, timeliness or completeness
12Debottlenecking of LPG Terminals at Mumbai
✓ Static Capacity to remain same
▪ 20,000 MT
✓ Throughput Capacity
▪ 1,100,000 MT (incremental 400,000 MT)
✓ Project Cost
▪ Rs 15 crs
✓ Means of Finance
▪ Internal Accruals
✓ Project Completed
Project Status:
▪ Q3 FY17-18
▪ Intake Pumps - Completed
✓ Pipeline Connectivity ▪ Internal Pipeline – Completed
▪ Uran – Chakan / Shikrapur LPG ▪ Connectivity of Mumbai Terminal to
Pipeline passes through Mumbai
Uran – Chakan Pipeline Grid – Completed
13Brownfield Capacity Expansion at Pipavav
✓ Static Capacity
▪ 10,200 MT
✓ Throughput Capacity
▪ ~800,000 MT at full utilization Gujarat
Pipavav
✓ Project Cost
▪ Rs 75 crs
✓ Means of Finance
▪ Internal Accruals
Throughput volumes for LPG handled in Pipavav
✓ Project Completed
expected to grow
▪ Q3 FY17-18
through
existing and new customer relationships
Maps not to scale. All data, information, and maps are provided "as is" without warranty or any representation of accuracy, timeliness or completeness
14Our Gas Distribution Network
B2C
▪ Auto Gas Retailing: Distribute LPG as Auto Fuel through Gas Station
Network
▪ 108 Auto Gas Stations across 7 States
B2B
▪ Bulk Industrial Distribution: Distribute LPG through road tankers to Auto,
Steel, Ceramic Industries etc
▪ Commercial LPG: Distribute Packed Cylinders for Commercial and
Industrial users
▪ 109 Commercial Distributors spread across 45 Cities in 8 states
15Gas Division Performance EBITDA*
Capacity Existing & New
Expansion Customer Relationships Sustainable Business
Rs. in Cr.
Average ~21 Average ~31 Average ~39 Average ~51
59
54
51
46
42
39 39
35 35
27 27 27
24
22
20
19
Q1FY15 Q2FY15 Q3FY15 Q4FY15 Q1FY16 Q2FY16 Q3FY16 Q4FY16 Q1FY17 Q2FY17 Q3FY17 Q4FY17 Q1FY18 Q2FY18 Q3FY18 Q4FY18
* Normalized EBITDA – Before Forex, Hedging Related Expenses
16LPG Volume - Logistics
‘000 MT
Average ~157 Average ~245 Average ~341 Average ~436
521
479
434
442
400
308 302
279
268
252
200 206
197
163
132 131
Q1FY15 Q2FY15 Q3FY15 Q4FY15 Q1FY16 Q2FY16 Q3FY16 Q4FY16 Q1FY17 Q2FY17 Q3FY17 Q4FY17 Q1FY18 Q2FY18 Q3FY18 Q4FY18
17LPG Volume - Distribution
‘000 MT
Average ~10 Average ~13 Average ~15 Average ~20
22
21
18 17
15 15 15
14
13 13 13
12
11 11
10 10
Q1FY15 Q2FY15 Q3FY15 Q4FY15 Q1FY16 Q2FY16 Q3FY16 Q4FY16 Q1FY17 Q2FY17 Q3FY17 Q4FY17 Q1FY18 Q2FY18 Q3FY18 Q4FY18
18Liquid Logistics
19Liquid Logistics and EPC Services
Liquid Logistics (3PL) O&M Services
Shipping Logistics O&M Facilities
Segment Activity Revenue Stream
Throughput Fees, Handling & Value
Liquid Logistics Logistics
Addition Charges
Operations &
O&M Services O&M Fees
Maintenance
20Liquid* Traffic at Indian Ports
POL Traffic Growth at Indian Ports POL Traffic at Major Ports*
mn MT
+38%
Others Haldia
376.7 3% 4% Paradip
Kandla
16%
27%
349.3 350.8 348.3
330.2 Visakhapatnam
325.3
7%
312.6
Chennai
272.0 Kochi 6%
Mumbai
16% 9%
JNPT
2% New
Mangalore
10%
FY09 FY10 FY11 FY12 FY13 FY14 FY15 FY16
(P)
Mumbai, Kochi, Haldia, Kandla and Mangalore handle ~70% of the traffic at Major Ports
Liquid – Excludes Chemicals
Source: Indian Ports Association
21
* During April – July 17Greenfield Liquid Terminal Expansion
Greenfield Liquid Terminal Expansion at Greenfield Liquid Terminal Expansion at
Kandla Port – 100,000 KL Mangalore Port – 25,000 KL
Kandla
Gujarat
Mangalore Karnataka
✓ Project Cost
✓ Project Cost
▪ Rs 75 crs ▪ Rs 18 crs
✓ Means of Finance ✓ Means of Finance
▪ Internal Accruals ▪ Internal Accruals
✓ Project Completion Date ✓ Project Completion Date
▪ FY17-18 ▪ H1 FY19
Maps not to scale. All data, information, and maps are provided "as is" without warranty or any representation of accuracy, timeliness or completeness
22Brownfield Liquid Terminal Expansion
Liquid Terminal Expansion at Haldia Port – 35,000 KL
West Bengal
Phase II Project Cost Means of Finance Project Completion Date
35,000 KL ▪ Rs 35 crs ▪ Internal Accruals ▪ H1 FY18 - 19
Maps not to scale. All data, information, and maps are provided "as is" without warranty or any representation of accuracy, timeliness or completeness
23Liquid Capacity Post Expansion
01 Mumbai
Built up of Capacities (‘000s KL)
✓ Existing – 273,000 KL 689
02 Kochi Existing
25
✓ Existing – 51,000 KL Expansion 100
03 Haldia
120
✓ Expansion – 35,000 KL 120
✓ Existing – 85,190 KL
85
04 Pipavav 35
✓ Existing – 120,120 KL
273 51
05 Kandla
✓ Expansion – 100,000 KL
06 Mangalore
Mumbai Kochi Haldia Pipavav Kandla Mangalore Total
✓ Expansion – 25,000 KL
Total Capacity post expansion at Kandla & Haldia : ~ 689,000 KL
24Liquid Division Performance
Revenue (Rs. In Cr.) Normalized EBITDA (Rs. In Cr.)
171 168 102 103
97
153 154 91
84
131
2013-14 2014-15 2015-16 2016-17 2017-18 2013-14 2014-15 2015-16 2016-17 2017-18
25We are leading provider of logistics and supply chain
services to India’s oil, gas and chemical industry
Strategic port locations Storage terminals
Rail connectivity Pipelines
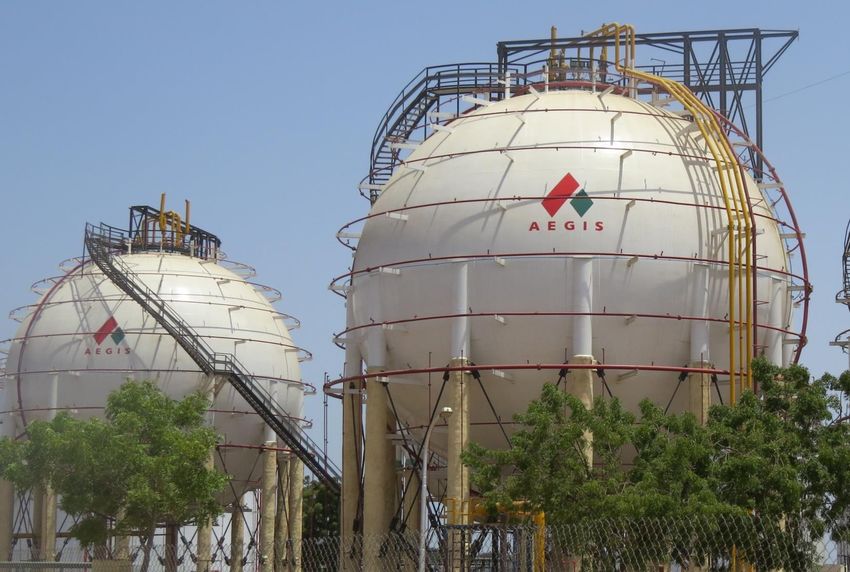
26Unique Infrastructure
Liquids LPG
▪ Terminals at key ports- Mumbai, Kochi, ▪ Refrigerated Gas Terminal in Mumbai
Haldia, Pipavav
▪ Pressurized Gas Terminal in Pipavav
▪ Jetty Pipelines ▪ Pipeline connectivity to Petchem plant
▪ Multiple tank sizes
▪ Network of 108 Autogas stations in 7 states
▪ Coated , Stainless Steel and Heated tanks
▪ Network of 109 commercial distributors in
▪ Road, Rail and Pipeline connectivity 8 states
▪ LPG Sourcing JV with Itochu in Singapore
Integrated Supply Chain Management
27Our Strategy : Building a Necklace of Terminals
around the coastline of India
✓ VLGC
▪ All Ports are Deep Water Ports
to accommodate VLGC
New
Location ✓ Pipelines
▪ Pipeline Facilities for Larger
Customers
Kandla
Pipavav Haldia ✓ Railways
▪ Railways available at Pipavav
Mumbai and can be set up at all ports
except Mumbai
Mangalore New
Location
✓ Roadways
Kochi ▪ Well developed Infrastructure to
enable connectivity to the
customers
Maps not to scale. All data, information, and maps are provided "as is" without warranty or any representation of accuracy, timeliness or completeness
28Strong Industry Partners
29Management Team
Raj Chandaria Anish Chandaria
Chairman & MD Vice Chairman & MD
Sudhir Malhotra Rajiv Chohan
Group President & COO President -Business Development
Murad Moledina K. S. Sawant
Chief Financial Officer President - Operations & Projects
30Financial Performance
Solid Foundations
31Consolidated Profitability Statement [IndAS]
Rs. In Cr. Q4 FY18 Q4 FY17 Y-o-Y % FY18 FY17 Y-o-Y %
Revenue 1,252 1,268 -1% 4,791 3,939 22%
Cost of Sales 1,131 1,172 4,355 3,567
Others 42 32 130 125
Normalized EBITDA (Segment) * 79 64 23% 306 247 24%
Finance, Hedging & Forex related
3 6 17 18
Expenses (Net)
Depreciation 12 6 32 24
Unallocated Expenses 6 10 32 33
Profit Before Tax 57 42 36% 225 173 30%
Tax 2 10 11 36
Profit after Tax 55 32 72% 214 136 57%
* Normalized EBITDA – Before Forex Hedging Related expenses
32Consolidated Balance Sheet [IndAS]
Rs. In Cr. Mar-18 Mar-17 Rs. In Cr. Mar-18 Mar-17
Non Current Assets Equity
Equity Share Capital 33 33
Property, Plant and Equipment 1,280 746
Other Equity 1,174 804
Capital Work in Progress 126 313 Equity Attributable to owners of the
Other Intangible Assets 1 1 1,207 837
Company
Goodwill 1 1 Non contolling Interest 70 29
Financial Assets Sub-total Equity 1,277 866
Other Investments 0 0
Liabilities
Others - Security Deposit 9 8 Non Current Liabilities
Current Tax Assets (Net) 15 13 Financial Liability
Deferred Tax Assets (Net) 65 41 Borrowings 62 77
Other Non Current Asset 90 70 Other financial liabilities 13 13
Other non-current liabilities 2 2
Sub-total Non Current Assets 1,587 1,192
Provisions 11 10
Total Non Current Liabilities 88 102
Current Assets
Inventories 26 22 Current Liabilities
Financial Liability
Financial Assets
Borrowings 220 177
Trade Receivalbes 347 706 Trade Payables 379 678
Cash and Cash Equivalents 95 15 Other financial liabilities 142 92
Bank Balance other than above 67 47 Provisions 3 1
Other Financial Assets 10 6 Current Tax Liabilities (Net) 7 10
Deferred Tax Assets (Net) 70 88
Other Current Assets 82 48
Other current Liabiliites 27 21
Total Current Assets 627 843 Total Current Liabilities 849 1,067
TOTAL - ASSETS 2,214 2,035 TOTAL EQUITIES AND LIABILITIES 2,214 2,035
33Profit & Dividend Track Record
Dividend
32% 35% 44% 34% 24% 32% 34% 25%
Payout
Rs. In Cr.
Dividend Paid Net Profit 198
120
113
103
61
47 50
36 41
34
22 21 25
15 15
8
FY 2011 FY 2012 FY 2013 FY 2014 FY 2015 FY 2016 FY 2017 FY 2018*
Board of Directors have recommended Final Dividend at 75% i.e. Re. 0.75 per share (FV of Re. 1 each)
* Includes Proposed dividend of Re. 0.75 per share
34For further information, please contact:
Company : Investor Relations Advisors :
Aegis Logistics Limited Strategic Growth Advisors Pvt. Ltd.
CIN: L63090GJ1956PLC001032 CIN: U74140MH2010PTC204285
Mr. Murad Moledina, CFO Ms. Payal Dave / Mr. Jigar Kavaiya
murad@aegisindia.com payal.dave@sgapl.net / jigar.kavaiya@sgapl.net
www.aegisindia.com www.sgapl.net
35You can also read