Dabur India Ltd INVESTOR PRESENTATION
←
→
Page content transcription
If your browser does not render page correctly, please read the page content below
INVESTOR PRESENTATION

    Dabur India Ltd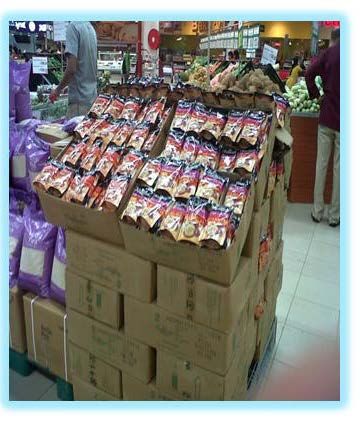
FMCG Sector Overview

•FMCG is the fourth largest sector in the Indian economy and has grown at an annual average of
11 per cent over the last decade

•The current size of the Indian FMCG Market is around USD 45 bn

•The urban segment is the largest contributor to the sector- accounting for two-thirds of total
revenue

•The sector is likely to touch sales of USD 100 bn by 2020

                                       India FMCG Industry
                                                                                             USD bn
                                                                                  103.7

                                                                 44.9     47.3
                                      30.2     34.8     36.8
            17.8    21.3     24.2

            2007    2008     2009     2010     2011     2012     2013   2015(E) 2020(E)
                                                                                             Source: IBEF
                                                                                                            1
FMCG Sector Recent Performance

                 FMCG Growth Rate
           Value Growth        Price growth        Volume growth
                                                             10.3%
                                                                           The FMCG Industry has started to
                                          8.0%
                                                                           show a pick up in demand
                      6.1%
  5.3%
       4.7%                                    4.5%          7.0%
                          4.6%
                                                                 3.3%
                          1.5%            3.5%
0.6%                                                                              Consumer Confidence Index
Q1'14-15            Q2'14-15            Q3'14-15            Q4'14-15

                                                                           #2    #1      #1       #1      #1
Source: AC Nielsen                                                                                        130
                                                                                                  129
                                                                                 128
                                                                                         126
  Inspite of the slowdown India has continued to
    occupy the top spot for the last 4 quarters as                        121
  per global consumer confidence index study by
                      Nielsen

                                                                        Q1CY14 Q2CY14 Q3CY14 Q4CY14 Q1CY15

                                                                                                                2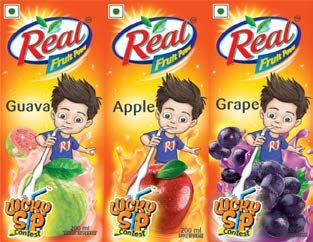
FMCG Growth Drivers

       FMCG Growth Drivers                                                                  Category Penetration *

                        Rising income
                            driving
                          purchases                                                                                         91%
                                                                           Toothpaste                            63%

                                                                                                                           84%
                                                                                Hair Oil                             72%

 Favourable                                            Growth of                                                     69%
demographics
                                                     Modern Trade            Shampoo                           56%
                                                     & Ecommerce

                                                                                                                                     Urban
                         Growth                                                                            45%
                                                                         Toilet Cleaner      12%                                     Rural
                         Drivers
                                                                                                21%
                                                                              Glucose        10%

                                                                                                 13%
                                                                          Toothpowder              22%
            Evolving                    Low penetration
           consumer                          and
            lifestyle                    Consumption                                        4%
                                                                      Branded Baby Oil     2%
                                                                                                         *Penetration Data pertains to FY12
                                                                                                         Source: IBEF

                                                                                                                                     3
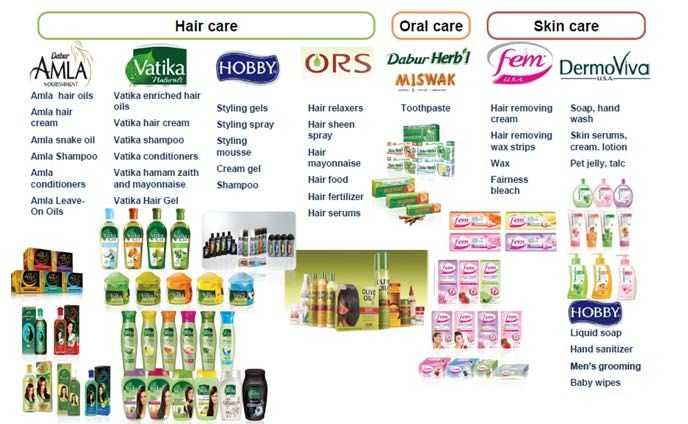
Dabur Overview

                                             Dabur Vatika B&B was
                                             awarded the Grand Prix Direct
                                             Award in the Goa Fest 2015.
 130 years of Trust and Excellence

 One of the fastest growing FMCG
            Companies

                                             Dabur ranked amongst the
 Dedicated to the Health and Well-
    Being of every household                 Top 5 Indian companies with
                                             the best Board of Directors
  World’s largest in Ayurveda and
        natural healthcare

    20 world class manufacturing
facilities catering to needs of diverse      Dabur ranked #1 in personal
                 markets                     care and #22 overall in the
                                             Top 50 brands by Millward
Strong overseas presence with 31%            Brown
 contribution to consolidated sales

                                                                       4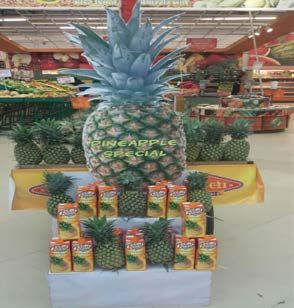
Key Milestones

       • Established by Dr SK Burman in Kolkata
1884

       • Came out with first public issue
1994

       • Inducted professional management
1998

       • Crossed the 1000 crs turnover mark
2000

       • Dabur acquired Balsara
2005

       • Acquired Fem Pharma
2008

       • Acquired Hobi and Namaste
2010

       • Dabur crosses billion dollar turnover mark
2012

                                                      5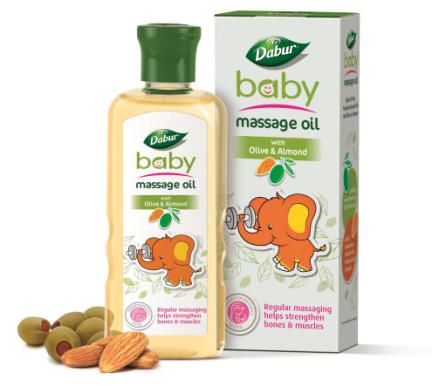
Global Business Footprint

                              UK
                                             Turkey

                                                                 Nepal
                                                       UAE
        U.S.                             Egypt

                                                                    B’Desh

                               Nigeria
                                                             Sri Lanka

Key markets
Manufacturing Facilities

                                                                             6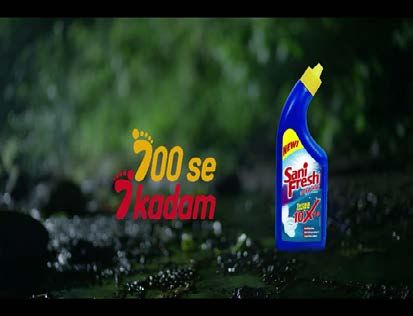
Domestic Distribution Structure

Total reach at 5.3 mn retail                                       Factory
outlets, one of the highest
among FMCG companies
                                                                   Depot            (Carry & Forward Agents)

 Stockists                                                        Super stockists                   Insti Stockists

                            Modern Trade
                              Stockist

                                                                  Sub stockists
     Wholesalers

                                                                    Rural trade
             Retail trade
                                                                                                    Insti customers

                                           Shoppers & Consumers

                                                                                                                      7
Dabur Performance Snapshot

                    Sales
in INR bn                                                                         Market Cap
                             70.7     78.1
                    61.5                                       in INR bn
            52.8
   40.8                                                                                               466.5

                                                                                            313.1
  FY11      FY12    FY13     FY14     FY15                                          238.9
                                                              167.2        185.4

            Profit After Tax
in INR bn
                                         10.7                 FY11         FY12      FY13      FY14   FY15
                                9.1
                       7.6
    5.7      6.4
                                                              Robust profitable growth translating
                                                              into superior shareholder returns

   FY11      FY12     FY13     FY14      FY15

                                                                                                          8
Business Structure

                                                                             Domestic FMCG
                                                                                 (66%)

                                                         Domestic (69%)

                                                                               Others (3%)

                            Dabur India
                                                                                 Organic
                               Ltd.                                           International
                                                                                  (22%)

                                                          International       Namaste Labs
                                                              (31%)              (6%)

                                                                             Hobi Group (3%)
 * Others include Retail, Commodity exports etc
Note: % figure in brackets indicate % share in Consolidated Sales for FY15

                                                                                               9
Sales By Business Vertical
Domestic FMCG Business FY15
Healthcare Health
Supplements
(33%) 18%
Foods
19% Digestives
Skin Care
Domestic 5% 6%
HPC(48%)
FMCG* Oral Care OTC &
14% Ethicals
Hair Care 9%
23%
Foods(19%) Home Care
6%
International Sales FY15
Europe
12%
Middle
International Business America East
16%
Region Wise Breakdown 32%
Asia
17% Africa
23%
* Breakdown of Domestic FMCG business basis FY15 Sales
10Continue to build bigger brands
INR 10bn+ INR 1bn+
14 brands with turnover of INR 1bn+ with 3 brands over 10bn
11International Business Overview
In INR Mn 24226
23108
Key Markets Middle South
18338 Africa
16161
East Asia
8992
Key Categories Hair Skin Oral
Care Care Care
FY11 FY12 FY13 FY14 FY15
•Comprises 31% of Consolidated Sales in FY15
•Localized supply chain network for efficient business operations
•Sustained investment in brands and innovation to grow the topline
•Business foray had been entirely organic since 1980’s, until FY2010-11 when we acquired Hobi Group and Namaste
Labs
12International- Competitive Position
Hair Cream* 36.4% 36.0%
35.2% No.1 Position in the Hair Cream
Category in KSA, UAE and
Egypt
KSA UAE Egypt
65.2% 65.7%
Hair Oils* No.1 Position in the Hair Oils
27.4%
Category in KSA & Egypt and
No.2 in UAE
KSA UAE Egypt
*Volume Market Share Mat 2014
13International Brand Architecture
14Growth Strategy
1.Continued Focus on
Innovation
2.Building Consumer Connect
3.Distribution Expansion
4.Focus on Health and well
being
151.Continued Focus on Innovation
16Recently launched
India
Dabur Baby
Keratex Hair Oil Massage Oil
Hajmola Chatpat Odomos Roll On
International
Vatika Oil Vatika Brillantine Dermoviva Face Vatika Argan
replenishment AD Mask Cream
17Product Evolution
Chyawanprash
Red
Toothpowder
Hajmola
Amla Hair Oil
182.Building Consumer Connect
19Advocacy Initiatives
Key Advocacy Initiatives across categories will continue to build consumer connect
•Mega comedy talent hunt which saw an overwhelming response from
people
•Auditions for this talent hunt was organised across various towns to
identify the best in stand-up comedy.
•Dil Se Dua and Walk to the Moon activations drew good response
from consumers
•Joining Prime Minister Narendra Modi’s call for his ‘Swachh Bharat
Mission’, a cleanliness drive took place across public conveniences of
Sulabh International using Sanifresh
20Digital Campaigns
Vatika Brave & Beautiful campaign Fem Star Face Contest Sanifresh -700 se 7 kadam
With a continued increase in the number of Internet users, Digital Media
being leveraged for brand building and consumer connect
213.Distribution Expansion
22Distribution Expansion
• Rolled out in FY13 to expand direct coverage in rural markets
• Direct Village coverage has increased from 14000 villages in FY11 to 44,000
Project Double villages in FY15
• We plan to increase the coverage to 50,000 villages in FY16 and 60,000 in FY17
• Aimed at leveraging the potential of Top 130 towns which contribute to 50% of
Project 50-50 urban consumption
• Segregating the grocery channel teams for wholesale & retail
• Initiative is in line with renewed focus on urban markets
• To enhance chemist coverage and provide further impetus to our Health Care
Project Core portfolio
• Direct Chemist Coverage is currently 213,000 villages
• Strategy is to increase coverage and range for better throughput
23Visibility Initiatives in Modern Trade
Hommade Hajmola Real
Vatika Red Toothpaste Gulabari
Key Initiatives in Modern Trade & E-Commerce enhancing product visibility and availability
234.Focus on Health and Well being
24Health & Well Being
Health & Well being - The underlying theme across the portfolio
• Ayurveda – Dabur’s core philosophy
• Pioneered extension of Ayurveda into personal care and OTC healthcare
Dabur Baby Massage Oil Focus on Ayurvedic Innovations in
Dabur Honey
Free of paraffin and parabens - OTC- No.1 in Women Healthcare
Weight Management Safe for babies Health Tonics Category
25Health & Well Being
Health & Well Being focus has been extended to HPC and Foods
Red Tooth Paste- Healthy Is
Focused on Ingredient Happy-
Effectiveness
Campaign theme
for Real Juices
Odomos
Protection from Dengue
Activ
Sanifresh- Toilet Cleaner Fiber based
To safeguard the health of the Juices for a
family by ensuring hygiene
healthy lifestyle
25Share Price Performance ,
Dividend & Shareholding
Share Holding Pattern As on 31st March 2015 Share Price Trend
Others
DII 6%
5%
FII
21%
Promoters
68%
Dividend History*
250% 250%
200% 200% 200%
175% 175% 175%
140% 150% 150%
130%
115%
FY03 FY04 FY05 FY06 FY07 FY08 FY09 FY10 FY11 FY12 FY13 FY14 FY15
*Bonus issue in FY07 & FY11
28Financial Highlights FY2014-15
Growth 10.7% 14.5% 16.6%
Sales EBITDA PAT
Rs. 7806 crs Rs. 1474 crs Rs. 1066 crs
26Margin Profile FY 2014-15
52.3% 18.9%
13.7%
51.8% 18.3%
13.0%
FY14 FY15 FY14 FY15 FY14 FY15
Gross Margin EBITDA Margin PAT Margin
55bps 63bps 70bps
27Consolidated P&L
DIL (Consolidated) P&L in Rs. million Q4FY15 Q4FY14 YoY (%) FY15 FY14 YoY (%)
Net Sales 19,448 17,640 10.2% 78,064 70,541 10.7%
Other Operating Income 49 54 208 212
Material Cost 9,059 8,581 5.6% 37,201 34,000 9.4%
% of Sales 46.6% 48.6% 47.7% 48.2%
Employee Costs 1,723 1,529 12.7% 6,896 6,077 13.5%
% of Sales 8.9% 8.7% 8.8% 8.6%
Ad Pro 2,654 2,284 16.2% 11,244 9,997 12.5%
% of Sales 13.6% 12.9% 14.4% 14.2%
Other Expenses 2,604 2,348 10.9% 9,768 9,081 7.6%
% of Sales 13.4% 13.3% 12.5% 12.9%
Other Non Operating Income 447 384 16.3% 1,581 1,281 23.4%
EBITDA 3,903 3,338 16.9% 14,744 12,879 14.5%
% of Sales 20.1% 18.9% 18.9% 18.3%
Interest Exp. and Fin. Charges 103 137 -24.8% 401 542 -25.9%
Depreciation & Amortization 282 263 7.0% 1,150 975 17.9%
Profit Before Tax (PBT) 3,519 2,937 19.8% 13,194 11,362 16.1%
Tax Expenses 670 582 15.1% 2,509 2,191 14.5%
PAT(Before extraordinary item) 2,849 2,355 20.9% 10,685 9,172 16.5%
% of Sales 14.6% 13.4% 13.7% 13.0%
Extraordinary Item 0 0 0 -7
PAT(After extraordinary Items) 2,849 2,355 21.0% 10,685 9,164 16.6%
Minority Interest - (Profit)/Loss 1 2 26 25
PAT (After Extra ordinary item &
2,848 2,353 21.0% 10,658 9,139 16.6%
Minority Int)
% of Sales 14.6% 13.3% 13.7% 13.0%
29Statement Of Assets & Liabilities
in Rs. million As at 31/03/2015) As at 31/03/2014)
 EQUITY AND LIABILITIES
1 Shareholders’ funds
(a) Share capital 1756.5 1743.8
(b) Reserves and surplus 31784.9 24815.8
Sub-total - Shareholders' funds 33541.4 26559.6
2. Minority interest 181.6 159.1
3. Non-current liabilities
(a) Long-term borrowings 2105.7 2604.0
(b) Deferred tax liabilities (net) 587.1 448.3
(c) Other long-term liabilities 1.2 0.0
(c) Long-term provisions 462.1 408.9
Sub-total - Non-current liabilities 3154.9 3461.2
4. Current liabilities
(a) Short-term borrowings 5229.9 4477.4
(b) Trade payables 10958.4 10965.3
(c )Other current liabilities 5436.4 4794.2
(d) Short-term provisions 2560.2 2703.2
Sub-total - Current liabilities 24184.9 22940.1
TOTAL - EQUITY AND LIABILITIES 61062.8 53120.0
B ASSETS
1. Non-current assets
(a) Fixed assets 13060.3 11672.1
(b) Goodwill on consolidation 6214.0 6214.0
(c) Non-current investments 14074.0 4926.4
(d) Long-term loans and advances 207.5 245.4
(e) Other non-current assets 201.3 180.7
Sub-total - Non-current assets 33757.1 23238.6
2 Current assets
(a) Current investments 4059.7 5838.3
(b) Inventories 9732.7 9725.1
(c) Trade receivables 7108.4 6753.0
(d) Cash and bank balances 2760.4 5193.8
(e) Short-term loans and advances 2788.7 1955.1
(f) Other current assets 855.8 416.1
Sub-total - Current assets 27305.7 29881.4
Total -Assets 61062.8 53120.0
30THANK YOU
You can also read