FOURTH QUARTER 2016 EARNINGS CALL - JEFF WOODBURY VICE PRESIDENT, INVESTOR RELATIONS & SECRETARY JANUARY 31, 2017 - EXXONMOBIL
←
→
Page content transcription
If your browser does not render page correctly, please read the page content below

Fourth Quarter 2016 Earnings Call
                                        Jeff Woodbury
        Vice President, Investor Relations & Secretary

                                    January 31, 2017
Cautionary Statement
    • Forward-Looking Statements. Statements of future events or conditions in this presentation or the subsequent
      discussion period are forward-looking statements. Actual future results, including financial and operating performance;
      demand growth and mix; ExxonMobil’s volume/production growth and mix; the amount and mix of capital
      expenditures; reported reserves; resource additions and recoveries; finding and development costs; project plans,
      timing, costs, and capacities; drilling programs; product sales and mix; dividend and share purchase levels; cash and
      debt balances; asset valuations; corporate and financing expenses; and the impact of technology could differ materially
      due to a number of factors. These include changes in oil or gas prices or other market conditions affecting the oil, gas,
      and petrochemical industries; the occurrence and duration of economic recessions; reservoir performance; the
      outcome and timeliness of exploration and development projects; war and other political or security disturbances;
      changes in law or government regulation, including sanctions as well as tax and environmental regulations; the
      outcome of commercial negotiations; the impact of fiscal and commercial terms; opportunities for investments or
      divestments that may arise; the actions of competitors and customers; unexpected technological developments;
      unforeseen technical difficulties; and other factors discussed here and under the heading "Factors Affecting Future
      Results" in the Investors section of our Web site at exxonmobil.com. The closing of announced acquisition transactions
      is subject to satisfaction of conditions to closing provided under the applicable agreement. Forward-looking
      statements are based on management’s knowledge and reasonable expectations on the date hereof, and we assume
      no duty to update these statements as of any future date.
    • Frequently Used Terms. References to resources, the resource base, barrels of oil, volumes of gas, liquids, condensate,
      and similar terms include quantities that are not yet classified as proved reserves under SEC definitions but that we
      believe will likely be developed and moved into the proved reserves category in the future. Shareholder distributions
      referred to in this presentation mean cash dividends plus any shares purchased to reduce shares outstanding (excluding
      anti-dilutive purchases). For definitions and more information regarding resources, reserves, cash flow from operations
      and asset sales, free cash flow, earnings excluding impairment charge, operating costs, and other terms used in this
      presentation, see the "Frequently Used Terms" posted on the Investors section of our Web site and the additional
      information in this presentation and the earnings release 8-K filed today. The Financial and Operating Review on our
      Web site also shows ExxonMobil's net interest in specific projects.
    • The term ‘project’ as used in this presentation can refer to a variety of different activities and does not necessarily have
      the same meaning as in any government payment transparency reports.
2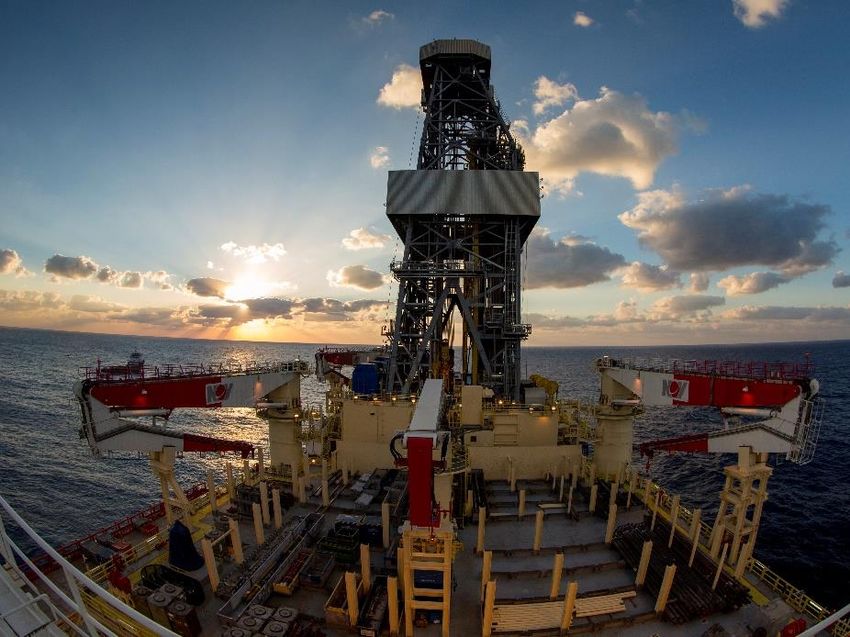
Headlines
    Full-year earnings of $7.8 billion; fourth quarter earnings of $1.7 billion

    ■ Fourth quarter cash flow from operations and asset sales more than covered
      dividends and net investments

    ■ Increasing Upstream contribution with growth in commodity prices, offset by
      $2 billion impairment charge

    ■ Integrated results underpinned by continued solid Downstream and Chemical
      performance

    ■ Progressing strategic investments across all segments

3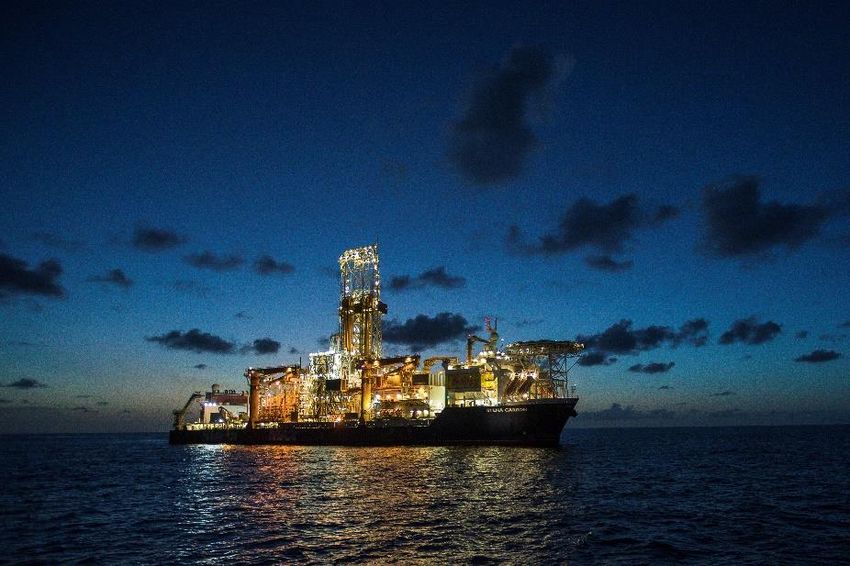
Business Environment
    Modest global economic growth continued in the fourth quarter

    Brent
    $ per Barrel                        ■ Expansion moderated in the U.S.
    125
                                        ■ Growth in China stabilized
    100
                                        ■ Tepid growth in Europe and Japan
     75
                                        ■ Crude oil and natural gas prices strengthened
     50

                                        ■ Refining margins improved outside
     25                                   the U.S.

       0                                ■ Chemical product margins decreased

4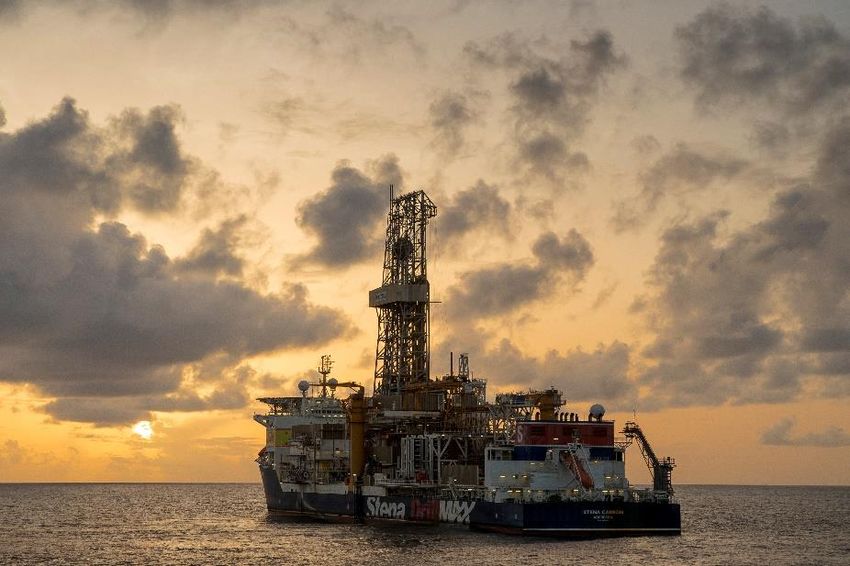
4Q16 Financial Results

                     Earnings                                         1.7

                     Earnings Per Share – Diluted (dollars)           0.41

                     Shareholder Distributions                        3.1

                     CAPEX                                            4.8

                     Cash Flow from Operations and Asset Sales1       9.5

                     Cash                                             3.7

                     Debt                                             42.8
                     Billions of dollars unless specified otherwise
    1
        Includes Proceeds Associated with Asset Sales of $2.1B

5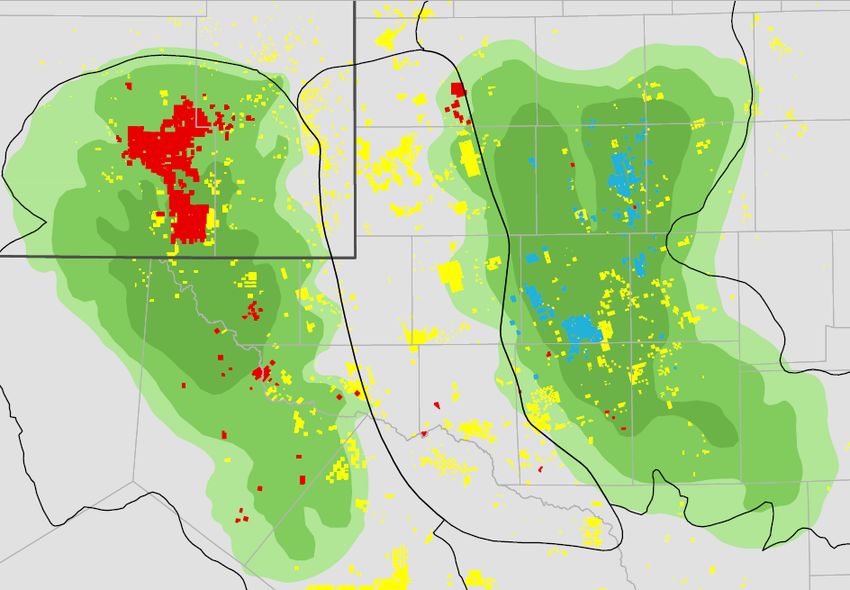
4Q16 Sources and Uses of Cash
    Cash balances decreased $1.4 billion in the quarter

                      Beginning Cash                                               5.1
                           Earnings                                                1.7
                           Depreciation                                            8.1
                                                                                           9.5
                           Working Capital / Other                                 (2.4)
                           Proceeds Associated with Asset Sales                    2.1
                           Shareholder Distributions                               (3.1)
                           PP&E Adds / Investments and Advances1                   (3.8)
                           Debt / Other Financing                                  (4.0)
                      Ending Cash                                                  3.7
                      Billions of dollars

    1
        Includes PP&E Adds of ($3.9B) and net investments and advances of $0.1B.

6
Total Earnings – 4Q16 vs. 4Q15
Earnings decreased $1.1 billion due to the Upstream impairment charge,
offset by stronger Upstream results
Millions of Dollars
528 (2,027)
2,780
600 1,680
(110) (91)
4Q15 U/S U/S Impairment 1 D/S Chem C&F 4Q16
1
Impairment charge resulting from fourth quarter 2016 Upstream asset recoverability assessment
7Total Earnings – 4Q16 vs. 3Q16
Earnings decreased $970 million as a result of the Upstream impairment
charge, partly offset by stronger Upstream results
Millions of Dollars
765 (2,027)
2,650
579 1,680
12 (299)
3Q16 U/S U/S Impairment D/S Chem C&F 4Q16
8Upstream
Earnings – 4Q16 vs. 4Q15
Earnings decreased $1.5 billion due to the impairment charge, partly offset
by higher realizations and lower operating expenses
Millions of Dollars
510 (50) 70 1,385 (2,027)
857
(642)
4Q15 Realization Vol/Mix Other 4Q16 Ex Impairment 4Q16
Impairment
9Upstream
Volumes – 4Q16 vs. 4Q15
Volumes down 3%: Liquids -97 kbd, natural gas -179 mcfd
koebd
4,248 (83) (22) (22) 4,121
Price, Spend, Liquids: -25
& Other: -94
Gas: +3
Net Interest: +11
4Q15 Entitlements Divestments Growth/Other 4Q16
10Upstream
Earnings – 4Q16 vs. 3Q16
Earnings decreased $1.3 billion as higher realizations and volumes were
offset by the impairment charge
Millions of Dollars
90 1,385 (2,027)
230
450
620
(642)
3Q16 Realization Vol/Mix Other 4Q16 Ex Impairment 4Q16
Impairment
11Upstream
Volumes – 4Q16 vs. 3Q16
Volumes up 8%: Liquids +173 kbd, natural gas +823 mcfd
koebd
242 4,121
3,811 69 (1)
Price, Spend, Liquids: +146
& Other: +70 Gas: +96
Net Interest: -1
3Q16 Entitlements Divestments Growth/Other 4Q16
12Downstream
Earnings – 4Q16 vs. 4Q15
Earnings decreased $110 million due to weaker margins partially offset by
favorable volume mix and asset management gains
Millions of Dollars
1,351 (570)
260 1,241
200
4Q15 Margin Vol/Mix Other 4Q16
13Downstream
Earnings – 4Q16 vs. 3Q16
Earnings essentially flat
Millions of Dollars
100 (250)
160
1,229 1,241
3Q16 Margin Vol/Mix Other 4Q16
14Chemical
Earnings – 4Q16 vs. 4Q15
Earnings decreased $91 million on lower volumes and mix, and unfavorable
inventory and foreign exchange effects
Millions of Dollars
963 (10) (30) (50) 872
4Q15 Margin Vol/Mix Other 4Q16
15Chemical
Earnings – 4Q16 vs. 3Q16
Earnings down $299 million reflecting weaker margins and unfavorable
inventory and foreign exchange effects
Millions of Dollars
1,171 (200)
50 (150)
872
3Q16 Margin Vol/Mix Other 4Q16
162016 Financial Results
Earnings 7.8
Earnings Per Share – Diluted (dollars) 1.88
Shareholder Distributions 12.5
CAPEX 19.3
Cash Flow from Operations and Asset Sales1 26.4
Cash 3.7
Debt 42.8
Billions of dollars unless specified otherwise
1
Includes Proceeds Associated with Asset Sales of $4.3B
172016 Sources and Uses of Cash
Cash balances flat in 2016
Beginning Cash 3.7
Earnings 7.8
Depreciation 22.3
26.4
Working Capital / Other (8.0)
Proceeds Associated with Asset Sales 4.3
Shareholder Distributions (12.5)
PP&E Adds / Investments and Advances1 (16.7)
Debt / Other Financing 2.8
Ending Cash 3.7
Billions of dollars
1
Includes PP&E Adds of ($16.2B) and net investments and advances of ($0.5B).
182016 Sources and Uses of Cash
Integrated cash flow supports distributions and funds investments
$B
30
Debt & Other $2.8B
Financing ■ Financial flexibility to invest through cycle
25
Asset Sales $4.3B
PP&E Adds /
20 Investments and $16.7B ■ 2016 Dividends per share up 3.5% vs. 2015
Advances 2
Cash Flow
15
From $22.1B
■ $9.7B of Free Cash Flow1
Operations
10
Shareholder ■ Anticipate 2017 CAPEX of about $22B
Shareholder
Distributions $12.5B
5
Distributions
0
Sources of Cash Uses of Cash
1
Calculated as Cash Flow from Operations and Asset Sales $26.4B less PP&E Adds / Investments and Advances ($16.7B)
2
Includes PP&E Adds of ($16.2B) and net investments and advances of ($0.5B)
19Total Earnings – 2016 vs. 2015
Earnings down $8.3 billion, reflecting the impact of lower commodity prices
Millions of Dollars
16,150 (4,878)
(2,027)
(2,356)
754 7,840
197
2015 U/S U/S Impairment D/S Chem C&F 2016
20Upstream
Earnings – 2016 vs. 2015
Earnings decreased $6.9 billion as a result of significantly lower realizations
and the impairment charge
7,101 (5,320) Millions of Dollars
310 2,223 (2,027)
130
196
2015 Realization Vol/Mix Other 2016 Impairment 2016
Ex Impairment
21Upstream
Volumes – 2016 vs. 2015
Volumes down 1%: Liquids +20 kbd, natural gas -388 mcfd
koebd
4,097 (14) (34) 4 4,053
Liquids: +38
Price, Spend,
& Other: -23 Gas: -34
Net Interest: +9
2015 Entitlements Divestments Growth/Other 2016
22Downstream
Earnings – 2016 vs. 2015
Earnings decreased $2.4 billion as a result of weaker margins, partially offset
by improved volume mix and asset management gains
Millions of Dollars
6,557 (3,840)
920 4,201
560
2015 Margin Vol/Mix Other 2016
23Chemical
Earnings – 2016 vs. 2015
Earnings increased $197 million due to stronger commodities margins and
higher sales, offset by the absence of asset management gains
Millions of Dollars
440 100 (340)
4,418 4,615
2015 Margin Vol/Mix Other 2016
242016 Projects Update
Adding significant production capacity to create long-term value
■ Five major project start-ups added
250 KOEBD of working interest capacity
• Kashagan and Gorgon Train 2 continue to
ramp up
■ Five major project start-ups planned in
2017-2018
• Hebron
• Sakhalin-1 Odoptu Stage 2
• Upper Zakum 750
Maersk Viking drill ship; Julia field (2016 start-up)
• Kaombo Split Hub
• Barzan
252016 Exploration Update
Successful exploration program enhances the portfolio
■ Continued progress in Guyana
• Liza development plan submitted
following successful Liza-3 appraisal
• Payara discovery
■ Owowo-3 discovery in Nigeria deep water
■ PNG Muruk discovery adjacent to Hides field
■ New high-potential exploration blocks
offshore Mexico, Cyprus, and PNG
Stena Carron drillship offshore Guyana
26U.S. Unconventional Portfolio
Strong acreage position with 700 KOEBD net production1 and growth potential
XTO Liquids Production1 (net KBD)
Bakken 300
250 11% CAGR
Uinta/Piceance
200
Raton Utica/Marcellus
San Juan Ardmore/Marietta
150
Barnett Fayetteville
Permian
100
Haynesville
Eagle Ford
50
Unconventional Basins
Freestone
Gas-prone
-
Oil-prone
2010 2011 2012 2013 2014 2015 2016
1
Includes XTO conventional production
27Growing Permian Acreage Position
Material acquisition adds high-quality acreage in the Delaware Basin
■ Acquisition includes 250K net acres in
the Permian
Midland
Basin
Central
■ Strategic fit with existing Permian position
NM
TX
Basin • $5.6B in ExxonMobil stock
Delaware Platform
Basin • Up to $1B contingent cash payment
■ Adds more than 3.4 BOEB resource
■ Positioned for significant production growth
Hydrocarbon density map for tight oil plays • Increases Permian drillwell inventory to
more than 4,500 wells1
1Drillwell inventory with at least 10% rate of return at $40/bbl flat real WTI oil price
28Downstream & Chemical
Strengthening the Portfolio
Growing value with integrated investments
■ Commissioned state-of-the-art synthetic
aviation lubricants facility in Louisiana
Advantaged Enhanced Integrated Optimized
feed logistics manufacturing marketing ■ Continued highgrading the portfolio
■ Pipeline joint venture expands access to
Baton Rouge
Mont Belvieu Beaumont
domestic crude oils
Baytown
■ Phased start-up of Baytown and Mont
Belvieu chemical expansions in 2H17
■ Beaumont polyethylene plant expansion FID
U.S. Gulf Coast investments across the value chain
29Summary
Sustained focus on value
Billions of dollars
unless specified otherwise
2016 Highlights
Earnings 7.8 ■ Focus on business fundamentals
Upstream Production (MOEBD) 4.1
■ Capital and cost discipline
CAPEX 19.3
Cash Flow from Operations ■ Positive Free Cash Flow2
1 26.4
and Asset Sales
2
Free Cash Flow 9.7 ■ Reliable, growing dividend
Shareholder Distributions 12.5
1
Includes Proceeds Associated with Asset Sales of $4.3B
2
Calculated as Cash Flow from Operations and Asset Sales $26.4B less PP&E Adds / Investments and
30 Advances ($16.7B)Questions
You can also read