Available online www.jsaer.com Journal of Scientific and Engineering Research, 2018, 5(7):90-95
←
→
Page content transcription
If your browser does not render page correctly, please read the page content below
Available online www.jsaer.com

              Journal of Scientific and Engineering Research, 2018, 5(7):90-95

                                                                                            ISSN: 2394-2630
                                                      Research Article                    CODEN(USA): JSERBR

Adsorption of Cadmium from Aqueous Solution using Agricultural Wastes Based
Activated Carbon

S.C. Mamah1, M. Iteguide2, J.I. Amanjide1
1
  Chemical/Petroleum Engineering Department, Faculty of Engineering and Technology, Federal
University Ndufu –Alike Ikwo, Ebonyi State, Nigeria.
2
  Industrial Safety and Environmental Technology Department, Petroleum Training Institute Effurun,
Delta State, Nigeria
Abstract Adsorption of heavy metal is a new technology for treatment of wastewater containing different types
of selected heavy metals. Adsorbents were made out of sugarcane bagasse, guinea corn shaft, rice husk and corn
cobs, available as agricultural wastes at controlled pH and contact time. The ability of the activated carbon
prepared from these selected agricultural wastes to remove metal ion from aqueous solution has been carried out
as a function of contact time, pH and concentration. An amount of 1g of the adsorbent each for sugarcane
bagasse, guinea corn shaft, rice husk, and corn cobs was used to derive % adsorptions are 45%, 84%, 62% and
76% respectively. Results showed that pH 5 was the minimum content for the adsorption of cadmium ion (Cd 2+)
at ambient temperature. Therefore, it is concluded that activated carbon prepared from these selected
agricultural wastes have the potential of removing cadmium ion (Cd2+) under experimental condition. The
percentage adsorption in order of increase is sugarcane bagasse < rice husk < corn cobs < guinea corn shaft.

Keywords Adsorption, Cadmium, Concentration, Contact time, pH
Introduction
Adsorption is a process whereby a solid is used for removing a soluble substance from water. In this process
active carbon is a solid, activated carbon is produced specifically so as to achieve a very big internal surface
between 500 – 1500m2/g [1]. This big internal surface makes activated carbon ideal for adsorption. If in a solid
substance, the molecules or ions in the surface of the crystal do not have all their faces satisfied by union with
other particles, they tends to satisfy their residual forces by attracting into and retaining on their surfaces gases
or dissolved substances with which they come in contact. The substance thus attracted to the surface is called the
“absorbate” while the substance to which it is attracted is called “adsorbent”.
Cadmium is highly toxic non-essential metal which accumulates in kidney dysfunction [2]. Cadmium
epidemiological studies have revealed that it may contribute to some forms of cancer in humans and low
exposures may result in kidney damage [3]. Cadmium is widely distributed in the environment as a result of the
use of galvanizing, pigments, stabilizers, thermoplastics, batteries and alloys. Moreover, the absence of the
direct control from environmental protection agencies on above industries has increased the size of the problem.
Cadmium is responsible for serious damage to the health of humans. “Tai – Tai”, a disease characterized by
excruciating pain in the bone [4]. The harmful effects of cadmium include a number of acute and chronic
disorders, such as renal damage, emphysema, hypertension and testicular entrophy [5]. Cadmium toxicity
contributes to a large number of health conditions, including the major killer disease such as heart disease,
cancer and diabetes, Cadmium concentration in the kidney, liver and various other organs is considered more
toxic than either lead or mercury. It is toxic at level one tenth that of lead, mercury, aluminum or nickel [6].

     Journal of Scientific and Engineering Research

                                                                                                                  90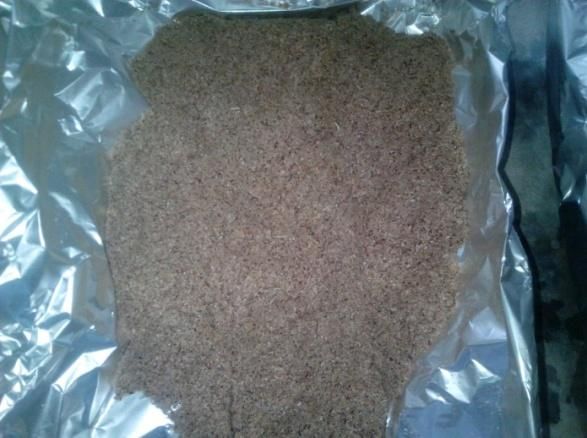
Mamah SC et al                              Journal of Scientific and Engineering Research, 2018, 5(7):90-95

Adsorption is the user friendly technique for the removal of heavy metal. This process seems to be the most
versatile and effective method for removal of heavy metal. This process is being widely used by various
researchers for the removal of heavy metals like cadmium from waste streams. It has been established that a
serious health hazard result from dissolved heavy metals escaping into the environment. They tend to
accumulate through the food chain in living tissues multiplying their effects in human body. Different methods
have been used to remove heavy metals from wastewater such as chemical precipitation, adsorption with new
adsorbents, membrane filtration, eletrodialysis, photocatalysis. Among them adsorption was found to be the
most commonly used method for eliminating these contaminants, especially at low concentrations.

Methodology
The selected agricultural wastes include rice husk, corn cobs, sugarcane bagasse and guinea corn shaft. They
were dried, grinded and stored. 1000mg/l cadmium solution as stock solution was prepared. The parameters that
were studied are: contact time, pH and concentration of adsorbent. The cadmium content was analyzed using
atomic absorption spectrophotometer (AAS).

Equipment and Chemicals Used
The equipment/apparatus and chemical reagents used for this research work are listed in the tables below:
List of Apparatus Used
                               Materials                     Sources
                               Measuring cylinder            Pyrex glass
                               Separating funnel             Pyrex glass
                               Breakers                      Pyrex glass
                               Volumetric flask              Pyrex glass
                               Stirring rod
                               Fitter paper                  Whatman No.42
                               Spatula                       Stainless steel
                               Wash bottle
                               Knife                         Stainless steel
                               Wash glass                    Pyrex glass
                               Wooden mortar and pestle
                               Sieve (0.5mm)                 Tyler 28 mesh
                               Micropipette                  Pyrex glass

List of Reagents Used
                               Materials                          Sources
                               Cadmium sulfate salt               BHD England
                               Aqueous ammonium chloride          BHD England
                               Conc. Hydrochloric acid            BHD England
                               De – ionize water                  Laboratory
                               Conc. Nitric acid                  BHD England
                               Conc. Hydrogen fluoride            BHD England
                               Conc. Tetraoxosulphate (iv) acid   BHD England

List of Equipment Used
       Materials                                      Sources
       pH meter                                       Pcstestr 35, Singapore
       Digital weighing balance                       Vibra AJ – 3200E, Japan
       Shaker                                         Stuart (SSLl)
       Oven                                           Carbonate 5336RB Ax 30, England.
       Blender                                        5B, 242, 220v/240v, 50/60H2, 200w Sayona, China
       Furnace                                        Carbolite RWF 1200/RWF, England
       Hot plate                                      Fisher scientific FB 68921
       Bunsen burner
       Atomic absorption spectrophotometer (AAS)      Varian spectr AA 220.

     Journal of Scientific and Engineering Research

                                                                                                            91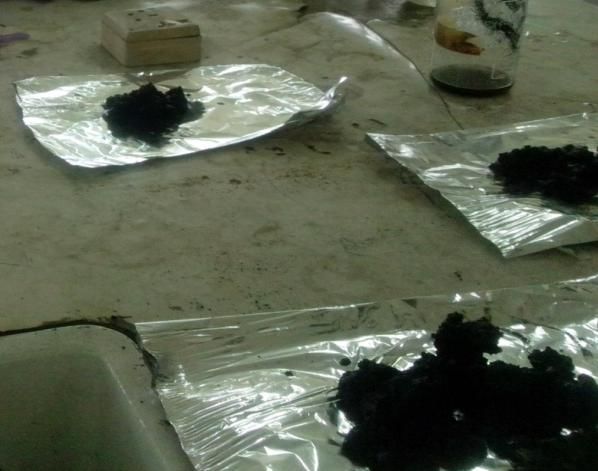
Mamah SC et al Journal of Scientific and Engineering Research, 2018, 5(7):90-95
Sampling
The agricultural wastes collected are rice husk, corn cobs, sugarcane Bagasse and guinea corn shaft. The rice
husk was collected from a rice mill in Abakalili, Ebonyi state and guinea corn shaft was obtained from a rice
mill at Dawanu market, Kano State, while the corn cobs and sugarcane baggases were gotten from Mokwa axis
of Niger state.
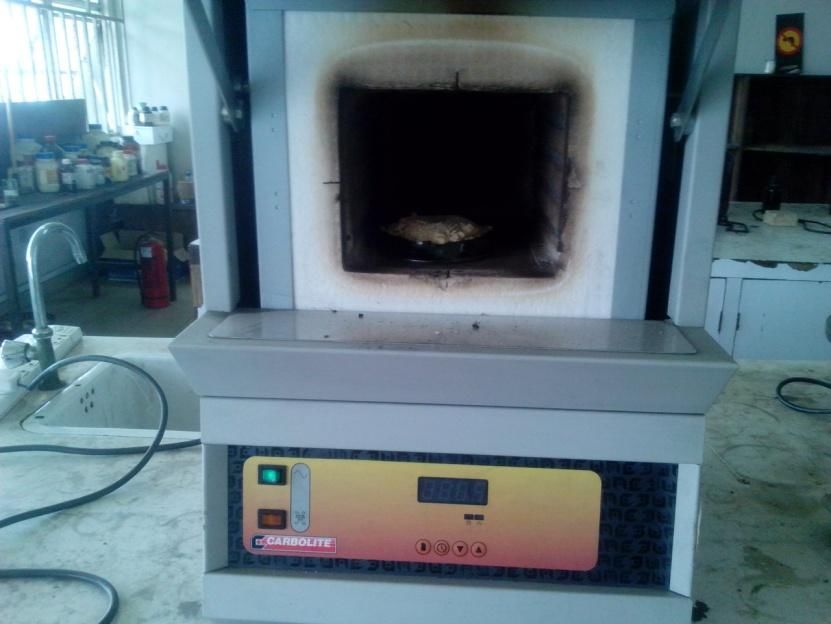
Sample Preparation
The various agricultural wastes were washed thoroughly. The water content of the sugarcane Bagasse was
extracted by pounding and pressing to remove the water content. The rice husk, sugarcane Bagasse, guinea corn
shaft and corn cobs were later dried under the sun for 8hrs. The samples were then ground to fine particle
powder of 0.5mm.
Ground Sugar cane baggase Ground Guinea corn shaft
Ground Rice husk Ground Corn cob
Carbonization process
Journal of Scientific and Engineering Research
92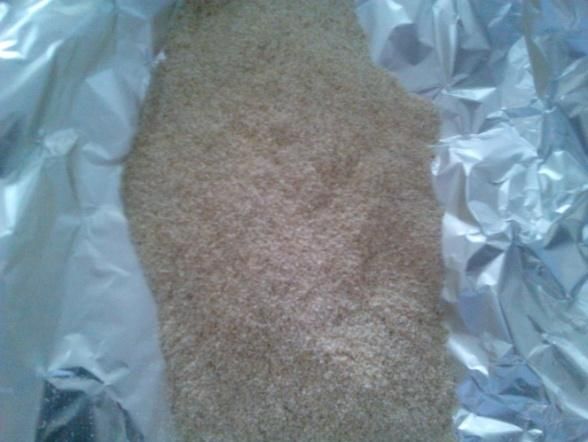
Mamah SC et al                              Journal of Scientific and Engineering Research, 2018, 5(7):90-95

                Wet activated carbon                                       Absorption process

Treatment of Sample with Chemicals/Carbonization
The finely ground samples were mixed with an aqueous solution of ammonium chloride (NH 4Cl) in a beaker
separately and was boiled in a hot plate for 3hrs. The boiled samples were dried in an oven for 6hrs at a
temperature of 100oC.
The dried samples were then carbonized in mini – furnace (carbolite RWF, 1200) at the temperature of between
450 – 500oC for 45 minutes separately. The samples were washed with de – ionized water to remove the
acid.The activated carbon obtained for each of the samples was left in an oven over – night at the temperature of
100oC.

Preparation of Stock Solution of Cadmium Ion
In the preparation of the stock solution of cadmium ion (Cd 2+). A mass of 4.14g was weighted from salt of
3CdSO4.8H2O using a digital weighing machine. The weighed mass of the salt was transferred into 1000ml
volumetric flask and added up with de – ionized water to the required mark. This gave a stock solution of
1000ppm cadmium ion (Cd2+).

Adsorption Process
A given mass of 1.0g of the active carbon of the samples were weighted separately into each beaker containing
100ml of cadmium ion (Cd2+) solution. The adsorption process was carried out to study the concentration
absorbed at constant contact time of 30 minutes at various pH of 4.0, 4.5, 5.0. 5.5 and 6.0.
Also at a constant pH4 for various contact time at 30, 40, 30, 50, 60, and 70 minutes.
Before mixing the adsorbent, the pH of each test solution was adjusted to the required value with Hydrochloric
acid solution.

Filtrate Solution
The solution mixture of the different adsorbent of cadmium ion (Cd 2+) concentration were mechanically agitated
and was filtered using the filter paper (Whatman No. 42) to remove the adsorbent from the solution mixture.
The various filtrate solution of the cadmium ion (Cd 2+) was stored in different beaker and labeled.

Digestion Process (Extraction)
Digestion involved the use of chemical and heat to breakdown substances into component that can be analyzed.
20ml of the sample was measured in a beaker, then conc. HClO 4, conc. HNO3 and conc. HF was added in the
ratio of (1.3:1) to the sample under a fume hood. It was then covered with a watch glass. It was placed on the
hot plate to evaporate it near dryness until a dense white fume appear, finally it was heated strongly (medium to
high heat) for half a minute.
It was allowed to cool then the solution was filtered into a 100ml pyrex volumetric flask. The 100ml volumetric
flask was then made up with distilled water to the mark. It was then filter with filter paper.

     Journal of Scientific and Engineering Research

                                                                                                              93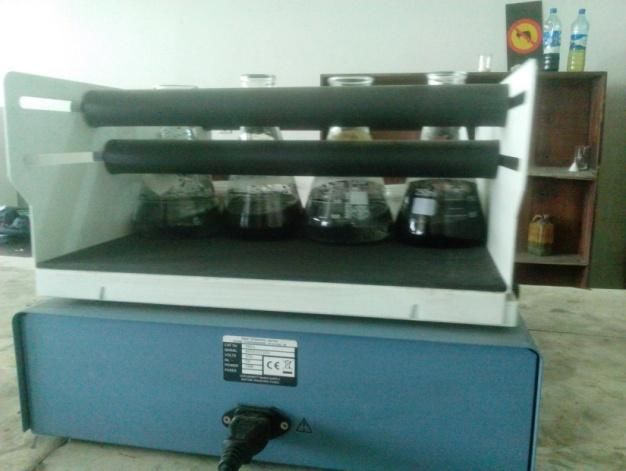
Mamah SC et al                                         Journal of Scientific and Engineering Research, 2018, 5(7):90-95

The filtrate extract and the standard solution were aspirated into the air – acetylene flame of Varian 220 (fast
sequential) atomic absorption spectrometer for the Cd ion metal concentration.

Result and Discussion
The results of this analysis are presented in the figures and tables below:

Result of Analysis

                       300

                       250

                       200
                                                                                                                   Guinea Corn shaft
        % Adsorption

                                                                                                                  Series4
          Axis Title

                                                                                                                   Corn cobs
                                                                                                                  Series3
                       150
                                                                                                                   Rice husk
                                                                                                                  Series2
                       100                                                                                         Sugar cane Bagase
                                                                                                                  Series1

                       50
Graph

                         0
                                  4             4.5               5              5.5              6
Showing Percentage of Cadmium at various pH.
          400                                                         pH

          350

          300
% Adsorption

          250                                                                                                    Guinea
                                                                                                                  Series4Corn shaft
                                                                                                                 Corn cobs
                                                                                                                  Series3
          200
                                                                                                                 Rice husk
                                                                                                                  Series2
                                                                                                                 Sugar cane Bagase
                                                                                                                  Series1
          150

          100

               50
                             30            40               50            60                70
                  0                                   Contact Time (Mins)
Graph Showing Percentage of Cadmium at various Contact time.

                 Journal of Scientific and Engineering Research

                                                                                                                    94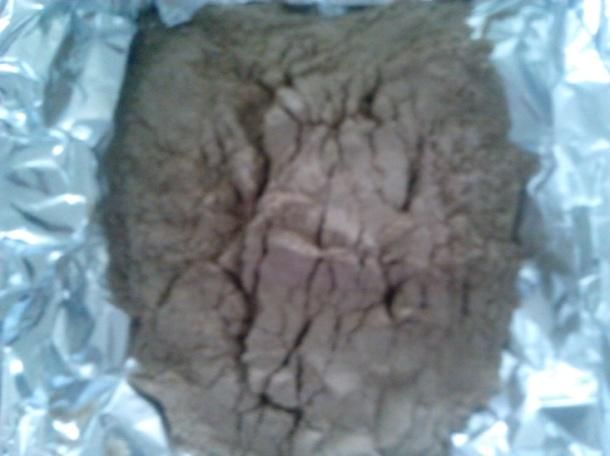
Mamah SC et al                             Journal of Scientific and Engineering Research, 2018, 5(7):90-95

The Result of Percentage of Cd at Various pH with Contact Time of 30 minutes
       pH@ Contact Time Sugarcane Bagasse Guinea Corn Shaft Rice Husk                    Corn Cobs
       of 30mins
       pH values             % absorbed           % absorbed          % absorbed         % absorbed
       4.0                   45.79                84.14               61.57              76.38
       4.5                   40.64                82.68               59.85              68.74
       5.0                   31.57                72.14               45.57              62.38
       5.5                   35.15                76.89               51.68              65.03
       6.0                   39.73                78.93               54.26              69.39

The Result of Percentage of Cd at Various Contact Time with Constant pH 4
     Contact Time of @pH4 Sugarcane Bagasse Guinea Corn Shaft Rice Husk                    Corn Cobs
     Contact Time (min)        % absorbed           % absorbed         % absorbed          % absorbed
     30                        45.79                84.14              61.57               76.38
     40                        60.26                90.80              69.76               79.56
     50                        69.95                95.27              75.51               81.40
     60                        76.63                98.81              83.93               85.79
     70                        88.14                99.57              90.08               89.02

Discussion of Results
The adsorption of cadmium ion (Cd2+) at various pH with contact time of 30 minutes are showed in figure
above. The absorption of cadmium ion (Cd 2+) decrease until it got to pHs 5 where it starts to increase which
indicates that pH 5 is the minimum content for the adsorption of cadmium ion (Cd2+) at ambient temperature.
Also for pH 4 at various contact time as contained in figure above indicates that as the % adsorbed increases
slightly. This may be due to blockage of the pores as adsorption process progresses.
However, Guinea Corn shaft has the highest percentage adsorbed at all the pH considered in this work, while
sugar cane bagasse has the least. The order of increasing is given as: Guinea Corn shaft > Corn Cobs > Rice
Husk > Sugar cane Bagasse. In the case of percentage of Cadmium adsorbed of various contact time at pH 4
also indicate that the order of increasing as per the four sample follow the same trend as above Guinea Corn
shaft > Corn Cobs > Rice Husk > Sugar cane Bagasse.

Conclusion
It can be concluded from the research work that the activated carbon made from sugarcane bagasse, Guinea corn
shaft, Rice husk and Corn cobs could be used to remove cadmium ion (Cd 2+) from aqueous solution with guinea
corn shaft as the highest removal of cadmium ion and sugar cane bagasse as the least.

References
 [1]. Ajmai M, Roa R.A, Anwar S, Ahmadj and Alunad R (2003): Adsorption studies rice husk extraction
       and recovery of Cd (II) from wastewater, Bioresearch Technology, pp 147 – 149.
 [2]. Alloway B.J and Ayres D.C (1997): Chemical Principals of Environmental Pollution, 2nd Edition,
       Blackie Academic and Professional, London. Vol. 9, Pp 89-105.
 [3]. Terry, P.A and Stone, W. (2010): Biosorption of cadmium and copper contaminated water by
       Scenedosmus abundant Chemosphere, 6th edition, pp 249 – 255.
 [4]. Sulayman, H; Abdui A, and Hammed, H.M (2010): Competitive adsorption of cadmium lead and
       mercury ions onto activate carbon in batch adsorbent, Journal International, Environmental Application
       and Science, pp 491 – 513.
 [5]. Tilaki, B.A.D Mahui A.H, Shariat, M and Nasseri S. (2004): Study of Cadmium removal from
       activated carbon, Iranian Journal Pupi Health. Vol. 13(4) pp 43 – 52.
 [6]. Sayed, G.O, Dessaki, H.A; and Ibrahim, S.S (2010): Biosorption of Ni(II) and Cd(II) ions from
       aqueous solution onto rice straw, Chemical Science Journal, Vol. 9, pp 5 – 9.

     Journal of Scientific and Engineering Research

                                                                                                          95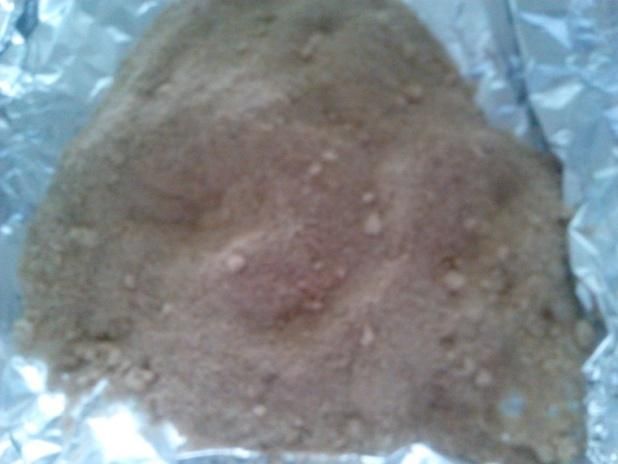
You can also read