Preferential attachment in the citation network of scientific articles - IOPscience
←
→
Page content transcription
If your browser does not render page correctly, please read the page content below

Journal of Physics: Conference Series

PAPER • OPEN ACCESS

Preferential attachment in the citation network of scientific articles
To cite this article: N G Scherbakova and S V Bredikhin 2021 J. Phys.: Conf. Ser. 1715 012055

View the article online for updates and enhancements.

                              This content was downloaded from IP address 46.4.80.155 on 02/02/2021 at 05:39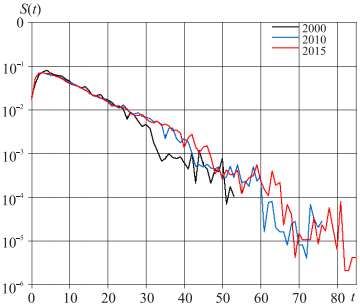
MSR 2020 IOP Publishing
Journal of Physics: Conference Series 1715 (2021) 012055 doi:10.1088/1742-6596/1715/1/012055
Preferential attachment in the citation network of scientific
articles
N G Scherbakova1 and S V Bredikhin1
1
Institute of Computational Mathematics and Mathematical Geophysics SB RAS,
Novosibirsk, Russia
E-mail: scherbakova@sscc.ru
Abstract. We study the citation network of scientific articles in the hypothesis that the
likelihood of connecting to a node depends on the node’s degree, a mechanism called the
preferential attachment. We show that the rate at which articles acquire citations linearly
depends on the number of citations already received and we find the functional form of the
dependence basing on the analysis of the dynamic source data. We also investigate the effect of
the article age on receiving citations and show that there is the exponential decay of interest to
old articles. Nevertheless the distribution of citations has the power-law form.
1. Background
The subject of our consideration is the citation network of scientific articles based on the data provided
by the bibliographic database. The nodes correspond to scientific articles, and directed links to
citations. Citation networks are characterized by a large number of nodes and a low density of links.
The indegree distribution of such network is different from the distribution typical for random
networks namely follows a power law
P k k (1)
for large k (k > kmin), so networks are scale-free. The indegree of a node is the number of citations to a
publication. Our aim is to examine the time evolution of citations and to investigate at which rate
articles acquire new citations.
Simon [1] assumed that the principle of "having much gets more” leads to a scale-free structure of
a network. Price [2] studied this mechanism as applied to citation networks and called the strategy by
which success breeds success, cumulative advantage. He formulated the strategy as follows: the speed
with which articles receive new citations is proportional to the citations already received. As a result
the fraction of articles that have received k citations (for sufficiently large k) decreases proportionally
to k− γ, where 2 ≤ γ ≤ 3. Papers [3–5] present the results of the analysis of real citation networks that
display power-law distributions of node degrees.
2. Scale-free model
Thanks to a series of works by Barabási and Albert the mechanism of cumulative advantage was
called the preferred attachment, hereafter PA. In their seminal work [6] the authors considered
networks as evolving dynamical systems that grow by preferential attachment. These ideas inspired
the introduction of the scale-free (SF) model that has a power-law degree distribution. It is assumed
that initially there are m0 nodes that are connected at random, each node has at least one link. The
Content from this work may be used under the terms of the Creative Commons Attribution 3.0 licence. Any further distribution
of this work must maintain attribution to the author(s) and the title of the work, journal citation and DOI.
Published under licence by IOP Publishing Ltd 1MSR 2020 IOP Publishing
Journal of Physics: Conference Series 1715 (2021) 012055 doi:10.1088/1742-6596/1715/1/012055
algorithm of the SF model is based on two principles. (1) Growth: at every timestamp a new node with
m (m ≤ m0) edges is added to the network, the edges link this node to m different existing nodes.
(2) Preferential attachment: the probability Π that a new node will be connected to node i depends on
the degree ki of node i as
k
( ki ) i . (2)
kj j
So the rate with which a node with k links acquires new links is a monotonically increasing
function of k, this is linear preferential attachment. According to the SF model, after t timesteps, the
network will have n = t + m0 nodes and m0 + (mt) edges. Assuming that ki is a continuous real variable
(the continuum approach), the evolution of the degree ki of a node i can be represented by the equation
dki
m ( ki ). (3)
dt
With using the continuum method the authors showed that the network evolves into a scale invariant
state with the probability that a node has k links following the power law with the exponent γ = 3,
moreover γ is the only parameter of the model.
The generalized PA, nonlinear preferential attachment, was presented in [7] as
k
(ki ) i C (t ) ki , (4)
j
kj
where C(t) is a normalization constant. The analytical study [7] demonstrate that the scale-free nature
of the network is destroyed for nonlinear preferential attachment. The only case in which the topology
of the network is scale-free is when the preferential attachment is asymptotically linear.
2.1. Aging
Dorogovtsev and Mendes [8] proposed that for some real networks the probability that a new node
connects to a node i also depends on an age of node i, for example publications gradually lose their
ability to attract the attention. So
(ki ti ) ki f (ti ), (5)
where f(ti) is an aging function, ti is a timestep a node i was added to the network. In the network
model [8] the probability Π decays as (t – ti)-v, where t – a timestep a new node is added, ν is a tunable
parameter. The calculations predict that the degree distribution depends on the exponent ν: a power-
law scaling presents only for ν < 1, and its exponent γ depends on ν. Moreover for ν > 1 the power-law
scaling completely disappears, the degree distribution approaches an exponential. The exponential
form of an aging function is considered in [9, 10].
2.2. Initial attractiveness
In real networks there is a nonzero probability that a new node attaches to an isolated node i, so
Π(0) ≠ 0. Speaking of a citation network a node that has no citations can receive some in future. Thus
[11] presented the model of a directed network such that PA has a shifted linear form:
kiin k0
(kiin ) , (6)
k inj k0
j
where k is the indegree of the node i, k0 is the initial attractiveness of the node i. It was shown in
i
in
[11] that the indegree distribution follows a power law, and an exponent γ depends on k0.
So for a model of a directed network with shifted preferential attachment and aging the probability
that a newly added node will connect a node i providing that t timesteps have passed after adding i
may be proportional to the following characteristics:
kiin , t kiin k0 f i (t ). (7)
2MSR 2020 IOP Publishing
Journal of Physics: Conference Series 1715 (2021) 012055 doi:10.1088/1742-6596/1715/1/012055
3. Empirical research
We study quantitative features of the real citation network of articles based on data provided by RePEc
database [12]. For this citation network we know the time at which each node joined the network. Our
main task is to determine how the factors presented in (7) affect the network evolution. Note that these
factors are not all that affect the receiving of citations, as an example: citation norms, validity,
personal preferences, etc.
Hereafter we use the following terminology. If the article in its reference list contains the reference
(cites) to some article, then such reference is called the outgoing citation from the point of view of the
citing article, and the incoming citation from the point of view of the cited article. Let the article j cites
the article i. Let tj and ti be the years of publication of articles j and i, respectively. The age of a citation
τi is defined as the difference in the publication year of the citing paper and the publication year of the
cited paper: τi = tj – ti.
3.1. General information
The investigated data covers the period 1874 through June 2019. Total number of articles is 1404431.
The data was corrected: articles with unobvious year of publication, links to the wrong year and self-
citations were ignored. So we study the maximal connected component NREP = (V, E), the number of
nodes |V| = 819207 and the number of edges |E| = 5538043. Only internal citations are taken into
account, i.e. citations between the articles contained in V. The number of articles without citations is
191468 (23.37%). Number of articles cited at least once – 627739. The average number of incoming
citations is 6.76. For articles cited at least once – 8.82. The average citation age τi = 11.02. Most
cited articles have a citation age significantly higher than average. For articles with more than 500
citations, the average citation age τi = 22.87.
NREP is characterized by an exponential growth in the number of articles and, accordingly, new
outgoing citations with time. For example, in 2000 the database was replenished with 15445 articles
and 57086 outgoing citations (3.69 references per one article on average), and in 2010, 35406 articles
and 249324 new citations (7.04 references). The number of incoming citations to articles published
during these years has increased: 175578 and 242655, respectively. When considering the distribution
of incoming and outgoing citations by years from 1937 to 2019, it turned out that the curves have
similar growth trends. The close correlation of distributions shows that recently published articles are
most cited.
We show that the incoming citation distribution for the set V follows the power law. The method
for recognizing the presence of a power law in an empirical data and finding parameter values was
proposed in [13]. Using the igraph package [14], it was found that the indegree distribution follows the
power law with parameters γ = 2.89, kmin = 207. So the power law fits the articles having a number of
incoming citations greater than or equal to 207. When we compare the citation distribution of articles
published in selected years with the integrated citation distribution we see that all of them are similar
except for the large k values.
3.2. Measuring Π(k)
Let us study (7) independently of k0 and fi(t) and prove that Π(kin) is the monotonically increasing
function of kin (hereinafter we use notation k instead of kin). In order to extract the functional form Π(k)
from the dynamic data we use the methods presented in [15, 16]. Taking into account (3), (4), the
probability Π(k) is considered as the speed Ak with which the existing node with the degree k acquires
new edges (citations) in the process of the network growth. So we want to show that for the network
under consideration Ak k.
We study the attachment of new nodes within relatively short time-frames in order to ignore the
normalization constant C(t) that depends on the time at which a given node joins the network. Let
T1 = 2018, ΔT = 1 and consider outgoing citations of articles published between [T1, T1 + ΔT], that is,
during 2018. The number of outgoing citations for this period is 658415. Let T0 = T1 – 1, i.e.
T0 = 2017. For each article published within time window w1 = [1874, T0], we calculate the number of
3MSR 2020 IOP Publishing
Journal of Physics: Conference Series 1715 (2021) 012055 doi:10.1088/1742-6596/1715/1/012055
incoming citations k received during T1. Then we find Δk – the average number of incoming citations
received by articles with k citations within the period [T1, T1 + ΔT]. We consider additional time
windows w2 = [1988, T0], w3 = [1998, T0], w4 = [2008, T0], that is, we change the initial year of the
period for which k is calculated and then calculate Δk. The results of Ak approximation with a linear
function with use the method of least squares show that Ak has a form ak + b, see Tab. 1, column f1. It
should be noted that the approximating function depends on the time window. Moreover, it depends
on the range of k, see Tab. 1, column f2 for k ≤ 50. We can present the linear form ak + b as k + b/a,
that is, Ak k + k0, where k0 can be considered as the initial attractiveness. It makes sense for small
values of k (k ≤ 50), since in this case k0 is positive.
Table 1. Summary of the approximating functions for Ak. It can be seen that the functional form
depends on the time window (w1 – w4) and the range of k (all values or k ≤ 50)
Window f1 f2
w1 y = 0.090066 x – 0.404866 y = 0.094525x + 0.369329
w2 y = 0.090105 x – 0.405038 y = 0.094847x + 0.365893
w3 y = 0.095328 x – 0.959371 y = 0.098202x + 0.345890
w4 y = 0.126907 x – 0.682570 y = 0.127795x + 0.213792
We can see that the estimation is unstable. The choice of several time windows for calculating k
allows to give an aggregated estimation, but in this case C(t) value changes will be ignored.
3.3. Aging function
We study the aging (obsolescence) process, ignoring the PA mechanism and calculate the period of
time articles with the same number of citations will be cited again. An analysis of the relationship
between the average citation age and the number of citations received reveals a positive correlation,
which can be clearly seen for the number of citations less than 50 (approximating function y =
0.08882x + 7.3354). For large values, significant fluctuations are observed, and the amplitude of
fluctuations increases. “Outstanding” articles (often cited) have a large average citation age. That is,
the processes of articles aging and obsolescence are different.
We study two distributions: S(t) and D(t). S(t) is the distribution of ages of cited articles that
receive citations from articles published in the selected year. D(t) is the distribution of ages of citing
articles that cite articles published in the selected year.
Let us fix the year of publication of citing articles t0. Articles published in the year t0 cite n articles
published in years t1, t2, ..., tj, ... (in the past with respect to t0). Let ni be the number of cited articles
published in the year ti. The distribution of intervals θi = (t0 – ti) defines S(t). Trends of forgetting past
articles can be seen in the presented figure. Abscissa indicates the intervals that have passed since the
Figure 1. The distribution S(t) of the
ages of past articles cited by papers published
in the selected years. It can be seen that the
curves related to different years are similar
4MSR 2020 IOP Publishing
Journal of Physics: Conference Series 1715 (2021) 012055 doi:10.1088/1742-6596/1715/1/012055
publication of cited articles, and ordinate shows the proportion of cited articles ni n, the logarithmic
scale. The figure shows that citing articles prefer to cite papers published 2–3 years before, then the
exponential decay follows. The distribution S(t) can be considered as an analogue of an aging function
(5), i.e., the aging function has the form f(t) = exp(αt), α < 0. It was shown [8] that for a network with
a constant growth rate, an exponential aging function leads to an exponential distribution of the
degrees of nodes. However, it was found that for NREP the indegree distribution follows the power law.
As noted in [16] due to the exponential growth in the number of publications with time, the network is
less affected by the rapid dropping in interest to past articles.
Now let t0 be the year of publication of articles for which incoming citations are considered, these
are cited by articles published in years t1, t2, ..., tj, ... (in the future, with respect to t0). Let ni be the
number of citing articles published in the year ti. The distribution of the intervals θi = (ti – t0) defines
D(t). The analysis of the distribution shows that during the first 21 years there is the linear increase,
followed by an exponential decay, but the decay is much slower than for S(t). That is, citing authors
forget about publications faster than it affects cited publications. As a result, the indegree distribution
follows the power law.
Summary
The computational experiment is devoted to the analysis of processes that influence the evolving of
the citation network of articles NREP based on RePEc data. We focus on the PA mechanism and find
that the growth of citations to an article is proportional to its current number of citations and is
approximated by the linear function.
On the one hand, according to the idealized PA mechanism, articles with the high number of
citation are most likely to receive new ones, on the other hand the exponential increase in the number
of articles reduces the chance of citing old articles, and the main increase in the number of citations
occurs in the first two years after publication. For NREP the average citation age is about 11 years. The
aging process can be represented by the decaying exponential function, exponent values depend on the
range of ages of the cited articles. It should be noted that some articles are currently being cited at a
significant rate, and some articles are “dead”. If we consider citing ages to articles published in the
certain year we see the exponential decay 21 years after publication of cited articles, but the decay is
slower. So in spite of exponentially-decaying interest to past publications, due to exponential growth
of publications and citations, the number of citations to past publications is increasing.
References
[1] Simon H A 1955 On a class of skew distribution functions Biometrika 42 425–40
[2] Price D J 1976 A general theory of bibliometric and other cumulative advantage processes J.
Amer. Society for Inform. Sci. 27 292–306
[3] Tsallis C and de Albuquerque M P 2000 Are citations of scientific papers a case of
nonextensivity? Eur. Phys. J. 13(4) 777–80
[4] Redner S 1998 How popular is your paper? An empirical study of the citation distribution Eur.
Phys. J. B 4(2) 131–134
[5] Peterson G J, Presse S and Dill K A 2010 Nonunivessal power law scaling in the probability
distribution of scientific citations in Proc. Natl. Acad. Sci. USA 107 (37) 16023–27
[6] Barabási A-L and Albert R 1999 Emergence of scaling in random networks Science 286 509–12
[7] Krapivisky P L, Redner S and Leyvraz F 2000 Connectivity of growing random networks Phys.
Rev. Lett. 85 4629–32
[8] Dorogovtsev S N and Mendes J F F 2000 Evolution of reference networks with aging Phys.
Rev. E 62. 1842–45
[9] Zhu H, Wang X, and Zhu J-Y 2003 Effect of aging on network structure Phys. Rev. E 68
056121
[10] Hajra K B and Sen P 2006 Modelling aging characteristics in citation networks Physica A 368
575–82
5MSR 2020 IOP Publishing
Journal of Physics: Conference Series 1715 (2021) 012055 doi:10.1088/1742-6596/1715/1/012055
[11] Dorogovtsev S N, Mendes J F F and Samukhin A N 2000 Structure of growing network with
preferential linking Phys. Rev. Lett. 85. 4633–36
[12] RePEc http://repec.org
[13] Clauset A, Shalizi C R and Newman M E J 2009 Power-law distributions in empirical data
SIAM Review 51 661–703
[14] igraph – The network analysis package https://igraph.org
[15] Jeong H, Neda Z and Barabási A L 2003 Measuring preferential attachment for evolving
networks EuroPhysics Letters 61 567–72
[16] Redner S 2004 Citation statistics from more than the century of Physical Review
arXiv:physics/0407137
6You can also read