Analysis of Airline Connectivity System using Graph Theory - sersc
←
→
Page content transcription
If your browser does not render page correctly, please read the page content below
International Journal of Control and Automation
                                                                         Vol. 13, No. 4, (2020), pp.77 - 84

           Analysis of Airline Connectivity System using Graph Theory
            *Mukkamala S N V Jitendra1, Shanmuk Srinivas Amiripalli2, Vishnu
              Vardhan Reddy Kollu3, P Ramaiah Chowdary4, R Venkata Rao5.
           1, 2, 3
                 Department of Computer Science and Engineering, GIT, GITAM University,
                                        Visakhapatnam, AP, India.
             4
               Department of Information Technology, Sir C.R.Reddy College Of Engineering,
                                            Eluru, AP, India.
           5
             Department of Computer Science and Engineering, Wollega University, Nekemte,
                                                Eithopia.
                                    jitendra.mukkamala@gmail.com.

                                                Abstract
          In the recent era, analytics plays a vital role in understanding and improving profits of
       many businesses. Now a day’s different analytic models available in the market. Some of
       them are descriptive analytics, predictive analytics, prescriptive analytics, big data
       analytics, and mathematical analyticsetc. The powerful and simple Graph theory based
       analytic models was used in this paper. Two different airline systems are selected and
       applied Graph analytics. In the initial process, spice Jet and Vistara datasets are
       converted into graphs Spice Jet and Vistara. Graph analytics were applied to the above
       graphs and found that one i.e., Vistara is weakly connected over spice Jet. An incremental
       model was proposed to increase the connectivity of Vistara so that the performance will
       be increased. So that Vistara can increase the business by adding trips in an incremental
       order from one trip to 15 trips. Finally, we compared the above airline companies with
       the proposed model generated results and it was observed that the proposed model is
       giving a feasible solution to Vistara airlines by adding trips in incremental order.

       Keywords: Data Analytics, Graph Analytics, TGO topology, optimization, python.

       1. Introduction

       Foreign investment restrictions in 2012, Vistara’s company, has collaborated with Tata
       Sons Private Limited and Singapore Airlines Limited (SIA), wherein Tata Sons have a
       51% stake hold, and Singapore Airlines owns a 49% stake. They were registered as
       TATA SIA Airlines Limited. In 2013, both famous companies decided to satisfy their
       passenger's a long-cherished shared dream to cause a singular flying experience to their
       customers across India. Both the groups were firm believers within the growth potential
       of the Indian aviation sector and hence tried to enter the market within the past. The main
       agenda of this venture is to redefine aviation in India to supply Indian travelers with a
       seamless and personalized flying service excellence and legendary hospitality. The name
       ‘Vistara’ derived from the Sanskrit word ‘Vistaar,’ which means ‘a limitless expanse.’
       The name Vistara takes out from the inspiration of the planet, which means the ‘limitless’
       sky, with its brand tagline as ‘fly the new feeling’. In solving many engineering
       applications, the best way is to represent a problem in the form of a diagram or a graph. In
       this research, the connectivity of these two airline systems and investigate theoretically by
       using graph theory parameters. Connectivity places an efficient role in increasing services

ISSN: 2005-4297 IJCA                                                                                    77
Copyright ⓒ 2020 SERSC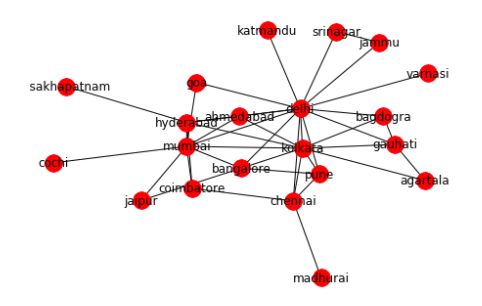
International Journal of Control and Automation
                                                                       Vol. 13, No. 4, (2020), pp.77 - 84

       to customers and also increases profits to the organization. This is one of the oldest
       techniques inherited from the Konigsberg bridge problem. We are making a new attempt
       to solve this problem by using graph theory [1], [2].

       2. Related Work

                 In this paper, the author has applied the network science concept on the airline
       system to improve performance. The major focus is on giving a feasible solution to the
       airline companies by running optimal trips. The best part of this paper author has to try to
       improve the performance by adding edges 3,5,8,13,15. So that airline company can slowly
       increase their profits by adding the above number of trips [3], [13], [14]. The author has
       explained about the SCN model was applied to network science parameters, the analyses
       of different topologies like scalability and ID survivability, the robustness of complex
       networks. In this paper, the author mainly focuses on applying topological Characteristics
       of the SCN model. This model generates better results even though there is a growth in a
       network. a major problem that was addressed is model can withstand even abnormal
       growth. A proposed modal will come under it based on generate to network models.
                 The author has given the importance of dynamic scenarios which are observed in
       Mankind, animals, and different Mini robot systems. To establish a communication we
       required an interaction network. This network can be operated in a dynamic environment
       that requires power for information transformation within the network. if there is a flight
       confusion in a network which leads to an increase of degree. Finally, the author observed
       in complex networks has important Cultural characteristics of human behavior. [5]. The
       main focus of this paper is on designing and analyzing the topological structure of a social
       network. The proposed model was built using an automatic tool that is used to analyze
       dialogues in a novel. Characters were recognized in a story and also connect the
       relationship between real-time scenarios. Composite networks are characterized by highly
       heterogeneous distributions of links within the presence of key possessions like
       robustness. Several correlation measures are taken to define the characterized structure of
       the nets. By using simulated annealing optimization, we propose that constraints are
       literally operated on the possible complex networks [6], [7].

       3. Proposed Methodology

           Firstly, each airlines datasets square measure thought-about into two distinct graphs,
       G-SpiceJet with parameters Vertex as V1 and Edge as E1 equally for G-Vistara with
       parameters Vertex as V2 and Edge as E2 were thought of as inputs at the side of the extra
       parameters like Node, Degree, Edge, Density, Average Degree, Average cluster
       coefficient, Transitivity, Average Shortest Path Length in Table 1. When examining them
       we are going to decide the less operative network graph. If G-Vistara isn't economical
       than G-SpiceJet, then store G-SpiceJet values into a short-lived variable and think about
       every near edge G-SpiceJet that is not accessible in G-Vistara graph and check the
       network with normal network graph parameter. If its higher performance than the
       previous network graph, take into account the edge 'Ei' otherwise don't consider it.
       Similarly, if G-SpiceJet were less economical than G-Vistara, we will store G-Vistara
       values into temporary variables and take into account every edge 'Ei' in G-Vistara that
       isn't G-SpiceJet and check the network with customary network graph parameter. If its

ISSN: 2005-4297 IJCA                                                                                  78
Copyright ⓒ 2020 SERSC
International Journal of Control and Automation
Vol. 13, No. 4, (2020), pp.77 - 84
higher performance than the previous network thinks about the sting 'Ei' otherwise don't
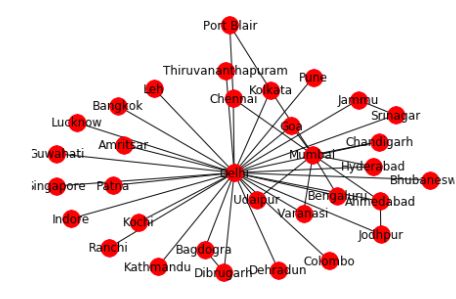
think about it. Finally, show the output for in progressive order [8]-[12]. In the following
Figure-1 and Figure-2 displays a connected graph network of both SpiceJet and Vistara
airlines with respective edges and nodes.
Table 1.
Notations used in the proposed algorithms
Symbol Description
G-SpiceJet SpiceJet Network Graph
G-Vistara Vistara Network Graph
V1 Nodes of SpiceJet
E1 Edges of SpiceJet
V2 Nodes of Vistara
E2 Edges of Vistara
N Number of nodes
Dia Diameter
E Edges
Den Density
Avgd Average degree
Avgcc Average cluster coefficient
T Transitivity
Avgspl Average shortest path length
Figure 1. G-SpiceJet With 21 Nodes and 41 Edges.
ISSN: 2005-4297 IJCA 79
Copyright ⓒ 2020 SERSCInternational Journal of Control and Automation
Vol. 13, No. 4, (2020), pp.77 - 84
Figure 2. G-Vistara With 33 Nodes and 44 Edges.
3.1 Algorithm for TGO Methodology
Input: G-SpiceJet, G-Vistara
Output: G’-Vistara'
1. Begin
2. Two input images are converted into graphs G-SpiceJet,G-Vistara
3. G-SpiceJet, G-Vistara are compared with parameters like N, Dia, E, Den, Avgd,
Avgcc, T, Avgspl
4. After analysing, identify less connected graph and try to improve its connectivity
by adding edges.
5. If (G-Vistara is less economical than G-SpiceJet) Then
Factors of Spice Jet are Pushed into temp variables
for each iteration edge of G-SpiceJet (Vi, Ei) in G-SpiceJet
6. Else If (G-SpiceJet is less economical than G-Vistara) Then
Factors of SpiceJet are Pushed into temp variables
for each iteration edge of G-Vistara (Vi, Ei) in G-Vistara
7. Repeat step 5 untill G’-Vistara (Vi, Ei) is well connected.
8. End
4. Results and Discussion
In Figure-5 SpiceJet has 21 nodes and 41 edges whereas 33 nodes and 44edges are
compared with previous SpiceJet, Vistara. Results of Vistara are low in all parameters
except nodes and edges. so our algorithm slowly increases the performance of Vistara, At
the end Vistara has a good number of edges for better performance. In Figure-3 average
clustering(C), transitivity (T) and density (D) of spice jet are increasing by adding edges
ISSN: 2005-4297 IJCA 80
Copyright ⓒ 2020 SERSCInternational Journal of Control and Automation
Vol. 13, No. 4, (2020), pp.77 - 84
in ascending order to a network which indicates the number of locations associated with a
respective location is increasing when compared to the previous network. In Figure-4 The
average shortest path length (l) is decreasing which shows that path length for traveling
from one location to another location is low. Finally, we can a observe detail comparison
was in Table 2.
Table 2. Results Generated by Spice Jet and Vistara.
Vistara Vistara Vistara Vistara Vistara Vistara Vistara Vistara
Spice
Parameter Vistara adding adding adding adding adding adding adding adding
Jet
1 edge 2 edges 3 edges 4 edges 5 edges 6 edges 7 edges 8 edges
Nodes 21 33 33 33 33 33 33 33 33 33
Edges 41 44 45 46 47 48 49 50 51 52
Avg Degree 3.9 2.667 2.72 2.78 2.84 2.9 2.96 3.03 3.09 3.15
0.018
Transitivity 0.355 0.067 0.078 0.088 0.093 0.097 0.112 0.131 0.134
2
Avg 0.161
0.52 0.38 0.381 0.385 0.412 0.402 0.408 0.459 0.446
Clustering 8
0.083 0.098
Density 0.195 0.085 0.087 0.089 0.09 0.092 0.094 0.96
3 4
Avg shortest
Path length
2.09 2.007 1.96 1.965 1.962 1.958 1.956 1.952 1.95 1.946
Figure 3. Comparing edges (E) and Nodes (N) of Spicejet, Vistara and
improvements taken in Vistara.
ISSN: 2005-4297 IJCA 81
Copyright ⓒ 2020 SERSCInternational Journal of Control and Automation
Vol. 13, No. 4, (2020), pp.77 - 84
Figure 4. Comparing average Degree and average shortest path length of
Vistara, SpiceJet and improvements taken in Vistara.
Figure 5. Comparing Density, Average clustering, Transitivity and of
Vistara, SpiceJet and improvements taken in Vistara.
ISSN: 2005-4297 IJCA 82
Copyright ⓒ 2020 SERSCInternational Journal of Control and Automation
Vol. 13, No. 4, (2020), pp.77 - 84
5. Conclusion
The oldest and powerful tool for analytics is Graph analytics which is one of the
important techniques used for solving real-time problems. In this research, a real-time
problem will be converted into a graph, for these graphs standard graph theory and
network science techniques were applied to get a feasible solution. Parameters like node,
edge, and diameter, average degree, density, transitivity, average clustering, average
shortest path length are used for analyzing SpiceJet and Vistara. Initially, nodes and edges
of Vistsra are more but it was not well-connected because it is in losses. The proposed
model will add trips in an optimal way so that its connectivity will be increased. if we
compare spice jet with Vistara after adding with 8 edges average degree was increased
from 2.667 to 3.15. Similarly, 0.0182 to 0.134, 0.1618 to 0.446 of transitivity and average
clustering increased respectively. Finally, 2.007 to 1.946 shortest path was decreased,
means well connected.
References
[1] S. S. Amiripalli and V. Bobba, “An Optimal TGO Topology Method for a Scalable
and Survivable Network in IOT Communication Technology,” Wireless Pers
Commun, vol. 107, no. 2, pp. 1019–1040, Jul. (2019).
[2] P. C. S. Rao, P. K. Jana, and H. Banka, “A particle swarm optimization based
energy efficient cluster head selection algorithm for wireless sensor networks,”
Wireless Netw, vol. 23, no. 7, pp. 2005–2020, Oct. (2017).
[3] Amiripalli, S. S., Kollu, V. V. R., Jaidhan, B. J., Srinivasa Chakravarthi, L., &
Raju, V. A. (2020). Performance improvement model for airlines connectivity
system using network science. International Journal of Advanced Trends in
Computer Science and Engineering, 9(1), 789-792.
doi:10.30534/ijatcse/2020/113912020
[4] S. S. Amiripalli, V. Bobba, “A Fibonacci based TGO methodology for survivability
in ZigBee topologies”. International Journal Of Scientific & Technology Research,
9(2), pp. 878-881. (2020).
[5] Perera, Supun, Michael Bell, and Michiel Bliemer. "Network Science approach to
Modelling Emergence and Topological Robustness of Supply Networks: A Review
and Perspective." arXiv preprint arXiv:1803.09913 (2018).
[6] Mateo, David, et al. "Optimal network topology for responsive collective
behavior." Science advances 5.4 (2019): eaau0999.
[7] Waumans, Michaël C., Thibaut Nicodème, and Hugues Bersini. "Topology analysis
of social networks extracted from literature." PloS one 10.6 (2015).
[8] Solé, Ricard V., and Sergi Valverde. "Information theory of complex networks: on
evolution and architectural constraints." Complex networks. Springer, Berlin,
Heidelberg, (2004). 189-207.
[9] M. Al-Fares, A. Loukissas, and A. Vahdat, “A Scalable, Commodity Data Center
Network Architecture, “in ACM SIGCOMM’08, Seattle, Washington, USA,
(2018), pp. 1–12.12
ISSN: 2005-4297 IJCA 83
Copyright ⓒ 2020 SERSCInternational Journal of Control and Automation
Vol. 13, No. 4, (2020), pp.77 - 84
[10] M. Pal, P. Sahu, and S. Jaiswal, “LevelTree: A New Scalable Data Center
Networks Topology,” in 2018 International Conference on Advances in
Computing, Communication Control and Networking (ICACCCN), Greater Noida
(UP), India, (2018), pp. 482–486.13
[11] D. Mateo, N. Horsevad, V. Hassani, M. Chamanbaz, and R. Bouffanais, “Optimal
network topology for responsive collective behavior,” Sci. Adv., vol. 5, no. 4, p.
eaau0999, Apr.( 2019).14
[12] Sanam. Nagendram, P. Sai Anil, E. V. S. Pavan, V. Amarendra, “Performance
Evaluation of Wide Area Network using Cisco Packet Tracer”. International
Journal Of Scientific & Technology Research, 9(2), pp. 878-881. (2020) .15
[13] S. S. Amiripalli and V. Bobba, “Impact of trimet graph optimization topology on
scalable networks,” IFS, vol. 36, no. 3, pp. 2431–2442, Mar. (2019).
[14] S. S. Amiripalli, V. Bobba, “Research on network design and analysis of TGO
topology”. International Journal of Networking and Virtual Organisations, 19(1),
pp. 72-86. (2018).
ISSN: 2005-4297 IJCA 84
Copyright ⓒ 2020 SERSCYou can also read