Predicting the Cases of Hepatitis B with the A-LSTM Model
←
→
Page content transcription
If your browser does not render page correctly, please read the page content below

Journal of Physics: Conference Series

PAPER • OPEN ACCESS

Predicting the Cases of Hepatitis B with the A-LSTM Model
To cite this article: Yang Li et al 2021 J. Phys.: Conf. Ser. 1995 012007

View the article online for updates and enhancements.

                                This content was downloaded from IP address 46.4.80.155 on 23/09/2021 at 18:29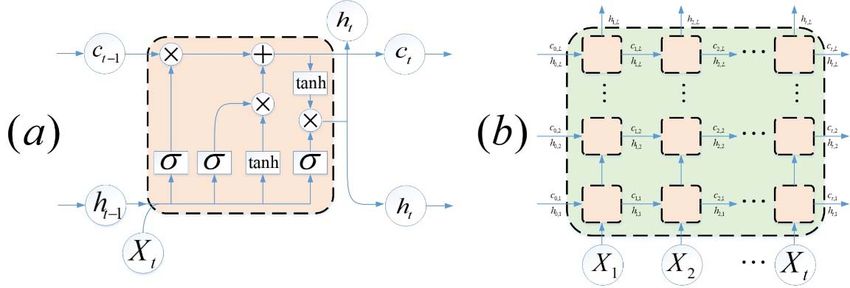
CMSA 2021                                                                                                       IOP Publishing
Journal of Physics: Conference Series                         1995 (2021) 012007          doi:10.1088/1742-6596/1995/1/012007

Predicting the Cases of Hepatitis B with the A-LSTM Model

                     Yang Li1,2,*, Yali Yang1, Cong Yang1 and Baolin Zhang3
                     1
                       Fundamentals Department of Air Force Engineering University, Xi’an, Shaanxi, China
                     2
                       Command and Control Centre of Wenchang Spacecraft Launch Site, Wenchang,
                     Hainan, China
                     3
                       Radar NCO School of Air Force Early Warning Academy, Wuhan, Hubei, China

                     *Corresponding author email: xleon2008@outlook.com

                     Abstract. Hepatitis B is a disease caused by hepatitis B virus. It’s of great value to predict the
                     cases of hepatitis B because of its strong infectivity and carcinogenicity. To predict the monthly
                     new patients of hepatitis B in China accurately, a neural network with an attention-based LSTM
                     model is proposed. Driven by the historical data provided by the Data-center of China Public
                     Health Science, the model’s evaluation indexes of RMSE, MAPE, MAE and R-squared are
                     1780.495, 1.789%, 1469.208 and 0.867 respectively, while the evaluation indexes of BPNN are
                     3532.959, 3.311%, 2677.009 and 0.478 respectively. The result shows that A-LSTM model in
                     this work has an excellent prediction on the monthly new patients of hepatitis B and performs
                     much better than BPNN and other traditional time series models.
                     Keywords: A-LSTM; Hepatitis B; Attention mechanism; Predictive modelling.

1. Introduction
Hepatitis B is caused by hepatitis B virus, which can cause acute or chronic hepatitis, and produce
cirrhosis or liver cancer. In China, hepatitis B belongs to class B infectious diseases, second only to
plague and cholera. The main routes of transmission include blood transmission, mother to child
transmission, sexual transmission and other body fluid contact transmission. According to the data
released in 2018, there are almost 70 million chronic hepatitis B patients in China. As hepatitis B cannot
be cured at present, it is very important to accurately predict its trend and take positive preventive and
control measures.
Both the traditional model, which is represented by ARIMA (Autoregressive Integrated Moving
Average model), and deep learning model, such as BPNN (Back Propagation Neural Network), RNN
(Recurrent Neural Network), CNN (Convolutional Neural Networks), have good performances in
prediction of time series. ARIMA model proposed by George box is used in prediction of environmental
index [1], infectious disease [2], etc. The BPNN model proposed by Rumelhant and Mc Clelland in
1986 is widely used in the prediction of stock market [3], class B notifiable disease [4], PM10
concentration [5]. RNN and its derived LSTM (Long Short-Term Memory) model have good
performance in sequence data processing, such as machine translation [6], speech recognition [7], house
price prediction [8], etc. Liu et al. used ARIMA and BPNN to predict the incidence of pulmonary
tuberculosis in China. The results showed that the performance of BPNN was significantly better than
the traditional ARIMA model [9].
In this work, we propose a deep learning model with A-LSTM. The model driven by the historical data
of the monthly new cases of hepatitis B in China, has an outstanding performance on forecasting the
short-term new hepatitis B data in the future. In the following parts of the paper, we will introduce the

              Content from this work may be used under the terms of the Creative Commons Attribution 3.0 licence. Any further distribution
              of this work must maintain attribution to the author(s) and the title of the work, journal citation and DOI.
Published under licence by IOP Publishing Ltd                          1
CMSA 2021 IOP Publishing
Journal of Physics: Conference Series 1995 (2021) 012007 doi:10.1088/1742-6596/1995/1/012007
data and the models firstly, and then we will present the results. At last, the discussion and conclusion
will be given.
2. Data and the Model
2.1. Data
There are many organizations to publish the data of hepatitis B. We choose the data published by the
authoritative Data-center of China Public Health Science. According to the data of the project, since
January 2004, the monthly incidence of hepatitis B in China has been higher than 50,000, even close to
120,000. Figure 1 shows the monthly new cases of hepatitis B in China from January 2004 to December
2017.
Figure 1. The monthly new cases of hepatitis B from January, 2004 to December, 2017.
We choose to use the i th month data of monthly new cases in last 5 years to predict the new cases in the
next year. Let X i represents the new hepatitis B cases of the i th month. Before we construct the dataset
X i min{ X i }
to train the model, X i should be normalized to [0,1] as follows: X 'i . Then we
max{ X i } min{ X i }
get the dataset: {( X 'i , X 'i 12 ,, X 'i 48 ; X 'i 60 )} , which will be divided into training set, verification set
and test set with the ratio of 0.7225:0.1275:0.15.
2.2. LSTM Model and Attention Mechanism
Because RNN network model can extract all input state information before the current time, it is widely
used in the field of sequence data processing. However, in the training process of RNN network model,
the gradient may disappear and explode. In order to solve these two problems, Hochreiter and
Schmidhuber proposed the long-term and short-term memory model (LSTM) in 1997. The structure of
LSTM is shown in Figure 2.
2CMSA 2021 IOP Publishing
Journal of Physics: Conference Series 1995 (2021) 012007 doi:10.1088/1742-6596/1995/1/012007
Figure 2. The unit structure of LSTM (a) and the structure of LSTM (b) [10].
In each unit of the LSTM network, X t represents the input of time t, and ht R m is the hidden state
of RNN at time t, m is the sequence length of the hidden state, is sigmoid function, and is
Hadamard product operation. Then, the hidden states of LSTM layer at different time are spliced into
H1 [h1 , h2 , , ht ] R mT , and H1 is used to construct the attention value:
h( j ) H 1 W j b j , j [1, 2, , T ] . W j R , b j R m are the parameters that the network needs to
T
obtain through training. At last, h(1), h(2),, h(T ) are spliced into attention value:
T m
H 2 [h(1), h(2), , h(T )] R
'
.
2.3. A-LSTM Model
The LSTM model based on attention mechanism proposed in this work, which will be called A-LSTM,
is shown in Figure 3(a). The time series data pass through two LSTM modules at the same time. The
output of LSTM_1 module goes into attention module and gives attention H 2 RT m . At the same time,
the hidden states of each layer in LSTM_2 module are spliced as H 3 RT m , just like H1 R mT . Then
the input of Decoder module is constructed as H 4 H 2 H 3 . Finally, the output of A-LSTM model is
given by the Decoder module as Yˆ Wout H 4 bout . Among the equation, Wout R T m and bout R
are to be obtained through training by the network, and the operation symbol A means to get the sum
of all the elements in matrix A .
Figure 3. The structures of A-LSTM model (a) and BPNN model (b) [11].
The network structure of A-LSTM model is mainly determined by the number n of LSTM units and the
number L of LSTM layers. In this work, we choose a 2-layer A-LSTM, i.e., L=2, and try to train the
model and make prediction for each n{5,6,,12}. And then we choose the most outstanding model
as our final model. In the model, “MSE” and “rmsprop” are the loss function and optimizer.
2.4. BPNN Model
BPNN model well simulates the working principle of human neuron through signal forward propagation
and error backward propagation, which is the core of BPNN model. The general network structure of
BPNN model is shown in Figure 3(b), which includes one input layer, several hidden layers and an
output layer [11].
3CMSA 2021 IOP Publishing
Journal of Physics: Conference Series 1995 (2021) 012007 doi:10.1088/1742-6596/1995/1/012007
In the model, “tanh”, “ReLu” and “linear” are the activation functions of input layer, hidden layer and
output layer respectively. And the error function and the optimizer are “MSE”, “rmsprop”.
2.5. Evaluation Indexes
It is necessary to make an objective evaluation on the performance of different neural networks and
different models among same type of neural network. The common evaluation indexes are RMSE,
MAPE, MAE, and R-squared ( R 2 ). RMSE, MAPE and MAE represent root mean square error, average
absolute percentage error, mean absolute error respectively. The smaller the value of these three
evaluation indexes is, the better prediction the model will have. How strong the linear relationship
between two variables is assessed by R 2 . The closer R 2 is to 1, the better the model will be.
n
( y i yi )
2
100% y i yi
1/ 2
1 n
2
n 1 n
RMSE ( y i yi ) , MAPE | |, MAE | y i yi |, R 1 i n1
2
n i 1 n i 1 yi n i 1 ( yi y )
2
i
i 1
Among the equations above, y i , yi , y i are the predicted value, the observed value, the average of the
observed values respectively.
3. Results
The dataset constructed in 2.1 is used to train the A-LSTM models with the parameters n{5,6,,12}
and BPNN models with the parameters (n, L) {5,6,,12}{1,2,3} . Then the trained models make the
predictions respectively.
Table 1. The performance of A-LSTM when n ranges within {5, 6, … ,12}.
n 5 6 7 8 9 10 11 12
RMSE 3532.96 4857.50 5129.39 5173.20 5184.12 5444.06 5582.12 5593.57
According to the Table 1, when n ranges within {5,6,…,12}, the RMSE of A-LSTM model will increase.
So, A-LSTM with n = 5 is chosen as the best model, and the best prediction is shown in Table 2.
Similarly, BPNN model with the parameters (n, L) (6,3) makes its best prediction, which is also
shown in Table 2.
Table 2. The best prediction of A-LSTM and BPNN.
A-LSTM BPNN
Observed
Date Relative Relative
Value Prediction Prediction
Error Error
January 84430 84513 0.098% 87103 3.166%
February 89034 90054 1.146% 86573 2.764%
March 92756 92909 0.165% 88783 4.283%
April 83305 84457 1.383% 81609 2.035%
May 87915 87628 0.326% 84495 3.890%
June 85074 82640 2.861% 80275 5.641%
July 83303 81281 2.428% 79057 5.097%
August 85770 82046 4.341% 80125 6.582%
September 76990 75036 2.538% 73493 4.542%
October 76826 78442 2.103% 76581 0.318%
November 79043 77748 1.638% 75853 4.035%
December 77506 75615 2.439% 74394 4.015%
It can be seen from Table 2 that the A-LSTM model and BPNN model in this work both have good
performance in prediction for the monthly new cases of hepatitis B. Moreover, according to the
evaluation indexes in Table 3, A-LSTM model is superior to BPNN model in terms of RMSE, MAPE,
4CMSA 2021 IOP Publishing
Journal of Physics: Conference Series 1995 (2021) 012007 doi:10.1088/1742-6596/1995/1/012007
MAE, and R 2 . This indicates that the A-LSTM model proposed in this work effectively extracts the
attention features of the dataset and has a better prediction than the common time series models.
Table 3. The comparison between A-LSTM and BPNN.
Evaluation Indexes RMSE MAPE MAE R2
A-LSTM 1780.495 1.789 1469.208 0.867
BPNN 3519.336 3.864 3246.290 0.482
4. Discussion and Conclusion
We know that the performance of deep learning model is not only determined by the parameters of the
model itself, but also closely related to the dataset used for training. The performance of the same model
on different datasets is generally different.
For the optimal model in this work, i.e., A-LSTM model with n 5 , we construct NewDataset,
{( X i' , X i'1 , X i'2 ,, X i'59 ; X i'60 )} . After trained by NewDataset, A-LSTM makes its prediction shown
in Figure 4(a) and the evaluation indexes on different datasets are also shown in Figure 4(b)(c)(d)(e). It
can be found that the predictions of A-LSTM trained by the two datasets both fit the observed values
very well, which means that the model based on attention mechanism has a good ability to extract
features from the dataset and can make a great prediction.
Figure 4. (a) shows the predictions of A-LSTM on different datasets, and (b), (c), (d), (e) represent the
RMSE, MAPE, MAE, R 2 .
In this work, we propose A-LSTM model based on LSTM and attention mechanism, and use the model
to predict the monthly new patients of hepatitis B. The results show that A-LSTM model has an excellent
prediction and performs much better than BPNN and other traditional time series models.
Based on one-dimensional historical data of cases caused by hepatitis B virus, this work forecasts the
short-term monthly new patients in the future. Although we have achieved good prediction results, with
our in-depth research on hepatitis B virus and the progress of hepatitis B treatment technology, we can
incorporate the number of typical complications of hepatitis B into the study, together with the historical
data of hepatitis B to form more suitable dataset, which can be constructed as multiple dimensions of
attention, and make more accurate and extensive prediction of hepatitis B and its complications. This is
also the direction and content of follow-up research.
5CMSA 2021 IOP Publishing
Journal of Physics: Conference Series 1995 (2021) 012007 doi:10.1088/1742-6596/1995/1/012007
Acknowledgments
The research is supported by the Graduate Scientific Research Foundation of Fundamentals Department
of Air Force Engineering University.
References
[1] P. J. García Nieto, F. Sánchez Lasheras, E. García-Gonzalo, and F. J. de Cos Juez 2018 PM10
concentration forecasting in the metropolitan area of Oviedo (Northern Spain) using models based
on SVM, MLP, VARMA and ARIMA: A case study Science of the Total Environment, 753-61
DOI: 10.1016/j.scitotenv.2017.11.291
[2] Lulu Wang, Chen Liang, Wei Wu, Shengwen Wu, Jinghua Yang, Xiaobo Lu, Yuan Cai, and
Cuihong Jin 2019 Epidemic Situation of Brucellosis in Jinzhou City of China and Prediction
Using the ARIMA Model Canadian Journal of Infectious Diseases and Medical Microbiology,
1-09 DOI: 10.1155/2019/1429462
[3] RAN Yangfan and JIANG Hongxun 2018 Stocking Prices Prediction based on Back Propagation
Neual Network and Support Vector Regression Journal of Shanxi University(Natural Science
Edition), 1-14
[4] LIU Tian, YAO Menglei, HUANG Jigui, HUANG Shuqiong, CHEN Hongying, and Hossein
Abbasimehr 2021 A Comparison of the Prediction Effects of Back Propagation Neural Network
Model and Seasonal Autoregressive Integrated Moving Average Model in the Caseload of Class
B Notifiable Diseases in Jingzhou City Chinese Journal of Social Medicine, 109-13 DOI:
10.3969/j.issn.1673-5625.2021.01.028
[5] Huang Meng, Wang Ying, Qin Chuang, Liu Yang, and Li Xue-chao 2020 PM_(10) mass
concentration prediction in Lanzhou based on SVR and BPNN Journal of Lanzhou
University(Natural Sciences), 659-65
[6] LIU Wanwan, SU Yila, WU Ni'Er, and RENQING Dao'Erji 2018 Mongolian-Chinese machine
translation based on LSTM Computer Engineering & Science, 1890-96
[7] YU Xuwen 2020 Speech recognition of Hainan dialect based on deep learning, Hainan
University
[8] Tianxiang Zheng, Shaopeng Liu, Zini Chen, Yuhan Qiao, and Rob Law 2020 Forecasting Daily
Room Rates on the Basis of an LSTM Model in Difficult Times of Hong Kong: Evidence from
Online Distribution Channels on the Hotel Industry Sustainability, 7334 DOI:
10.3390/su12187334
[9] Qiao Liu, Zhongqi Li, Ye Ji, Leonardo Martinez, Zia Ul Haq, Arshad Javaid, Wei Lu, and
Jianming Wang 2019 Forecasting the seasonality and trend of pulmonary tuberculosis in Jiangsu
Province of China using advanced statistical time-series analyses Infection and Drug Resistance,
2311-22 DOI: 10.2147/IDR.S207809
[10] Christopher Olah 2015 Understanding LSTM Networks -- colah's blog Retrieved 2021/4/11 from
http://colah.github.io/posts/2015-08-Understanding-LSTMs/
[11] 2021 Back-Propagation Neural Networks Retrieved 2021/4/6 from
http://murphylab.web.cmu.edu/publications/boland/boland_node17.html
6You can also read