KNOW THY IMPACT IMPROVING PERFORMANCE FOR STUDENTS WITH DISABILITIES - Missouri Department of Elementary and Secondary Education
←
→
Page content transcription
If your browser does not render page correctly, please read the page content below

KNOW THY IMPACT…
IMPROVING PERFORMANCE
   FOR STUDENTS WITH
      DISABILITIES

 Missouri Department
 of Elementary and Secondary Education
KNOW THY IMPACT…IMPROVING PERFORMANCE
FOR STUDENTS WITH DISABILITIES
A presentation for Special
Education Administrator’s
Conference
September, 2014
TarTarA Conference Center
By the Office of Special
Education, Missouri
Department of Elementary
& Secondary Education
Pam Williams, Coordinator,
Special Education Services
Ginger Henry, Director,
Effective Practices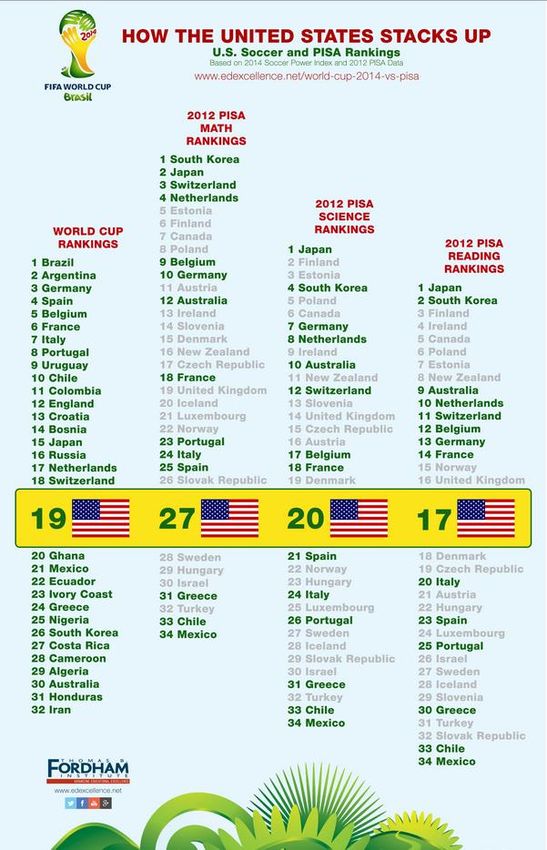
Know Thy Impact—Making
Learning Visible in Missouri
What are we
doing? Where are we going?
Why are we doing
it? How are we
Why do we think getting there?
it will work?
How can I get
started? How are we doing?
Hattie, The Power of Feedback
What are we doing? MISSOURI COLLABORATIVE WORK … The critical elements to drive the improvement efforts necessary to bring about positive results for all students, but especially students with disabilities… High expectations Clear vision A few focused, high-impact goals Frequent progress monitoring Effective use of data Effective teaching/learning practices Collaborative teams focused on data
Missouri Collaborative Work (CW)
Initiated in 2012-13 School Year
Invited buildings in districts from all 9 RPDC regions
Must have a measurable number of SWDs
Not a Priority or Focus building
Not in an unaccredited district
Must be committed to collaborative implementation
Work supported by regional center staff and grants
to participating buildings from Office of Special
Education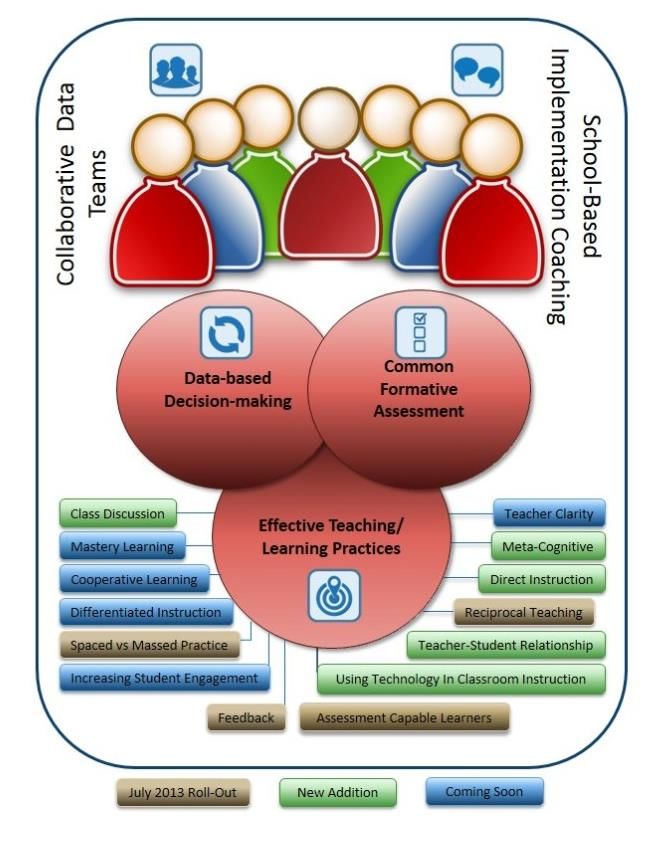
Desired outcome from the Missouri Collaborative Work: Improved
outcomes for all students, but especially for students with disabilities
Teachers and administrators will implement
collaborative data teams to assist one another to:
implement effective teaching/learning practices
develop and administer common formative
assessments that measure the effectiveness of
instruction and student mastery of learning
objectives, and;
use data-based decision-making to guide team
decisions about classroom learning and
instruction.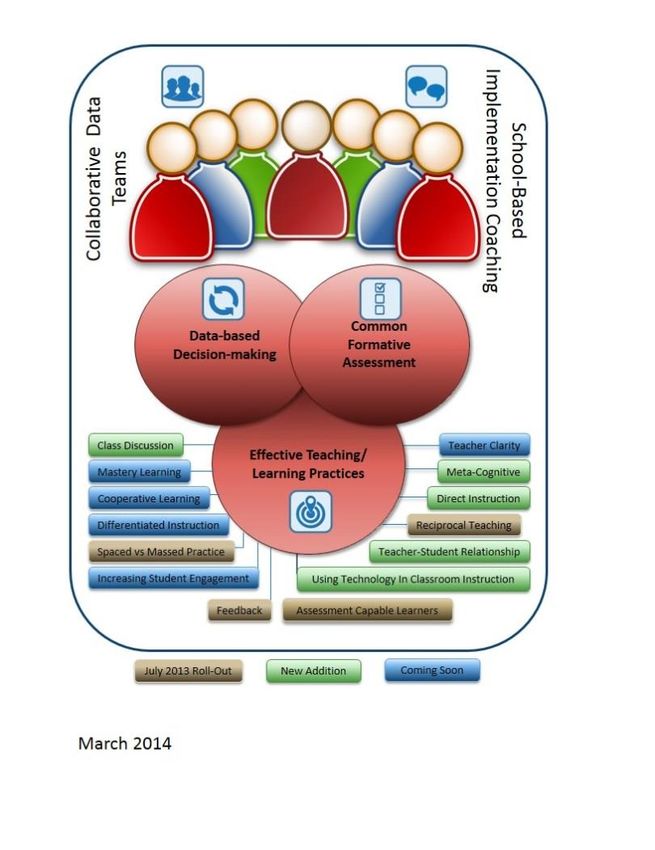
What are the benefits of participation?
Aligned with Missouri Teacher/Leader standards and Missouri
Learning Standards.
Builds a common language in the building.
The collaborative process builds the capacity of the building to conduct
much of its own routine training and learning.
Builds a toolbox of effective teaching/learning practices in each
building to which all teachers can demonstrate a high level of
effectiveness.
All schools will get access to a pool of formative assessments aligned to
the Missouri academic learning standards for use in subsequent years.
Additional funds help defray the costs of teacher time or substitutes.
All content areas will likely benefit.
If implemented with integrity, student achievement will increase at a
faster rate.
More benefits…
Supportive model—Weight Watchers
Helps maintain focus
Improves chances of implementing with high fidelity
Outside support to help solve problems
Will develop regional and state ability to share practices,
lesson plans, formative assessments, etc. which should cut
down on time and costs for districts
Will contribute to building a scalable and sustainable model
to improve outcomes for all students in all districts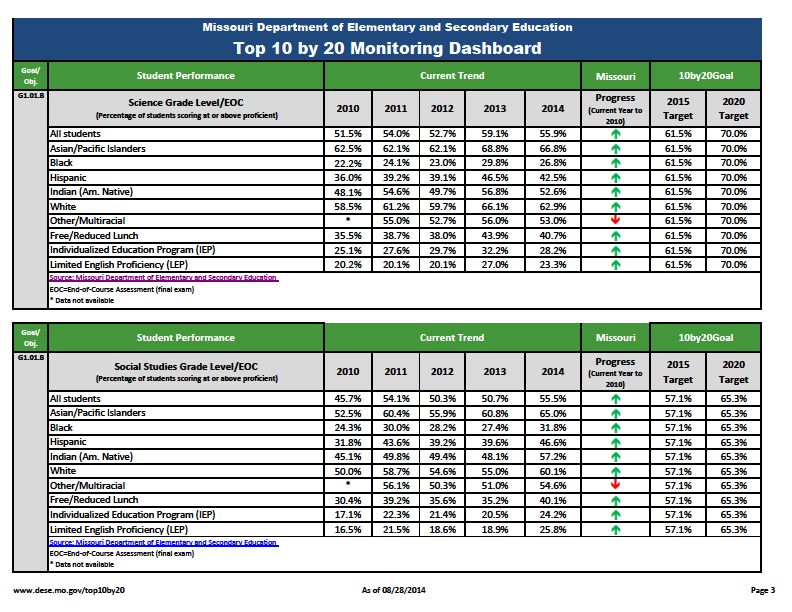
CW District/building participation
9
    Collaborative Work Participation Data by Year
                                                                            2012-2013            2013-2014             2014-2015*
    A. Total Districts Participating                                                  110                 181                          211
    B. Total Buildings Participating                                                  267                 356                          358
       1. Early Childhood Buildings                                                     0                   1                            3
       2. Elementary Buildings (excluding K-8 districts)                              218                 259                          238
       3. K-8 Districts only                                                            1                   1                           11
       4. Middle School Buildings                                                      29                  44                           52
       5. High School Buildings                                                        19                  51                           54
    C. Total Student Enrollment (PK-12 (excluding K-8 districts)                   134383              185384                       175948
       1. Students with Disabilities (PK-21 (excluding K-8 districts)               16902               22277                        21607
    D. Total Student Enrollment (K-8 districts only)                                  570                 538                         1640
       1. Students with Disabilities (K-8 districts only)                              76                  72                          259
    E. Total Staff in Participating Buildings                                        9829               13457                        12920
       1. Regular Education Teachers                                                 8080               11079                        10642
       2. Special Education Teachers                                                 1360                1835                         1766
       3. Administrators                                                              389                 543                          512

    Percentage of Total State-wide Participating
                                                                                                  2012-2013                                                       2013-2014                                            2014-2015*

                                                                                                                                                                                  %
                                                                        Participated          State Total          % Participated            Participated         State Total     Participated Participating       State Total      % Participating
    A. Total Districts Participating                                                  110                 560                         20%                  181                560           32%                211              560                   38%
    B. Total Buildings Participating                                                  267                2235                         12%                  356               2235           16%                358             2235                   16%
       1. Early Childhood Buildings                                                     0                  43                          0%                    1                 43            2%                  3               43                    7%
       2. Elementary Buildings (excluding K-8 districts)                              218                1260                         17%                  259               1260           21%                238             1260                   19%
       3. K-8 Districts only                                                            1                  73                          1%                    1                 73            1%                 11               73                   15%
       4. Middle School Buildings                                                      29                 350                          8%                   44                350           13%                 52              350                   15%
       5. High School Buildings                                                        19                 582                          3%                   51                582            9%                 54              582                    9%
    C. Total Student Enrollment (PK-12 (excluding K-8 districts)                   134383             1024828                         13%               185384            1026756           18%            175948          1024828                    17%
       1. Students with Disabilities (PK-21 (excluding K-8 districts)               16902              120381                         14%                22277             120399           19%              21607          120381                    18%
    D. Total Student Enrollment (K-8 districts only)                                  570               10903                          5%                  538              10775            5%               1640            10903                   15%
       1. Students with Disabilities (K-8 districts only)                              76                1455                          5%                   72               1407            5%                259             1455                   18%
    E. Total Staff in Participating Buildings                                        9829               80264                         12%                13457              78164           17%              12920            78164                   17%
       1. Regular Education Teachers                                                 8080               65980                         12%                11079              63803           17%              10642            63803                   17%
       2. Special Education Teachers                                                 1360               10921                         12%                 1835              10990           17%               1766            10990                   16%
       3. Administrators                                                                389                 3363                      12%                   543                 3371       16%                 512             3371                   15%
    *Enrollment and staff counts projected based on 2013-2014 data
    Data Source: Core Data, as of 6/2/2014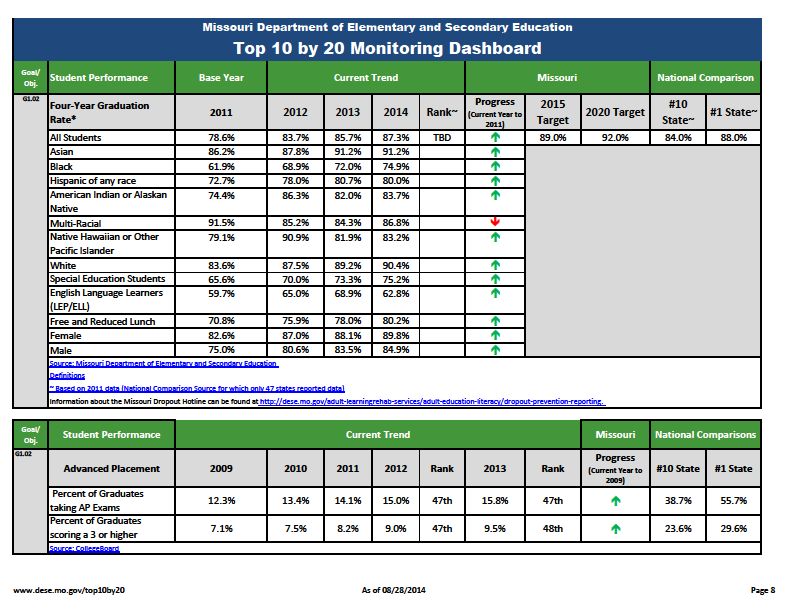
High quality professional development
          content, materials, and structures

                                                   State
                                                 Education
              Training and                        Agency
                  coaching     Regional
 Effective                   Professional
teaching/
                             Development         Shared learning
  learning   Classroom/
 practices                             Fidelity of delivery
               Building                and content
              Educators
Increased
  student           Fidelity of implementation
 learning
Missouri Teaching/ Learning Packages 19 Learning Packages
Why are we doing this?

LET’S LOOK
AT THE
DATA…
Where we were
& where we
are…
a look at the data
Department Vision
The vision of the Missouri Department of Elementary and
Secondary Education is to be one of the Top 10 states in
performance outcomes by the year 2020.
• The vision of the Statewide System
of Support is to provide essential
supports for all Missouri districts
and schools to succeed at levels
which allow the state to reach its
vision.10 by 20 Plan Goals
All Missouri students will
graduate college and career
ready.
All Missouri children will
enter kindergarten prepared
to be successful in school.
Missouri will prepare,
develop, and support
effective educators.
The Missouri Department of
Elementary and Secondary
Education will improve
departmental efficiency and
operational effectiveness.National Assessment of Educational Progress
(NAEP)
Percentage of students scoring at or above proficient
Area Grade % Proficient % Not Proficient Rank
Math 4 41% 59% 24th
Math 8 32% 68% 33rd
Reading 4 34% 66% 22nd
Reading 8 35% 65% 20th
Science 8 40% 60% 18thPerformance of Subpopulations
Communication Arts--MAP
Area Number Tested Proficiency for Proficiency for GAP
Non-Subpop Subpop
All 514,420 54.9%
Black 84,628 59.2% 32.9% 26.3%
IEP 66,117 59.1% 26.4% 32.7%
ELL 13,093 55.7% 23.0% 32.7%
Econ. Deprived 247,536 67.9% 40.8% 27.1%
Not Black, IEP, 222,551 73.1%
ELL, F/RPerformance of Subpopulations Mathematics-
MAP
Area Number Tested Proficiency for Proficiency for GAP
Non-Subpop Subpop
All 526,622 54.0%
Black 86,183 58.8% 29.7% 29.1%
IEP 64,724 57.5% 29.3% 28.2%
ELL 13,878 54.6% 31.8% 22.8%
Econ. Deprived 249,766 66.2% 40.6% 25.6%
Not Black, IEP, 232,074 70.9%
ELL, F/RAnd for all you World Cup fans: How does the US stacks up academically on the PISA versus Soccer Rankings?
Why do we think this will work to
accelerate student achievement?

                          2020
               2015
      2010
Why do we think this will work?
Recent research has shown us that there are some
teaching/learning practices that are highly effective
(Hattie, 2008 & 2011)
Moving Your Numbers work by National Center on
Educational Outcomes (NCEO) shows us there are
certain effective practices that, when implemented
deeply by teachers/leaders, will dramatically impact
student performance
The Collaborative Work is aligned to the Missouri
Teacher/Leader Standards and supports
implementation of the Missouri Learning StandardsWhere’s the evidence?.....
Recent research includes:
Hattie, J. (2008). Visible learning: A synthesis of over 800 meta-
analyses relating to achievement. Routledge.
Hattie, J. (2011). Visible Learning For Teachers: Maximizing Impact
On Learning, Routledge.
Hattie, J & Yates, G. (2014) Visible Learning and the Science of How
We Learn, Routledge.
Google & Utube—John Hattie/Visible Learning
National Center on Educational Outcomes (NCEO), Moving Your
Numbers.
[PDF] Moving Your nuMbers Page 1. 2 Cover Moving Your nuMbers Five Districts
Share How They Used Assessment and Accountability to ... Page 3. MOVING YOUR
NUMBERS ...
www.cehd.umn.edu/NCEO/OnlinePubs/MovingYourNumbers.pdf - 711k - 2013-
05-20 - Text VersionFrom____ to Great Dr. John Hattie: Schools that doubled their performance followed a similar set of strategies that included: Goal setting Analyzing student data Using formative assessments Collectively reviewing evidence on good instruction Using time more productively
John Hattie—”Visible Learning”
“When investigating the continuum of achievement, there
is remarkable generality—remarkable because of the
preponderance of educational researchers and teachers
who argue for treating students individually, and for
dealing with curriculum areas as if there were unique
teaching methods associated with English, mathematics,
and such. The findings from this synthesis apply,
reasonably systematically, to all age groups, all
curriculum areas, and to most teachers.”
What “some” teachers do matters—those who teach in a
most deliberate and visible manner.Hattie’s Eight Mind Frames for Educators: 1. My fundamental task is to evaluate the effect of my teaching on students’ learning and achievement. 2. The success and failure of my students’ learning is about what I do or don’t do. I am a change agent. 3. I want to talk more about learning than teaching. 4. Assessment is about my impact. 5. I teach through dialogue not monologue. 6. I enjoy the challenge and never retreat to “doing my best”. 7. It’s my role to develop positive relationships in class and staffrooms. 8. I inform all about the language of learning.
Effect Size
Effect Size is a common expression of the magnitude of
study outcomes for many types of outcome variables, such
as school achievement. An effect size of d=1.0 indicates an
increase of one standard deviation on the outcome (a
standard deviation increase is typically associated with
advancing children’s achievement by two to three years,
improving the rate of learning by 50%, or a correlation
between some variable and achievement of approximately
r=0.50. In implementing a new program, an d=1.0 would
mean that, on average, students receiving the treatment
would exceed 84% of students not receiving the treatment.Effect Size— pretend this is a standard curve .40
Spaced vs. Massed Practice

                             (.71 effect size)
Feedback
Rank 10th
.73 effect sizeReciprocal Teaching
(.74 effect size)Assessment Capable Learners
(1.44 effect size)
Hattie, J. (2009). Visible Learning. New York: Routledge
Hattie, J. (2012). Visible Learning for Teaachers. New York: RoutledgeMoving your numbers… Districts that have “moved their numbers” for all children have or are engaged in developing district-wide processes that allow for more collective use of relevant data to make smarter decisions, including the ongoing assessment of teaching and learning at the classroom, school, and district levels. These processes include the development, implementation, and ongoing use of teacher-developed formative assessments, and the use of grade-level/departmental/course, and vertical teams to collaboratively score these shared assessments and plan for shared instruction. They also include the use of building and district benchmark assessments. Fullan (2008) states that principals working directly with teachers in the use of data is more than twice as powerful as any other leadership dimension, and Leithwood and Jantzi (2008) found that the reliability for assessing student learning and district decision making was one critical characteristic of effective districts. What Matters Most: Key Practices Guide, National Center on Educational Outcomes
What Matters Most: Key Practices Guide
(National Center for Educational Outcomes)
Key Practice 1: Use Data
Well
Key Practice 2: Focus Your
Goals
Key Practice 3: Select and
Implement Shared
Instructional Practices
Key Practice 4: Implement
Deeply
Key Practice 5: Monitor and
Provide Feedback and
Support
Key Practice 6: Inquire and
LearnDesired outcome from the Missouri Collaborative
Work: Improved outcomes for all students
Teachers and administrators will implement
collaborative data teams to assist one another to:
implement effective teaching/learning practices
develop and administer common formative
assessments that measure the effectiveness of
instruction and student mastery of learning
objectives, and;
use data-based decision-making to guide team
decisions about classroom learning and
instruction.How can you get started?
Participation in CW is currently limited to existing
districts and buildings, HOWEVER…
RPDCs are all trained in the foundation pieces of the
work—
Collaborative Data Teams
Data-based Decision-making
Common Formative Assessments
Your local RPDC can begin working with your
district/building on these foundation pieces (this is the
place to start anyway), THEN
In next few months the effective teaching/learning
packages will be available in DIY form &/or facilitated
by your RPDCCan We Get It Done? I always thought that record would stand until it was broken—Yogi Berra
For more information…
44
See “Where’s the
Evidence” slide
above
http://moedu-
sail.org/
http://visible-
learning.org/
http://movingyourn
umbers.org/what-
matters-mostQuestions?
Hattie—Visible Learning
  INFLUENCE                                               IMPACT
                                                 High   Medium     Low
Ability grouping/tracking/streaming
                                                        Medium     Low
Acceleration (for example, skipping a year)      High
                                                        Medium     Low
Comprehension programs                           High
                                                        Medium     Low
Concept mapping                                  High
                                                 High              Low
Cooperative vs individualistic learning                 Medium
                                                 High              Low
Direct instruction                                      Medium
                                                        Medium     Low
Feedback                                         High
                                                 High   Medium
Gender (male compared with female achievement)                     Low
                                                 High              Low
Home environment                                        Medium
Hattie—continued
INFLUENCE IMPACT
High Medium
Individualizing instruction Low
High Low
Influence of peers Medium
High Medium
Matching teaching with student learning styles Low
Medium Low
Meta-cognitive strategy programs High
High Low
Phonics instruction Medium
High Low
Professional development on student achievement Medium
Medium Low
Providing formative evaluation to teachers High
High Low
Providing worked examples Medium
Medium Low
Reciprocal teaching High
High Medium
Reducing class size LowHattie--continued
INFLUENCE IMPACT
High Medium
Retention (holding back a year) Low
High Medium
Student control over learning Low
Medium Low
Student expectations High
Medium Low
Teacher credibility in eyes of the students High
High Low
Teacher expectations Medium
High Medium
Teacher subject matter knowledge Low
Medium Low
Teacher-student relationships High
High Low
Using simulations and gaming Medium
Medium Low
Vocabulary programs High
High Medium
Whole language programs Low
High Medium
Within-class grouping LowYou can also read