How People Read Books Online: Mining and Visualizing Web Logs for Use Information
←
→
Page content transcription
If your browser does not render page correctly, please read the page content below
How People Read Books Online:
    Mining and Visualizing Web Logs for Use Information

                    Rong Chen1 , Anne Rose2, Benjamin B. Bederson2
                       1
                        Department of Computer Science and Technique
                       College of Computer Science, Sichuan University
                                   Chengdu, 610065, China
                              2
                             Human-Computer Interaction Lab
                             Department of Computer Science
                                  University of Maryland
                              College Park, MD 20770,USA
                   chen-rong@cs.scu.edu.cn, {rose, bederson}@cs.umd.edu

       Abstract. This paper explores how people read books online. Instead of
       observing individuals, we analyze usage of an online digital library of
       children’s books (the International Children’s Digital Library). We go beyond
       typical webpage-centric analysis to focus on book reading in an attempt to
       understand how people read books from websites. We propose a definition of
       reading a book (in comparison to others who visit the website), and report a
       number of observations about the use of the library in question.
       Keywords: Web Log Analysis, Information Visualization, Web Usage Mining,
       ICDL, Reading Online.

1     Introduction

There is a wide range of access to online books from sources such as Google Book
Search 1 , Amazon 2 , our own International Children’s Digital Library (ICDL) 3 , and of
course numerous other digital libraries. While there is significant effort to understand
how people use websites through services such as Google Analytics 4 and various
tools to process web logs, these services fall short when trying to understand how
people read books online.
   The issue is that the existing approaches aggregate data and combine individuals.
They support understanding e-commerce activities such as understanding
“conversions”, and knowing whether certain goals have been reached – such as if a
product has been purchased, or whether a book has been downloaded. You can even
find out how many pages of some content area have been accessed – so it is possible

1 http://books.google.com
2 http://www.amazon.com
3 http://www.childrenslibrary.org
4 http://www.google.com/analytics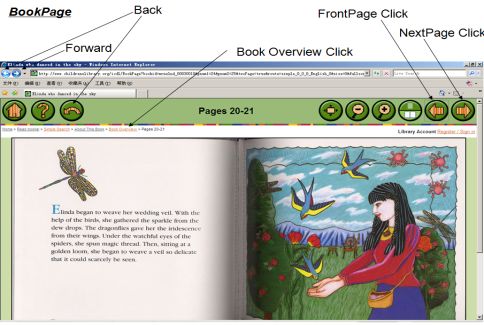
to discover how many pages of a certain book have been read. But it is impossible
using traditional techniques to discover how many individuals have read a book. Or
how many pages of a book are typically read by individuals. Or how many books an
individual reads. In sum, we want to know how people read books online.
   In this paper, we analyze and visualize web log data. While it would be ideal to
actually observe individual reading online, that is not scalable, and any lab effort to do
so would lose the realism of how people actually use web-based digital libraries. So,
we focus on book-centered reading behavior with the actual logs from the ICDL.
   This analysis was done on the public usage of the ICDL from one week (20
October 2008 through 25 October 2008), which represents just over 23,000 unique
visitors, 26,000 visitors, and 336,000 page views.

2     Review of Related Literature

People’s online reading behavior has increasingly become an area of empirical and
theoretical exploration by researchers from a wide range of disciplines, such as
psychology, education, literacy studies information science and computer science.
Different disciplines have diverse ways of probing these questions.
   Many researchers use active observation: Some researchers have done experiments
on understanding changes in reading behavior with paper-reading [1][2]. Jakob
Nielsen’s eye tracking visualization shows that users often read web pages in an F-
shaped pattern: two horizontal stripes followed by a vertical stripe [3].
   Web page centered research is used by some web usage mining tools [4]. Google
analytics gives all visitors’ average reading time and average reading count of pages
in general, but it focuses on each webpage other than each book. So Google analytics
can’t describe the progress of book reading and how never reports what individuals do.
    A number of web log analytics tools exist such as Webalizer, Web Log Expert,
Web Log Suite and WUM [5] to do web log analysis. They are also limited in book-
centered analytics.

3     Visualizing book reading sessions

3.1    Data Preprocessing

Because the ICDL is free and allows anonymous usage, relatively few people register
with the site. Thus, it is difficult to track an individual’s reading progress. But with
a bit of effort, we can analyze and track the book reading session (abbreviated as BRS)
with reasonable accuracy. We extract BRS as follows.
   Step 1: Clean Data: The Apache HTTP web server logs [6] have many records
and a lot of data, but need a lot of processing to be useful for this research. We start
by filtering records whose status is not 200, and the records which reference
embedded image files.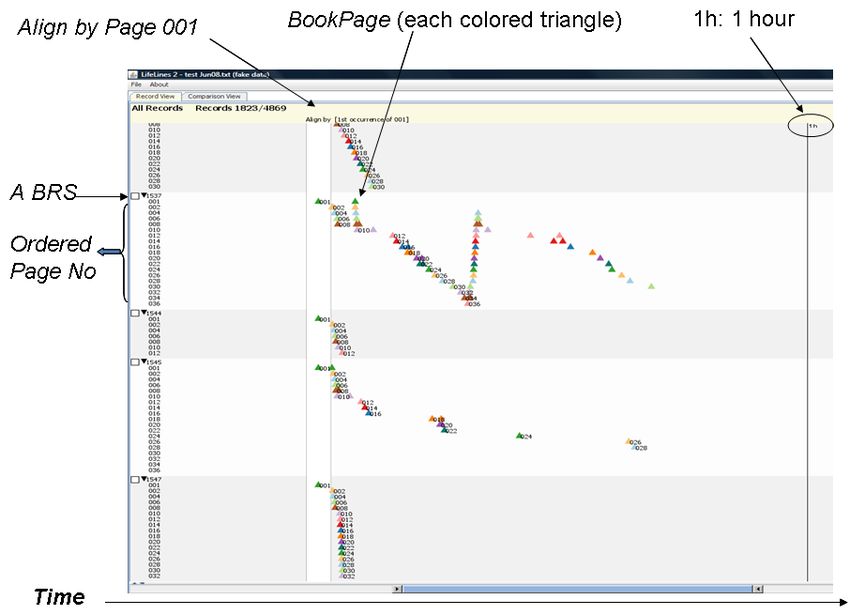
Step 2: Parse URL: the fields of the web log that we use are IPaddress, Agent,
Begintime, Referrer, and URL. The URL has many information separated by “&”. For
example:
/icdl/BookPage?bookid=husblsk_00040002&pnum1=10&pnum2=11&twoPage=true
&route=simple_0_0_blue%20sky_English_0&size=0&fullscreen=false&lang=Englis
h&ilang=English
Step 3: User Identification & Session Identification: It is a complex process to
analyze web logs, but many papers have discussed it [7] [8] [9]. We follow standard
protocol, and define a book reading session as a time series data set, which includes
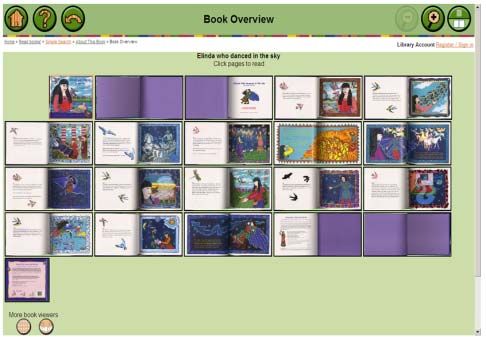
one “Book Reader” web page (Figure 1) and many “BookPage” web pages (Figure 2).
Fig. 1. A sample BookReader page. Fig. 2: A sample BookPage page.
3.2 Visualization of BRS
After the session identification, we can observe how many pages people read and how
much time they spent in each reading session by using visualization software such as
LifeLines. LifeLines supports visual exploration of multiple records of categorical
temporal data and by allows alignment of data on sentinel events, showing intervals of
validity[10] [11].
We use LifeLines to visualize BRS as follows. Each BRS called a record is
vertically stacked on an alternating background colors. It is identified by its ID on
the left, and it’s page number (“Page No”) in this reading session is listed under the
session ID in order. Each BookPage called an “event”) appears as colored triangle
icons on the timeline in the middle of the main display area. The beginning time of
the first event (Page 001) are aligned vertically.
Fig. 3. This is part of one book’s BRSs, includes five book reading sessions .The first BRS
on the top spends about 5 minutes on a whole book. The second BRS reads the whole book,
then goes back over each page, and reads the entire book a second time more slowly. The third
BRS only looks at the first six pages quickly, and then leaves. The fourth BRS looks at the
entire book, but there are significant pauses after every few pages. Over one hour is spent on
this book. The fifth one looks at every page in the book, but does this so quickly that the entire
book is scanned in just one minute.

Fig. 4. There are 12 BRSs, each of which includes only a few book pages.             They each
start at the beginning of the book, and then leave relatively quickly.
Seeing this different kind of reading behavior brings us to a key question – which
is what do we mean to “read a book” online? Clearly there are many different styles.
Some sessions clearly represent reading and some clearly do not. So, what do we do?

4     Definition of RBRS – Real Book Reading Session

  In this part, a quantitative analysis describes BRS and we create a definition for the
purposes of analysis for what it means to actually read a book – which we call a Real
Book Reading Session (RBRS).

4.1    Data Aggregation

   We aggregate the detailed page-level reading data into session-level data. Each
record in the session-level data contains one session. Their attributes are listed in
Table 1.
Table. 1. Attributes of Session
       Attribute Name             Explanation
       Sessionno                  Session number
       Bookid                     The ID of the book being read
       isTwoPage                  True if the book is viewed in two-page mode
       #Readpages                 Total pages read in the session
       SpendTime                  Total time elapsed in the session
       #DistinctReadpages         Total distinct pages read in the session
       ScanCount                  Number of scans in the book
       BookStyle                  The style of the book
       ReadPercent                The percentage of the book read in the session

4.2    RBRS Definition

For the purposes of this study, we need to distinguish between “reading” a book and
only looking at it. While it is clear that if every page is looked at for a reasonable
time, that is considered reading, it is difficult to draw a clear boundary between
reading and non-reading. For example, if someone reads ¾’s of the pages of a book,
while skipping the introductory and ending matter, most people would probably
consider that to also be reading the book. What if they skipped two chapters in the
middle? Since this is a subjective decision, and our primary purpose was to
distinguish people that were doing some reading compared to those that weren’t, we
decided on a simple and unambiguous definition.
   We define a book to be considered read if an individual has looked at more than
half of the pages of the book. Therefore, a real book reading session (RBRS) is
defined as a book reading session whose ReadPercent is larger than 50%, where
ReadPercent is the number of distinct pages read, normalized by the total number of
pages in the book.
1800
1600
1400
1200
#Sessi o
1000
800
600
400
200
0
0%
%
%
%
%
%
%
%
%
20
90
30
40
50
70
60
80
10
%~
%~
%~
%~
%~
%~
%~
%~
%~
10
20
30
40
50
60
70
80
90
Read Per cent age Range
Fig.5. #Session vs. Read Percentage. The number of reading sessions (BRS) that represents a
user reading the indicated percentage of pages. There is a low value (near 50%) in the figure
which motivated us to pick 50% as the number to specify the RBRS cut-off.
250
200
150
#Book
100
50
0
0%
20 %
30 %
40 %
50 %
60 %
70 %
80 %
90 0%
10 %
20
30
40
50
60
70
80
10
10
9
%~
%~
%~
%~
%~
%~
%~
%~
0~
%~
Read Percent age Range
Fig.6. #Book vs. Read Percentage. Each bar shows the number of books that had the indicated
percentage of pages looked at in a reading session.
We collected 21,060 sessions, in which 900 books were visited by users. The
numbers of sessions, grouped by ReadPercent are shown in Figure 5. We chose the
turning point (50%) in this curve to be the threshold in the definition of RBRS.
Based on the definition above, only 1,197 sessions out of the 21060 were RBRS, in
which 331 books were read more than 50%.
5 Web Usage Analysis
Using the well-defined RBRS metric, more data analysis can be done. The
following analysis is based on the 1,197 real book reading sessions and 331 books.
We also discuss the implication of the following observations.Fig.7. The Real Reading Book’s Distribution. This shows which books are read how much
over the analysis period. For example, it shows that the book “the Blue Sky” (whose
ID is “husblsk_00040002”) was read in 90 sessions and represents 7.1% of the books
identified as being read), and it is the most frequently read this week.
medi an spent t i me on page
120
100
80
60
40
20
0
3
9
12
37
55
62
68
82
89
90
91
91
93
0
0
0
0
0
0
0
0
0
0
0
0
0
0
3
10
10
t he amount of t ext on page
Fig.8. This shows the median spent time correlated with the amount of text on page, for the
book “Three Little Pigs” (whose ID is stor_001500083). It shows that the time spent on each
page is positively correlated with the amount of text on that page.
By analyzing the relationship of total text and spend time on page, we can learn how people
spend their time on online book reading.
6 Summary
This paper has analyzed and visualized web log data, with the purpose of studying
online reading behaviors. Instead of observing individuals, which is artificial and
not scalable, we chose to focus on book-center reading behavior with the actual web
logs. We have defined book reading quantitatively and analyzed web usage based on
the definition.In the future, with more visualization and data mining approaches, a more in-depth
statistical analysis of ICDL logs and user behavior should be explored.
7 Acknowledgements
We appreciate the University of Maryland’s HCIL for the visualization tools, and
to Chang Hu, Alexander Quinn, Taowei David Wang and Cody Dunne for their
comments and help with this work.
References
1. Liu, Ziming. : Reading behavior in the digital environment Changes in reading behavior
over the past ten years. Journal of Documentation, Vol 61,pp 700-712.( 2005)
2. O’Hara, K., Sellen,A.: A comparison of reading paper and on-line documents. In
Proceedings of Human Factors in Computing Systems(CHI 97), ACM Press, pp 335-
342.(1997)
3. Jakob Nielsen.2006.F-Shaped Pattern For Reading Web Content
http://www.useit.com/alertbox/reading_pattern.html
4. Srivastava, J.,Cooley ,R., Deshpande M., and Tan P.N.: Web Usage Mining: Discovery and
Applications of Usage Patterns from Web Data. ACM SIGKDD Explorations Newsletter.
ACM Press, New York, NY, USA. ( 2000)
5. http://hypknowsys.sourceforge.net/wiki/The_Web_Utilizat
6. http://httpd.apache.org/docs/1.3/logs.html#common
7. Cooley, R., Mobasher, B., and Srivastava, J.: Data Preparation for Mining World Wide Web
Browsing Patterns. In J. Knowledge and Information Systems,pp.5.32,vol.1,no.1.(1999)
8. Wu,K.-L,Yu,P.S.,Ballman,A.1998.: Speed tracer: a web usage mining and analysis
tool.IBM Systems Journal;Vol.37 Issue 1,p89.( 1999)
9. Yang, Z.L., Wang Y.T., and Kitsuregawa M.: An Effective System for Mining Web Log.
LNCS 3841,pp.40-52.( 2006)
10. Plaisant,C.,Milash,B.,Rose,A.,Widoff,S.,Shneiderman,B.:Lifelines:visualizing personal
histories. Proc. CHI.( 1996)
11. Wang, T.D., Murphy S., Plaisant,C.: Aligning Temporal Data by Sentinel Events:
Discovering Patterns in Electronic Health Records. Proc.CHI 2008. ACM press, N.Y.(
2008)You can also read