AGRICULTURAL POTENTIAL ASSESSMENT OF MAYFIELD X52 - PROPERTY: PORTIONS 117, 118, 124, 132 AND 248 OF THE FARM PUTFONTEIN 26-IR, EKURHULENI METRO.
←
→
Page content transcription
If your browser does not render page correctly, please read the page content below
Page 1

PROPERTY: PORTIONS 117, 118, 124, 132 AND 248
OF THE FARM PUTFONTEIN 26-IR, EKURHULENI METRO.

AGRICULTURAL POTENTIAL ASSESSMENT
         OF MAYFIELD X52

                               Compiled by
                               Dr Andries Gouws
                               Index

January 2020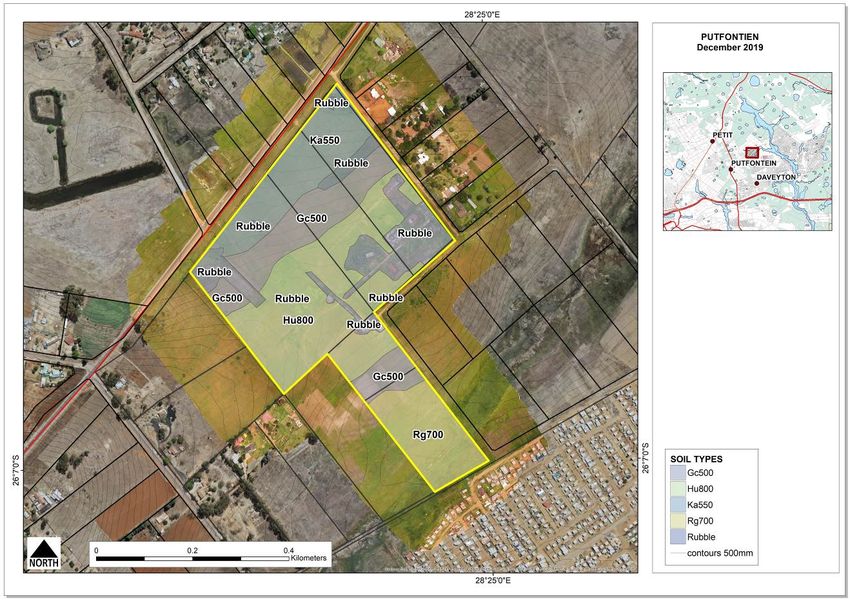
Page 2

CONTENTS
1         Background ..................................................................................................................................................................... 3
    1.1       Terms of Reference .............................................................................................................................................. 3
    1.2       Proprty description .............................................................................................................................................. 3
    1.3       Method ..................................................................................................................................................................... 4
2         Present land uses .......................................................................................................................................................... 5
3       Natural resources .......................................................................................................................................................... 6
    3.1      Climate ...................................................................................................................................................................... 6
        3.1.1       Rainfall ............................................................................................................................................................ 6
        3.1.2       Temperature ................................................................................................................................................. 6
        3.1.3       Wind ................................................................................................................................................................ 6
        3.1.4       Growing season........................................................................................................................................... 6
    3.2      Soil .............................................................................................................................................................................. 6
    3.3      Water ......................................................................................................................................................................... 7
    3.4      Vegetation ............................................................................................................................................................... 8
4         Land use capability ....................................................................................................................................................... 8
    4.1       Agricultural potential .......................................................................................................................................... 8
    4.2       Land use capability of the site ......................................................................................................................... 9
5       Socio-economic attributes ..................................................................................................................................... 10
    5.1     Production constrints ....................................................................................................................................... 10
    5.2     Contribution of this land related to surrounding activities .............................................................. 11
    5.3     Summary ............................................................................................................................................................... 11
6         Conclusions .................................................................................................................................................................. 11
7       Addenda ........................................................................................................................................................................ 12
    7.1      Sources of information .................................................................................................................................... 12
    7.2      Observation positions ...................................................................................................................................... 12
    7.3      Capability classification ................................................................................................................................... 13
        7.3.1    Terrain factors ........................................................................................................................................... 13
        7.3.2    Climatic factors ......................................................................................................................................... 14
    7.4      Photos .................................................................................................................................................................... 15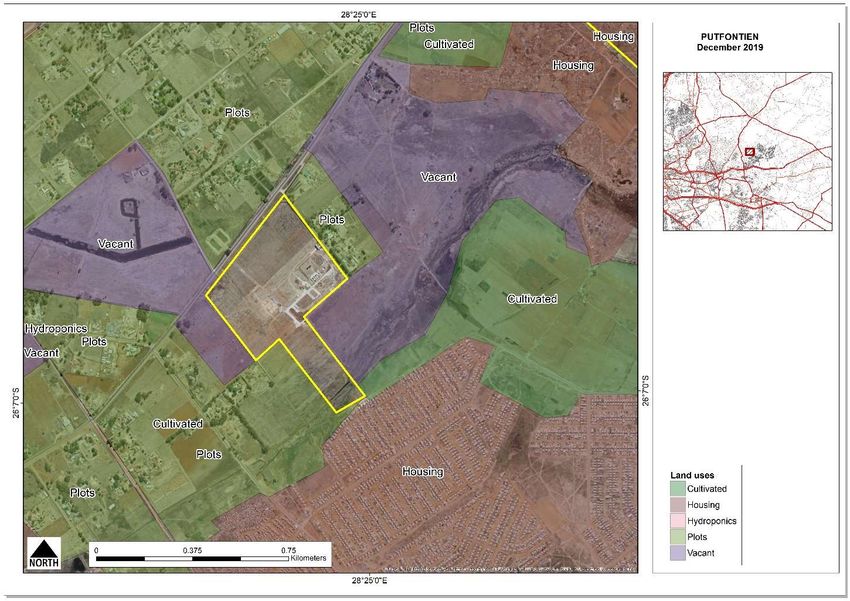
Page 3
1 BACKGROUND
1.1 TERMS OF REFERENCE
Index was appointed by GALAGO ENVIRONMENTAL to do an agricultural study for the
proposed Mayfield Extension 52.
The objective of the study is to determine the agricultural potential of the site.
1.2 PROPRTY DESCRIPTION
Property: Portions 117, 118, 124, 132 and 248 of Putfontein 26-IR, Ekurhuleni Metro.
These properties are 22,1 hectares.
The site is located just north of Daveyton in the Ekurhuleni Metro.
Figure 1. Locality of Mayfield X52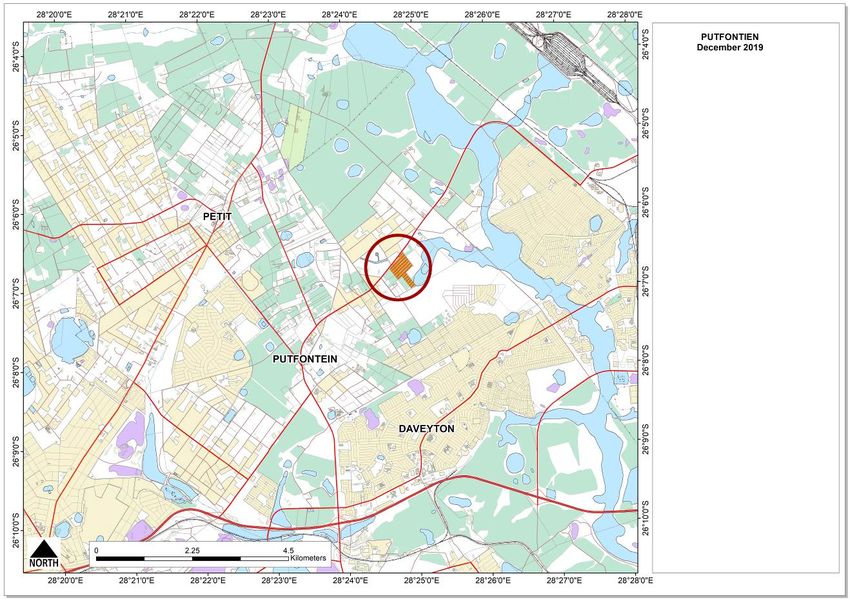
Page 4

1.3 METHOD
The focus of this study is to evaluate the agricultural potential of the site.
A drone took some 200 photos at a low altitude, and by a photogrammetry process,
generated a high resolution orthophoto. This photo was used as base map to identify
vegetation and soil patterns as well as to identify land uses.

OBSERVATIONS
A large number of observations were made of which 40 were photographed. Positions are
indicated in the addenda.

    Figure 2. Observation points

LAND USES
Existing land uses were mapped based on high-resolution aerial photos.

SOILS
A detailed level survey was done on 7 January 2020. Soil patterns were identified from the
orthophoto and then confirmed and/or adapted by field observations. Soil types were
described by using the Taxonomic system for RSA (Soil Working group, 1991).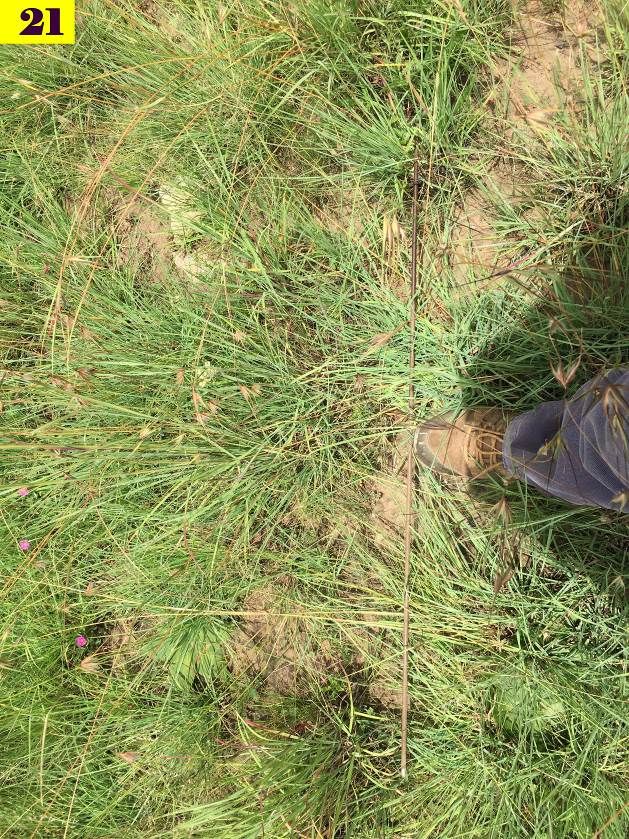
Page 5

WATER
Watercourse boundaries were delineated from soil observations and from the
orthophotos.

VEGETATION
The plant species were identified from field observations and the grazing capacity as
indicated by the Department of Agriculture.

2 PRESENT LAND USES
REGIONAL
The land to the south is residential. This property and much of the surrounding land is under
extreme pressure from land invasions for housing purposes.
North east is some cultivated farmland, the balance are smallholders that generally use
the properties only for residential purposes. Large tract are vacant and used for informal
grazing by the residents of Daveyton.

    Figure 3. Regional land uses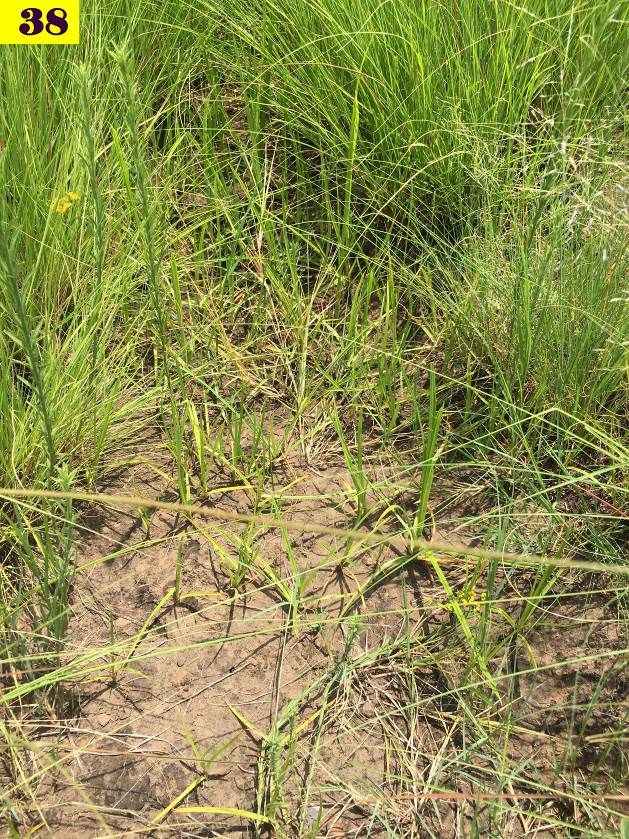
Page 6
LAND USE ON THE PROPERTY
The size of the properties is 22,1 hectares.
There is a small portion of land along the river that is cultivated.
The balance is strewn with rubble or is vacant and is used as opportunistic grazing by
residents of Daveyton
3 NATURAL RESOURCES
3.1 CLIMATE
3.1.1 RAINFALL
The rainfall is typical of the Highveld’s summer rainfall pattern, where more than 80% falls
from October through to April. An average of 715 mm rains per year, of which 585mm are
considered as effective rainfall during the active growing period that spans from October
to March. The rainfall is used to calculate crop yield.
3.1.2 TEMPERATURE
The area experiences severe frost, which occurs frequently from mid-April to as late as
September. Occurrence of frost has to be considered in crop selection. The summers are
mild where temperatures above 320C are seldom reached. The highest average
maximum temperature of 25.30C occurs in December. The average minimum
temperature of 10,50C occurs in June and July.
3.1.3 WIND
Wind with moderately high speeds occurs from late winter to early summer. Wind damage
to field crops is not expected but damage to deciduous fruit is common.
3.1.4 GROWING SEASON
The growing season commences in early October when precipitation exceeds 50% of
transpiration. This lasts until the beginning of April. The dry season with a rain deficit lasts for
4 months of the year. The winter period is dry with little or no vegetative growth.
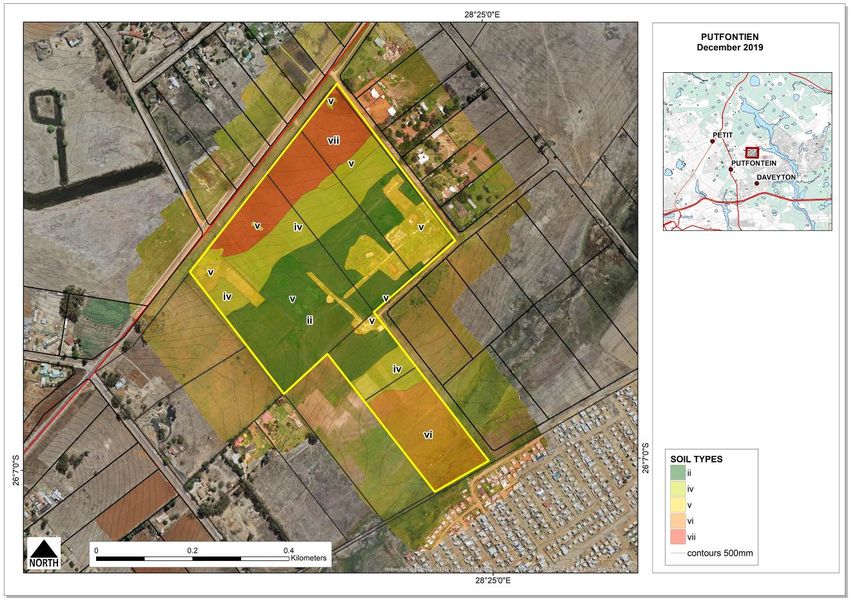
3.2 SOIL
Observations were made through soil auger and probe. The underlying rock is tillite or
dolomite. The soil is generally moderately deep yellowish, reddish and dark brown
coloured with a sandy, clay loam texture. The dominant soils found on the site are
discussed below.
Table 1. Soil types
Map unit Description Size (ha)
Hu800 Deep, reddish sandy loam soil with poorly developed structure. It is 7,77
free of mottles and course fragments. Classified as Hutton, Clovelly.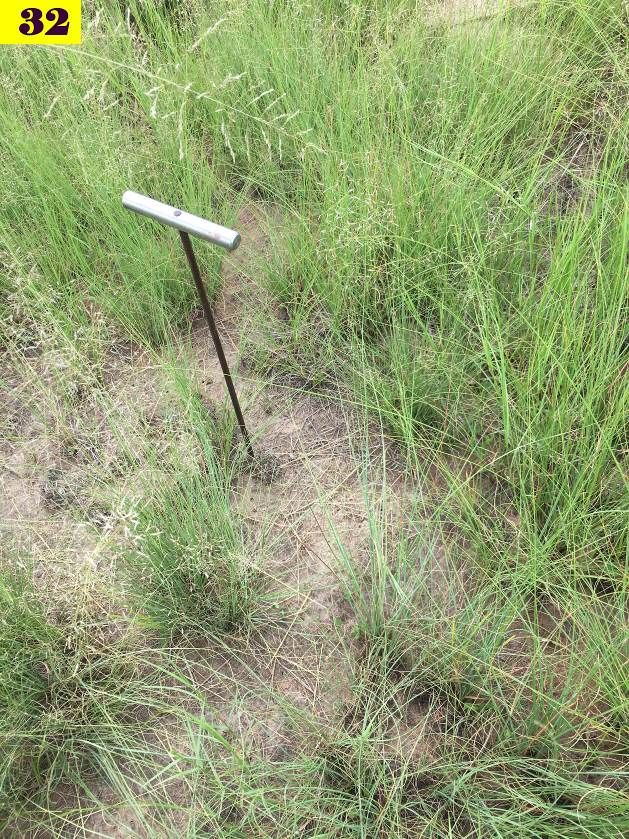
Page 7

 Map unit       Description                                                         Size (ha)
 Gc500          Shallow to moderately deep dark grey sandy topsoil that overlies         4,05
                yellowish brown subsoil. The deeper subsoil is ferricrete, with an
                abundance of brown nodules. Classified as Glencoe, Avalon,
                Dresden.
 Rubble         Consists of building rubble on Hutton or Glencoe soils. These soils      3,78
                are arable but because of the high reclamation costs, has a low
                potential for crop production.
 Ka550          The soils are shallow and water saturated in the deeper layers.          3,74
                Classified as Katspruit, Longlands, and Pinedene.
 Rg700          Deep heavily structured soils classified as Rensburg.                    2,87
                The soil is dark grey or black with a clay texture.
 TOTAL                                                                                  22,21

    Figure 4. Soil map

3.3 WATER
There is no surface water on the farm that can be made available for irrigation. Crops will
rely on rainfall.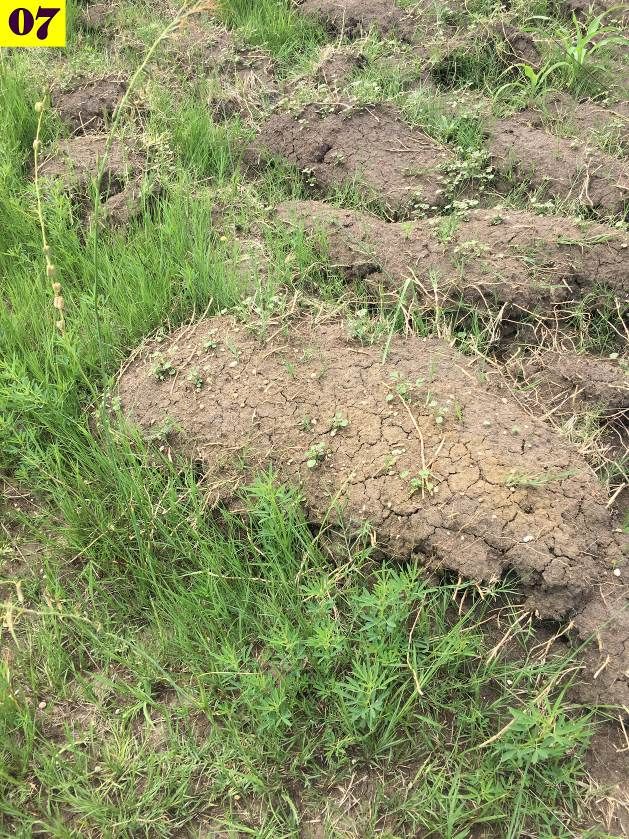
Page 8 3.4 VEGETATION Some of the north-eastern part of the property has been transformed and consists of construction rubble or partially built houses. Cultivation occurred on parts of the land more than 10 years ago and has since reverted to grassland. According to the Department of Agriculture, it is then considered as virgin land and it will require authorisation to cultivate. The south-eastern part is wetland. Dominant species found are typical grassland grasses such as Cymbopogon pospischilii, Eragrostis, Panicum, Themeda and Tristachya leucothri. The dominant wetland species found along the watercourse are Phragmites australis and Typha capensis. The grazing capacity of the land for livestock is estimated by the National Department of Agriculture as 5 hectare per LSU. The property, therefore, can accommodate 4 medium framed cattle. 4 LAND USE CAPABILITY 4.1 AGRICULTURAL POTENTIAL Land capability classes are interpretive groupings of land with similar potential and limitations, or similar hazards. Land capability involves consideration of: Difficulties in land use owing to physical land characteristics, The risks of land damage from erosion and other causes; and Climate. The classic eight-class land capability system (Klingebiel & Montgomery, 1961) was adapted for use with Agriculture Geographic Information System (AGIS) in South Africa. Land capability is classified according to guidelines published by the National Department of Agriculture in AGIS. Land Capability is determined by the collective effects of soil, terrain and climate features and shows the most intensive long-term use of land for rain-fed agriculture. At the same time, it indicates the permanent limitations associated with the different land-use classes (refer to Table 2). Order A: Arable land – high potential land with few limitations (Classes i and ii) Order B: Arable land – moderate to severe limitations (Classes iii and iv) Order C: Grazing and forestry land (Classes v, vi and vii) Order D: Land not suitable for agriculture (Class viii)
Page 9
Table 2. Land capability classes – intensity of land uses
LAND CAPABILITY Grazing and Forestry Crop production
Order Class Wildlife Forestry Veld Pastures Limited Moderate Intensive Very
i
A
ii
Arable
iii
B
iv
C v
Non vi
arable vii
D viii
Note: the shaded area indicate the suitable land use
4.2 LAND USE CAPABILITY OF THE SITE
Specifically regarding classification of the subject site:
Class ii (high potential land) is deeper than 800mm and is arable;
Class iv is arable but with a low potential. It consists of Glencoe or shallow Avalon soils;
Classes v to vii are not arable and was classified as building rubble and soil with
wetland plants, Dresden or Rensburg;
Class vii is not arable and only suitable for grazing.
Figure 5. Land use capability of the site
Page 10
Table 3. Land use capability of the site
Soil Area Description
Mechanisation
Type (ha)
Capability
Drainage
Texture
Erosion
Depth
Flood
Hazard rating
Hu800 ii 7.77 Arable, High potential 0 0 1 1 2 0
Gc500 iv 4.05 Arable, low potential 0 0 3 1 3 0
Rubble v 3.78 Not arable 0 0 5 1 3 2
Rg700 vi 2.87 Not arable, low potential 2 0 2 2 5 0
Ka550 vii 3.74 Not arable, very low potential 0 0 5 2 5 0
In summary, the land use capability is as follows:
High / medium potential arable land: 7,77 ha
Low potential arable land: 4,5 ha
Very low and none: 10,39 ha
5 SOCIO-ECONOMIC ATTRIBUTES
5.1 PRODUCTION CONSTRINTS
According to farmers in the region, poverty and vandalism is rife and commercial farming
near impossible.
The main attributing factors to the present farming environment are:
1) Theft and vandalism because of its proximity to Daveyton and the informal
settlements (which are their direct neighbours);
2) There are many, many cattle that scavenge in the open spaces around the town.
Due to the prevalent theft of the fences, damage to crops is severe and has caused
most of the local farmers to cease replacing fences. The end result is that the crops
yield projected by the Department of Agriculture is hardly ever achieved.
The average yield of some crops produced in the area is as follows:
The arable area is 7,7 hectares;
Average maize yield is 3,7 t/ha; 1
Average soya yield is 1,5 t/ha;
1 AGIS, Department of AgriculturePage 11
5.2 CONTRIBUTION OF THIS LAND RELATED TO SURROUNDING
ACTIVITIES
Commercial farming is practiced at a loss, and therefore does not contribute to the local
or regional economy. This property is vacant and used by township dwellers as informal
grazing.
5.3 SUMMARY
There is severe shortage of housing land in this specific area, as is testament by invasions
that have already taken place around Daveyton.
The impact of the above is that commercial farming is no longer viable.
6 CONCLUSIONS
North east of the site is some cultivated farmland, the balance are smallholders that
generally use the properties for residential purposes. Large tract are vacant and used for
informal grazing by the residents of Daveyton.
Land use on the property
The property size is 22,1 hectares.
There is a small portion of wetland soils that is cultivated along the river.
The balance is strewn with rubble or is vacant and used as grazing.
The soil is generally moderately deep yellowish, reddish or dark brown coloured with a
sandy or clay loam texture. There is no surface water on the farm that is available for
irrigation. Crops will rely on normal rainfall.
The north-eastern part of the property has been transformed and consists of construction
rubble or partially built houses. Some cultivation has taken place more than 10 years ago
and has since reverted to grassland. The south-eastern part is wetland.
In summary, the land use capability is as follows:
High potential arable land: 7,8 ha
Low potential arable land: 4,5 ha
Very low and none: 10,4 ha
According to farmers in the region, poverty and vandalism is rife and commercial farming
near impossible.
The size of the property is such that it can only accommodate 4 cattle; only 7,8 hectares
that is arable.
There is only 7,8 hectares that can be considered as arable with high and medium
potential of cultivation. The balance has low potential and is only suitable as grazing.
This property is too small to be considered as a viable farming unit.Page 12
7 ADDENDA
7.1 SOURCES OF INFORMATION
Criteria for high potential agricultural land in South Africa, Department of Agriculture,
Directorate Land Use and Soil Management, 2002.
Grondklassifikasie Werkgroep, 1991. Grondklassifikasie, 'n Taksonomiese sisteem vir
Suid Afrika, Departement van Landbou-ontwikkeling, Pretoria.
Department of Agriculture. Grazing capacity. Development of Agricultural Land
Framework Bill , 2016
WRC, 2003 South African Atlas of Agrohydrology and Climatology, Water Research
Commission
Anneliza Collett, 2008. The determination, protection and management of high
potential agricultural land in South Africa with special reference to Gauteng.
Submitted in partial fulfilment of the requirements for the degree M.Sc (Plant Science)
in the Faculty of Natural & Agricultural Science University of Pretoria.
7.2 OBSERVATION POSITIONS
Figure 6. Observation positionsPage 13
7.3 CAPABILITY CLASSIFICATION
Guidelines published on the AGIS website of the NDA was used to determine the capability
of soils and their agricultural potential. These guidelines are discussed below.
Soil properties will determine the soil capability for different intensity of use. This is combined
with terrain factors and climate to determine the land use capability.
The matrix of qualifications is indicated below:
Table 4.Terrain and soil classes constituting soil capability classes i to viii
Soil Capability Terrain Soil factors
class
Flooding Erosion Soil depth Soil texture Internal Mechanical Acidity
Hazard hazard drainage limitations
i F1, F2 E1; E5 D1 T1 W2, W3 MB0 P1
ii F1-F3 E1,E2; E5 D1,D2 T1,T2 W2, W3 MB0 P2
iii F1-F4 E1-E3; E5 D1-D3 T1-T3 W1-W4 MB0-MB1 P2
iv F1-F4 E1-E4; E5 D1-D4 T1-T3 W1-W4 MB0-MB1 P2
v F1-F5 E1-E5 D1-D4 T1-T3 W1-W5 MB0-MB1 P2
vi F1-F5 E1-E6 D1-D4 T1-T3 W1-W5 MB0-MB3 P2
vii F1-F5 E1-E7 D4-D5 T1-T3 W1-W5 MB2-MB4 P2
viii F1-F5 E1-E8 D4-D5 T1-T3 W1-W5 MB2-MB4 P2
The criteria to determine the soil capability for each soil factor are as follows (see figure 7
for details):
Soil depth, texture, internal drainage is based on soil types; and mechanical
limitations.
7.3.1 TERRAIN FACTORS
FLOODING HAZARD
The stream is classified as channelled valley according to the HGM system employed by
the Department of Water Affairs.
The rating for flood hazard is indicated below:
Table 5. Criteria for flooding hazard
Frequency Duration Class description
Class
F1 None None No reasonable possibility of flooding (near 0% chance of flooding in any
year).
F2 Rare Very Flooding unlikely but possible under unusual weather conditions (from
brief near 0 to 5% chance of flooding in any year, or near 0 to 5 times in 100
years). Flooding will last less than 2 days.
F3 Occasional Brief Flooding is expected infrequently under usual weather conditions (5 to
50 times in 100 years). Area flooded for a period of 2 to 7 days.
F4 Frequent Long Flooding is likely to occur often under usual weather conditions (more
than a 50% chance of flooding in any year or more than 50 times in 100
years). Flooding commonly lasts from 7 days to 1 month.Page 14
Frequency Duration Class description
Class
F5 Common Very long Flooding is a regular feature under usual weather conditions and may
last a very long time. Examples are wetlands and active streambeds of
rivers.
7.3.2 CLIMATIC FACTORS
The parameters used are length of growing season, temperature and hazards related to
hail and frost.
Climate conditions will not affect the land use capability.
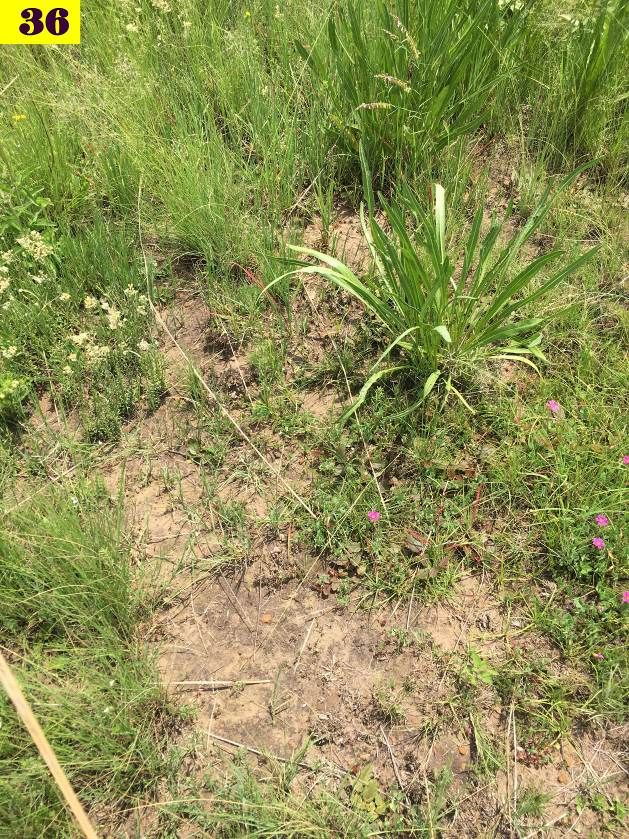
Figure 7. Flow diagram to determine land capabilityPage 15 7.4 PHOTOS
Page 16
Page 17
Page 18
Page 19
You can also read