Integrating Geocode Data from the Google Map API and SAS/Graph
←
→
Page content transcription
If your browser does not render page correctly, please read the page content below
Paper RV007
Integrating Geocode Data from the Google Map API and SAS/Graph®
Shane Trahan, RTI International, RTP NC
Mai Nguyen, RTI International, RTP NC
Inga Allred, RTI International, RTP NC
Preethi Jayaram, RTI International, RTP NC
ABSTRACT
The Google Map API gives developers mapping capabilities to integrate into their own applications. Researchers at
RTI International have integrated the Google API into an easy to use library that can be used by SAS®
programmers as well as other developers. SAS programmers can take advantage of the Google API to perform a
variety of Geographic Information Systems (GIS) calculations by using a set of easy to use function calls in the
DATA step. All the complexities from the underlying technologies to access the online Google API’s are
encapsulated and hidden from the programmer. Together with SAS/GRAPH software, programmers can leverage
the geocoding capability of the Google Map API to graphically represent data in many different ways. This paper
will describe how SAS programmers can take advantage of geocode data obtained through the Google Map API to
create custom SAS/GRAPH maps. Our approach allows for data accuracy and also allows our users of SAS 9.1 to
take advantage of the robust mapping features found in SAS/GRAPH.
Our paper will provide a SAS program showing how to obtain geocode information for specific addresses and plot
them on a SAS/Graph map using SAS 9.1. We will also discuss the technical approach used allowing SAS
programs to access these web based API’s and some of the uses of the information obtained.
INTRODUCTION
SAS/GRAPH software provides developers with robust and powerful functions to create and manage charts, graphs
and maps. Utilizing SAS/GRAPH procedures will bring your data sets to life allowing you to create high impact
presentations and reports as well as giving analysts the ability to visualize their data in many different ways. This
paper focuses on one aspect of the SAS/GRAPH toolset, specifically the GMAP procedure to present geographical
data on a map. In conjunction with SAS/GRAPH’s GMAP procedure, we’ll leverage the RTI Google Map Library
developed by researchers at RTI to get latitude and longitude coordinates of addresses for display on SAS/GRAPH
Maps. This geocode obtained from the RTI Google Map Library has the accuracy down to the street level.
INTEGRATING GOOGLE MAP API AND SAS
RTI has created the RTI Google Map Library using the Microsoft .NET framework enabling programs to use the
Google Map API as a service. Programs that use the RTI Google Map Library can be written in .NET, Java or SAS.
The structure of the library is shown below in Figure 1.
1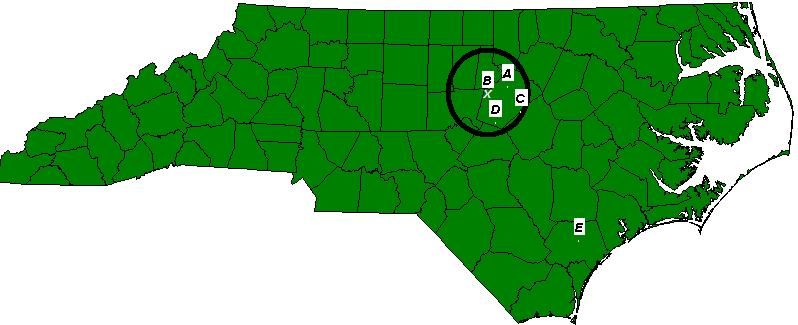
Java Interface
Javascript Handler
Google Map API
.NET Interface
Figure 1 RTI Google Map Library
The RTI Google Map Library consists of several layers built on top of the Microsoft .NET libraries. The Javascript
Handler layer is responsible for all communication with Google servers using the Google Map API. The .NET library
provides the abstraction and class library for .NET GIS applications. The Java Interface consists of proxy classes
bridging Java and SAS applications with the .NET Library.
The SAS JavaObj object provides a programmatic interface for SAS programs to interact with other systems or
programming libraries written in Java. Using the JavaObj, SAS program can easily instantiate a Java object and
access its variables and methods. There have been a number of papers and resources available from SAS and
related conferences providing great details about “how to use JavaObj to extend capabilities of the SAS platform.”
Included below are some simple SAS code snippets as an introduction to the JavaObj for those who are unfamiliar
with this SAS object.
The code snippet below declares a JavaObj object and then instantiates a Java String object with the ‘ABC’ value:
declare javaobj j;
j = _NEW_ javaobj('java/lang/String', 'ABC');
The same can be done in a more compact way:
declare JavaObj j('java/lang/String', 'ABC');
We can easily call the “concat” method on the Java String object and put the concatenated string in a SAS variable:
Length s_out $20;
j.callStringMethod('concat', '123', s_out);
The value of s_out will be equal to ‘ABC123’.
The Delete method should be used to dispose the JavaObj once the task is done:
j.Delete();
RTI GOOGLE MAP LIBRARY JAVA INTERFACE
The Java Interface layer of the RTI Google Map library provides a simple interface allowing SAS programs to easily
use the Google Map API. Currently the Java API consists of 3 main Java classes: GeoCode, TravelDistance and
CrowFlyDistance.
As shown below, the GeoCode class is very simple. The actual complicated work is performed within the .NET
library.
2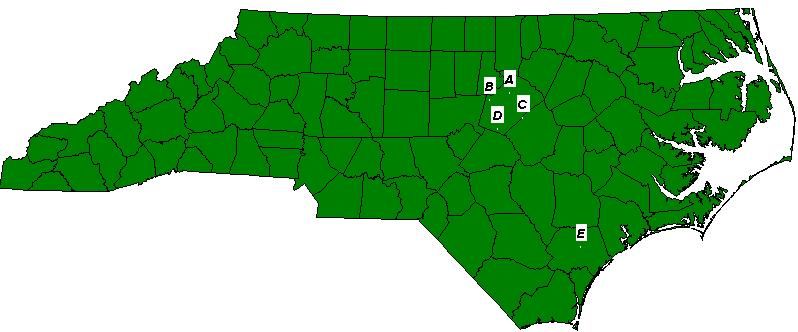
public class GeoCode {
private String address ;
private String status ;
private double latitude ;
private double longitude ;
public GeoCode(){
address = null ;
status = "1" ;
latitude = 0.0 ;
longitude = 0.0 ;
}
public GeoCode(String streetAddress){
this.GetGeoCode(streetAddress) ;
}
public String GetGeoCode(String streetAddress)
{
address = streetAddress ;
this.GetGeoCode() ;
return this.status ;
}
private void GetGeoCode()
{
// Get lat and long coordinate
String progName = "C:\\Projects\\SasGis\\GeoCode4SAS.exe " ;
String param = "\"" + address + "\"" ;
String coordinate = CmdExec.Run(progName + param);
// parse result
String[] s = coordinate.split(",") ;
status = s[0] ;
if (status.compareTo("200") == 0)
{
latitude = Double.parseDouble(s[1]) ;
longitude = Double.parseDouble(s[2]) ;
}
}
public double GetLat() {
return latitude ;
}
public double GetLong() {
return longitude ;
}
public String GetAddress() {
return address ;
}
public String GetStatus() {
return status ;
}
public String GetCoordinate() {
return String.valueOf(latitude) + "," +
String.valueOf(longitude);
}
}
The GeoCode class provides two constructors, the first one takes no parameters and is used to initialize the
instance of the Geocode object. The other constructor accepts an address as a parameter. This constructor will call
3the GetGeoCode method to obtain the geocode immediately.
The GeoCode class provides a public GetGeoCode method to obtain the geocode for a specified address passed in
as an argument. It also includes a small number of getter methods for getting the status code and the coordinates.
EXAMPLES USING THE RTI GOOGLE MAP LIBRARY
To illustrate the uses of the RTI Google Map Library significant to the scope of this paper the following code is used
to obtain both geocode information and the distance values between two points.
OBTAINING GEOCODE INFORMATION
In this example, we demonstrate how the RTI Google Map Library is used to obtain geocode data for an address.
This is a simple 3step process:
1. Create a JavaObj and instantiate the GeoCode Java object from the RTI Google Map Library. The address is
passed to the Java object constructor as a string parameter.
2. Call the GetStatus method on the Java GeoCode object to get the status of the operation.
3. If the status indicates that a geocode was successfully returned, call the GetLat or GetLong method to get the
latitude or longitude value respectively. Alternatively, we can also call the GetCoordinate method to get both
the latitude and longitude in the coordinate format.
libname out 'c:\projects\SasGis';
data temp;
input street1 $ 120 city1 $ 2130 state1 $ 3133 zip1 $ 3438
street2 $ 4170 city2 $ 7180 state2 $ 8184 zip2 $ 8488 ;
datalines;
303 gingergate dr cary nc 27519 1238 Marshall St raleigh nc 27601
1434 Kelly Rd garner nc 27529 334 Minuet Pl raleigh nc 27610;
run ;
data myGeocodedata;
set temp;
length status1 $3 lat1 8 long1 8 coordinate1 $25
status2 $3 lat2 8 long2 8 coordinate2 $25;
/* Declare java object */
declare javaobj j1;
/* Create GeoCode java object */
j1 = _NEW_ JavaObj('GeoCode', street1||city1||state1||zip1);
/* Get status */
j1.callStringMethod('GetStatus', status1) ;
if (status1 = '200') then
do ;
/* Found geocode */
j1.callDoubleMethod('GetLat', lat1) ;
j1.callDoubleMethod('GetLong', long1) ;
j1.callStringMethod('GetCoordinate', coordinate1);
end;
/* Geocode the second address */
j1.callStringMethod('GetGeoCode',
street2||city2||state2||zip2, status2);
if (status2 = '200') then
do ;
/* Found geocode */
j1.callDoubleMethod('GetLat', lat2) ;
j1.callDoubleMethod('GetLong', long2) ;
j1.callStringMethod('GetCoordinate', coordinate2);
end;
j1.Delete();
run ;
4Once the GeoCode object has been instantiated, its API includes the GetGeoCode method that can be used for
geocoding new addresses without having to instantiate a new GeoCode object. This is used to obtain geocode
information for the other addresses in the example.
OBTAINING DISTANCES BETWEEN TWO POINTS
In this section, we demonstrate how to obtain the crowfly distance between 2 locations by using the RTI Google
Map Library. The RTI Google Map API provides a similar pattern for calculating the distance between 2 locations:
1. Create a JavaObj and instantiate the CrowFlyDistance Java object from the RTI Google Map Library. The “from
address” and “to address” are passed to the Java object constructor as parameters.
2. Call the GetStatus method on the Java object to get the status of the operation.
3. If the status indicates that distance was successfully calculated, call the GetMiles method to get distance value.
data distanceData;
set myGeocodedata;
length DistStat $3 CrowFlyDist 8;
if (Status1 = '200' and Status2 = '200') then
do;
declare javaobj j1;
address1 = street1 || city1 || state1 || zip1;
address2 = street2 || city2 || state2 || zip2;
/* Get crowfly distance */
j1 = _NEW_ JavaObj('CrowFlyDistance', address1,
address2);
j1.callStringMethod('GetStatus', DistStat) ;
if (DistStat = '200') then
do ;
j1.callDoubleMethod('GetMiles', CrowFlyDist) ;
end;
j1.Delete();
end;
run;
The distanceData data set will have the Crowfly distance values for the parameters passed in, address1 and
address2.
INTEGRATING SAS/GRAPH AND THE RTI GOOGLE MAP LIBRARY
With the RTI Google Map Library we can now obtain geocodes from street addresses and plot them on
SAS/GRAPH maps.
Although SAS/GRAPH includes major city, county, and state centroid geocode information, there is a substantial
benefit to incorporating highlydetailed geocode information into the SAS system. This detailed information can
assist analysis of epidemiological data such as disease outbreaks, modeling of pollution levels, or the analysis of
traffic patterns for transportation infrastructure improvement. This type of data can be analyzed in SAS then
incorporated into SAS/GRAPH maps for graphical representation. As was discussed in detail above, geocode
address information can be obtained rather easily using the RTI Google API library and imported into a data set for
further analysis.
With a data set of latitude and longitude values we can now easily plot them on a SAS/GRAPH map similar to what
is shown in Figure 2. To begin we must create an annotate data set from the latitude and longitude values and
pinpoint the items on the map and then start merging the information together.
*Create the anno dataset;
data anno;
length function color $8 style text $15;
retain xsys ysys '2' hsys'3' color 'white' line 1 when 'a';
*Obtain a subset of the dataset myGeocodedata;
5set myGeocodedata (keep=DataLabel lat long );
*Start looping through the dataset values and convert to radians;
x=long * constant('pi')/180;
y=lat * constant('pi')/180;
*Add the points into the Annotate dataset;
*Label;
size=2; color='black'; cbox='white';
style="swissbi"; text=upcase(DataLabel); position='2'; output;
*Marker;
size=1; color='white'; cbox='';
text='*' ; position='5'; output;
run;
*Set the MAPS.COUNTIES dataset with the observations that are stored in the
anno dataset;
data MapMerge;
set maps.counties(where=(fipstate(state)='NC')) anno;
run;
*Now that we have set our needed data we want to project the data into the
projected Dataset;
Proc gproject data=MapMerge out=projected dupok;
id county;
run;
*Begin looping through the projected dataset and add the Annotated data to the
Anno Dataset;
data map anno;
set projected;
if when eq 'a' then output anno;
else output map;
run;
*Create the NCarolina dataset which gives us the data to plot the map from;
*The dupok statement will allow duplicates to be displayed since the default
is to overwrite the duplicates;
proc gproject data=maps.counties out=NCarolina dupok;
Where state=37; *Fips code for North Carolina;
Id state county;
run;
quit;
*Set the color pattern for our map to be green;
pattern1 v=ms c=Green;
*Finally, display the map by combining the anno annotation dataset;
proc gmap map=map data=NCarolina;
Id county;
choro state / discrete coutline=black annotate=anno;
run;
quit;
6Figure 2 Plotting Geocode Data
The implementation highlighted here, though simple, can be further extended as the analysis of data is continued.
The simplified example here includes only five points with four points clustered around a specific area and one point
indicating an outlier. To take this implementation a step further we can modify the code to include a radius around
a certain data point (Figure 3). To do this we actually create a polygon using small line segments joined together
giving the appearance of a circle. The code to draw the circle segments is as follows:
*Establish our degree to radian constant;
deg_rad=constant('pi') / 180;
*Pinpoint the center of the circle;
xcen=long; ycen=lat;
size=5; style='me'; color='black';
do degree=0 to 360 by 1;
if degree=0 then function='poly';
else
function='polycont';
y=arsin(cos(degree*deg_rad)*sin(radius/R)*cos(ycen*deg_rad)+
cos(radius/R)*sin(ycen*deg_rad))/deg_rad;
x=xcen+arsin(sin(degree*deg_rad)*sin(radius/R)/cos(y*deg_rad))/deg_rad;
x=x*deg_rad; y=y*deg_rad;
output;
end;
The radius value for the circle is established in the retain statement when looping through the data set so our retain
statement would change to the following:
retain xsys ysys '2' hsys '3' color 'white' line 1 when 'a' radius 25 r 3949.918;
In the above statement, radius is the radius of the plotted circle in miles, the value of r (3949.99) indicates the polar
radius of the earth in miles which is used as a constant to draw an accurate circle on a nonperfect sphere.
Recompiling the code to draw a 25 mile radius circle using point B (X on Figure 3) as the center point, the new map
appears as Figure 3.
7Figure 3 Plotting Geocode Data With A Circle Indicating Given Radius
SAMPLE IMPLEMENTATION
In household survey research we often have a sample of potential respondents with addresses and other
information stored in a database. If the goal of a survey is to find potential respondents in large metropolitan areas
within a 15 mile radius from a city center, the RTI Google API library can be used to find these distances for case
selection. A new data set can be created with the distance information indicating the selected households. Using
the sample code given above you can also plot this information graphically by plotting the geocoded points on a
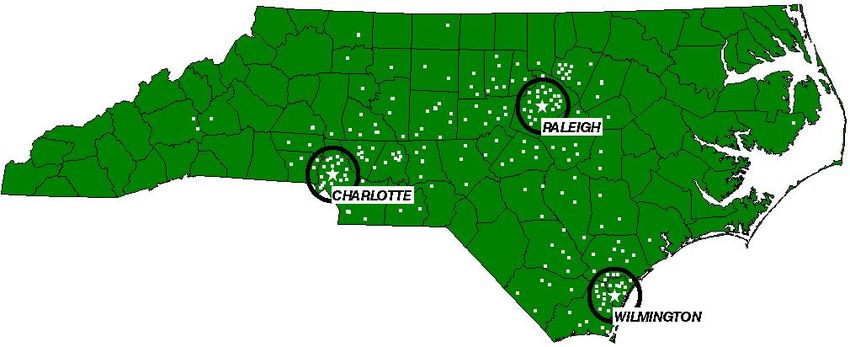
map and then drawing a circle around a specified center point as shown in Figure 4.
Figure 4 Sample Household Survey Implementation
CONCLUSION
We have shown in this paper that not only can the SAS/GRAPH software package using PROC GMAP to create
professional looking maps, we have also shown how to use webbased services to create dynamic content,
specifically using the RTI Google Mapping API Library. Using the RTI Google Mapping API library in conjunction
with the SAS/GRAPH software, we are able to create lightweight SAS programs using dynamic geocode data sets
that are created on the fly. This solution also provides far more accurate geocode information for addresses than
using the ZIP centroid locations currently available in the centroid data set of the SAS/GRAPH package alone. The
implementation presented here incorporates many features of SAS that enable it to interact with many other
platforms including .NET, java and webbased services. As more and more services are moved to the web our
approach to interfacing with these services will increase the capabilities of SAS programmers allowing developers
to expand their applications into powerful tools integrating data from practically anywhere.
8REFERENCES
M, Nguyen, S. Trahan, P. Nguyen, W. Handley. “Geospatial Analysis Using SAS and Google Map API” Proceedings
for SAS Global Forum 2009. March 2009. http://support.sas.com/resources/papers/proceedings09/0152009.pdf.
Zdeb, M. 2002. Maps Made Easy Using SAS. Cary, NC: SAS Press
SAS Institute Inc. 2004. SAS/GRAPH 9.1 Reference, Volumes 1,2, and 3. Cary, NC: SAS Institute Inc.
ACKNOWLEDGMENTS
We would like to acknowledge the editorial skills of Elizabeth Eubanks who helped ensure that the final version of
this paper met the guidelines set forth by SESUG and that the ideas presented here are clear and well presented.
RECOMMENDED READING
Google Inc. 2008 “Google Maps API.” http://code.google.com/apis/maps/.
SAS Institute Inc. 2004. SAS/GRAPH 9.1 Reference, Volumes 1,2, and 3. Cary, NC: SAS Institute Inc.
SAS/GRAPH Map Data Sets. http://www.tau.ac.il/cc/pages/docs/sas8/gref/z2sets.htm
DeVenezia, Richard A, “Java in SAS JavaObj, A DATA step Component Object”
http://www2.sas.com/proceedings/sugi30/24130.pdf
CONTACT INFORMATION
Your comments and questions are valued and encouraged. Contact the author at:
Name: Shane Trahan Name: Mai Nguyen
Enterprise: RTI International Enterprise: RTI International
Address: 3040 Cornwallis Rd Address: 3040 Cornwallis Rd
City, State ZIP: Durham NC 27709 City, State ZIP: Durham NC 27709
Work Phone: 9195415848 Work Phone: 9195418757
Fax: 9195416178 Fax: 9195416178
EMail: srt@rti.org EMail: mnguyen@rti.org
Web: http://www.rti.org Web: http://www.rti.org
Name: Inga Allred Name: Preethi Jayaram
Enterprise: RTI International Enterprise: RTI International
Address: 3040 Cornwallis Rd Address: 3040 Cornwallis Rd
City, State ZIP: Durham NC 27709 City, State ZIP: Durham NC 27709
Work Phone: 9195417072 Work Phone: 9195413934
Fax: 9195416178 Fax: 9195416178
EMail: irb@rti.org EMail: pjayaram@rti.org
Web: http://www.rti.org Web: http://www.rti.org
SAS and all other SAS Institute Inc. product or service names are registered trademarks or trademarks of SAS
Institute Inc. in the USA and other countries. ® indicates USA registration.
Other brand and product names are trademarks of their respective companies.
9You can also read