Q4 2017 Earnings February 21, 2018 - Garmin International
←
→
Page content transcription
If your browser does not render page correctly, please read the page content below

Q4 2017 Earnings February 21, 2018

Safe Harbor Statement
     These materials include projections and other forward-looking statements. These
     statements are based on the current expectations of Garmin Ltd. and are naturally
     subject to uncertainty and changes in circumstances. Forward-looking statements
     include, without limitation, statements containing words such as "proposed" and
     “intends” or “intended” and "expects" or "expected." Any statements regarding
     Garmin’s revenue, operating earnings, Pro Forma tax rate and Pro Forma EPS for
     fiscal 2018, Garmin’s expected segment revenue growth rates, margins, currency
     movements, expenses, pricing, new products to be introduced in 2018 and
     Garmin’s plans and objectives are forward-looking statements. By their nature,
     forward-looking statements involve risk and uncertainty because they relate to
     events and depend on circumstances that will occur in the future. There are a
     number of factors that could cause actual results and developments to differ
     materially from those expressed or implied by such forward-looking statements.
     Other unknown or unpredictable factors could cause actual results to differ
     materially from those in the forward-looking statements. These factors include
     those discussed or identified in the filing by Garmin Ltd. with the U.S. Securities
     and Exchange Commission in its Annual Report on Form 10-K. Garmin Ltd. does
     not undertake any obligation to update publicly or revise forward-looking
     statements, whether as a result of new information, future events or otherwise,
     except to the extent legally required.

1
Business Update

       Cliff Pemble
     President and CEO

2
4th Quarter Financial Review
    Fourth quarter revenue growth and improved gross
      margins contribute to operating income growth

    • Consolidated revenue of $888 million, up 3%

    • Outdoor, marine, aviation and fitness segments
      combined grew 9% and contributed 78% of total
      revenue

    • Gross and operating margin of 56.2% and 20.2%,
      respectively

    • Operating income of $179 million, growth of 12%

3   • GAAP EPS of $0.73 and pro forma EPS of $0.79
2017 Financial Review
        Delivered two consecutive years of revenue
               and operating income growth

    • Consolidated revenue exceeded $3 billion, up 2%

    • Outdoor, fitness, marine and aviation segments
      combined grew 9% and contributed 76% of total
      revenue

    • Gross and operating margin of 57.8% and 21.7%,
      respectively

    • Operating income of $669 million, growth of 7%

4   • GAAP EPS of $3.68 and pro forma EPS of $2.94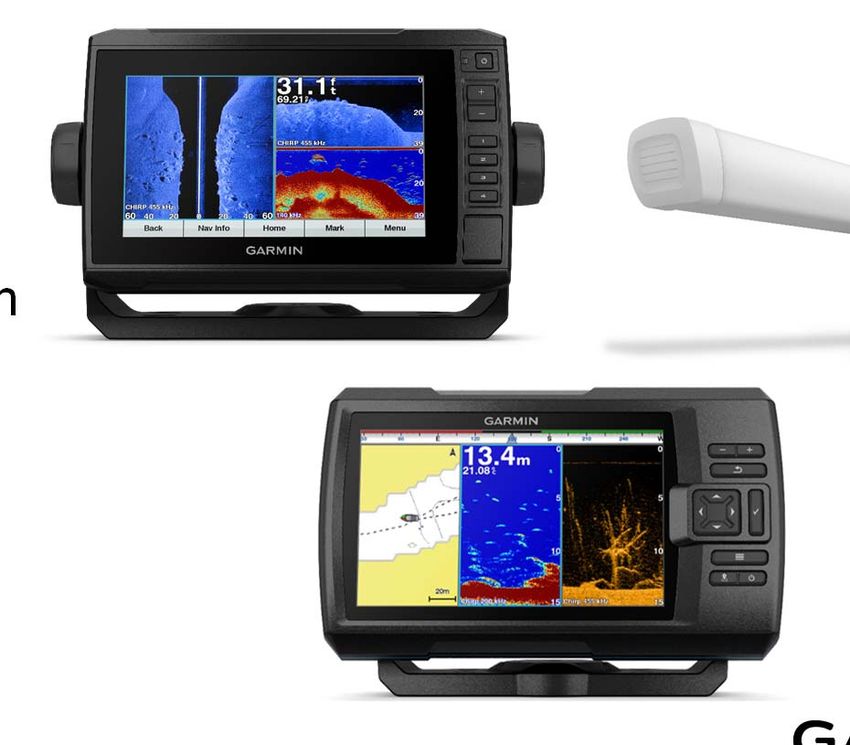
Outdoor
    FY 2017 Business Review
    • Robust revenue growth of 28%; strong
      demand for wearables
    • Gross margin and operating margin of
      64% and 36%, respectively
    • Operating income growth of 36%
    • High engagement in Connect IQ
      delivering over 45M downloads since
      inception
    FY 2018 Outlook
    • Revenue growth of ~13%
    • Continue to capitalize on wearables
      serving a broad range of consumers
    • Strengthen and expand our inReach
      satellite subscription base and market
5     share in adjacent categories
Aviation
    FY 2017 Business Review
    •       Revenue exceeded $500 million, a significant
            milestone, representing growth of 14%
    •       Gross and operating margins at 74% and
            31%, respectively
    •       Operating income growth of 23%
    •       Announced as the avionics provider on the
            Cessna Sky Courier
    •       First in product support for 14 consecutive
            years and won 2 Supplier of the Year Awards
            from Embraer

        FY 2018 Outlook
        •   Revenue growth of ~13%
        •   Supporting OEM partners in the completion
            of aircraft and helicopter certifications and
            system enhancements
        •   Capitalize on market share gains and
6           aftermarket opportunities
Marine
    FY 2017 Business Review
    •   Strong revenue growth of 13%
        with growth across multiple
        product categories
    •   Gross margin of 57%
    •   Operating margin of 13%
    •   GPSMAP selected by Sea Hunt
        Boat Company

    FY 2018 Outlook
    •   Revenue growth of ~18% with both
        organic growth and contributions
        from our recent Navionics
        acquisition
    •   Capitalize on market momentum
        with a strong product lineup
7
        resulting in market share gains
Fitness
    FY 2017 Business Review
    • Revenue declined 7% driven by the rapidly
      maturing market for basic activity trackers
    • Gross and operating margin of 55% and
      19%, respectively
    • Launched several new wearables that
      have been well received by the market
      including the Forerunner 935, vívoactive 3
      and vívofit jr. 2

    FY 2018 Outlook
    • Revenues expected to be flat with
      growth in advanced wearables and
      cycling offset by declines in the basic
      activity trackers
    • Deliver feature-rich products capturing
      new and repeat customers
8
Auto
    FY 2017 Business Review
    • Revenue declined 15%
    • Gross and operating margin of 44% and
      9%, respectively
    • Global PND market share remains strong
    • Solid growth in OEM and other niche
      categories

    FY 2018 Outlook
    • Revenue decline of ~17% due to PND
      category declines
    • Opportunities in OEM, truck, RV and
      camera categories
    • Continue to invest in bringing connectivity
      to the vehicle through OEM and
      aftermarket products
9
2018 Guidance
2018 Segment
Growth
Guidance* Revenue
Revenue ~$3.2 B Auto* (17%)
Gross Margin ~58.5% Fitness 0%
Operating Margin ~21% Aviation 13%
Tax Rate (Pro Forma) ~19% Outdoor 13%
EPS (Pro Forma) ~$3.05 Marine 18%
* Consolidated and Auto segment guidance assumes the adoption of the new
revenue recognition standard in 2018 and restatement of 2017 amounts.
10Financial Update
Doug Boessen
CFO and Treasurer
11Q4 Income Statement
($ Millions) Q4 2017 Q4 2016 Change
Revenue $888 $861 3%
Gross Profit 500 471 6%
Gross Margin % 56.2% 54.7% 150 bps
Total Operating Expense 320 311 3%
Operating Income 179 160 12%
Operating Margin % 20.2% 18.6% 160 bps
Other Income 1 9
Income Tax (42) (32)
Net Income (GAAP) 139 137 2%
Net Income (Pro-Forma) 150 138 9%
EPS (GAAP) $0.73 $0.72 2%
EPS (Pro-Forma) $0.79 $0.73 9%
12Full Year Income Statement
($ Millions) 2017 2016 Change
Revenue $3,087 $3,019 2%
Gross Profit 1,783 1,680 6%
Gross Margin % 57.8% 55.6% 220 bps
Total Operating Expense 1,114 1056 6%
Operating Income 669 624 7%
Operating Margin % 21.7% 20.7% 100 bps
Other Income 13 6
Income Tax 13 (119)
Net Income (GAAP) 695 511 36%
Net Income (Pro-Forma) 555 536 4%
EPS (GAAP) $3.68 $2.70 36%
EPS (Pro-Forma) $2.94 $2.83 4%
13Q4 and Full Year Revenue
Q4 Revenue by Segment
($ M) 2017 2016 Change
Outdoor $203 $175 16%
Aviation 130 117 11%
Marine 84 67 24%
Fitness 276 274 1%
Auto 196 227 (14%)
Total $888 $861 3%
FY Revenue by Segment
($ M) 2017 2016 Change
Outdoor $699 $546 28%
Aviation 501 439 14%
Marine 374 332 13%
Fitness 762 818 (7%)
Auto 751 883 (15%)
Total $3,087 $3,019 2%
14Q4 Revenue & Operating Income 15
Full Year Revenue & Operating Income

16
Operating Expenses

            R&D ($M)                  Advertising ($M)                  SG&A ($M)
 150                            150                             150
          129     127 130 133                                                             129
              122
 125                            125                             125   114
                                                                            102 105 102
 100                            100                             100

     75                          75    68                        75
                                                           59
     50                          50              42              50
                                            32        32
     25                          25                              25

     -                           -                               -
          Q4 Q1 Q2 Q3 Q4              Q4 Q1 Q2 Q3 Q4                  Q4 Q1 Q2 Q3 Q4
          16 17 17 17 17              16 17 17 17 17                  16 17 17 17 17

17
Balance Sheet / Cash Flow / Dividends
Balance Sheet
• Ended quarter with approximately $2.3 billion of cash and marketable securities
• Accounts receivable increased sequentially due to strong sales in the holiday
quarter
• Inventory balance decreased on a sequential basis as we exited the seasonally
strong quarter, but was higher year-over-year
Cash Flow
• Generated $144 million of free cash flow in Q4 2017
Dividends
• Dividend of $0.51 per share to be paid at close of March 2018
• Seeking shareholder approval for $2.12 per share dividend; payable quarterly
at $0.53 per share beginning in June 2018
18Taxes
• The full year 2017 income tax benefit includes pro forma net discrete
tax items of $157 million:
− $180 million income tax benefit due to the change in tax balance sheet
accounts as a result of the Switzerland corporate tax election
− $23 million tax expense resulting from a new accounting standard related
to the expiration of share-based awards
• Excluding the $157 million of pro forma discrete tax items, the pro
forma effective tax rate is 21.2% in FY 2017 compared to 18.9% in FY
2016
− The increase is primarily due to the Company’s election to align certain
Switzerland tax positions with evolving international tax initiatives
• FY 2018 pro forma effective tax rate is expected to decrease to 19%
− The decrease is primarily due to the U.S. Tax Cuts and Jobs Act
19New Revenue Recognition Standard
• During the first quarter of 2018, adopted the new revenue recognition
standard, Accounting Standards Codification Topic 606, Revenue from
Contracts with Customers
• Will utilize the full retrospective method and restate prior year financials
• Auto segment is the only segment impacted
FY 17
($ Millions) Reported Restated Impact
Revenue - Consolidated $ 3,087 $ 3,122 $ 35
Revenue - Auto segment 751 785 35
Operating Income - Consolidated 669 684 15
Operating Income - Auto segment 68 83 15
20Q4 2017 Earnings February 21, 2018
Appendix
     February 21, 2018

22
Pro forma effective tax rate
The Company’s income tax expense is periodically impacted by discrete tax items that are not reflective of income tax expense
incurred as a result of current period earnings. Therefore, management believes disclosure of the effective tax rate and income tax
provision before the effect of such discrete tax items are important measures to permit investors' consistent comparison between
periods. In fiscal 2016, there were no such discrete tax items identified.
13-Weeks Ended 52-weeks Ended
December 30, December 30,
2017 2017
(1) (1)
$ ETR $ ETR
U.S. GAAP income tax provision (benefit) $41,711 23.1% ($12,661) (1.9%)
Pro forma discrete tax items:
(2)
Switzerland corporate tax election 11,279 180,034
(3)
Tax expense from share-based award expirations (15,345) (22,620)
Total pro forma discrete tax items (4,066) 157,414
Income tax provision (Pro Forma) $37,645 20.9% $144,753 21.2%
(1)
Effective tax rate is calculated by taking the Income tax provision (benefit) divided by Income before taxes, as presented on the face of
the Condensed Consolidated Statements of Income.
(2)
In first quarter 2017, a $169 million tax benefit was recognized resulting from the revaluation of certain Switzerland deferred tax
assets. The revaluation is due to the Company’s election in February 2017 to align certain Switzerland corporate tax positions with
international tax initiatives. In the fourth quarter 2017, an additional $11 million benefit was recognized as a result of this
Switzerland election. These impacts during the transitional period following the election are not reflective of current income tax
expense incurred and therefore affect period-to-period comparability.
(3)
Following adoption in fiscal 2017 of Accounting Standards Update No. 2016-09, Compensation – Stock Compensation (Topic 718):
Improvements to Employee Share-Based Payment Accounting (“ASU 2016-09”), the Company may periodically incur tax expense
resulting from stock options and stock appreciation rights (SARs) expiring unexercised. New grants of stock options and SARs no longer
comprise a significant component of the Company’s compensation arrangements. As the tax expense from expired awards is not related
to current period earnings or compensation activities, and affects period-to-period comparability, it has been identified as a pro forma
adjustment.
23Pro forma net income (earnings) per share
Management believes that net income (earnings) per share before the impact of foreign currency gains or losses and
certain discrete income tax items, as discussed above, is an important measure in order to permit a consistent comparison
of the Company’s performance between periods.
13-Weeks Ended 14-Weeks Ended 52-weeks Ended 53-weeks Ended
December 30, December 31, December 30, December 31,
2017 2016 2017 2016
Net income (GAAP) $ 138,780 $ 136,605 $ 694,955 $ 510,814
(1)
Foreign currency losses 8,772 1,648 22,579 31,651
(2)
Tax effect of foreign currency losses (1,829) (312) (4,791) (5,974)
(3)
Discrete tax items 4,066 - (157,414) -
Net income (Pro Forma) $ 149,789 $ 137,941 $ 555,329 $ 536,491
Net income per share (GAAP):
Basic $ 0.74 $ 0.73 $ 3.70 $ 2.71
Diluted $ 0.73 $ 0.72 $ 3.68 $ 2.70
Net income per share (Pro Forma):
Basic $ 0.80 $ 0.73 $ 2.96 $ 2.84
Diluted $ 0.79 $ 0.73 $ 2.94 $ 2.83
Weighted average common shares outstanding:
Basic 187,607 188,233 187,828 188,818
Diluted 188,915 189,171 188,732 189,343
(1) The majority of the Company’s consolidated foreign currency losses are driven by movements in the Taiwan Dollar, Euro,
and British Pound Sterling in relation to the U.S. Dollar and the related exchange rate impact on the significant cash,
receivables, and payables held in a currency other than the functional currency at one of the Company’s subsidiaries. However,
there is minimal cash impact from such foreign currency losses.
Note: Tax effects are based on respective periods’ normalized effective tax rate.
(2) The tax effect of foreign currency losses was calculated using the pro forma effective tax rate of 20.9% for the quarter and
21.2% for the fiscal year ended December 30, 2017, respectively, and an effective tax rate of 19.0% for the quarter and 18.9% for
the fiscal year ended December 31, 2016, respectively.
24
(3) The discrete tax items are discussed in the pro forma effective tax rate section.Free Cash Flow
Management believes that free cash flow is an important financial measure because it represents the amount of cash provided by
operations that is available for investing and defines it as operating cash less capital expenditures for property and equipment.
Management believes that excluding purchases of property and equipment provides a better understanding of the underlying trends in
the Company’s operating performance and allows more accurate comparisons of the Company’s operating results to historical
performance. This metric may also be useful to investors, but should not be considered in isolation as it is not a measure of cash flow
available for discretionary expenditures. The most comparable GAAP measure is cash provided by operating activities.
13-Weeks Ended 14-Weeks Ended 52-weeks Ended 53-weeks Ended
December 30, December 31, December 30, December 31,
2017 2016 2017 2016
Net cash provided by operating activities $198,265 $213,315 $660,842 $705,682
Less: purchases of property and equipment (54,484) (48,803) (139,696) (90,960)
Free Cash Flow $143,781 $164,512 $521,146 $614,722
25Forward-looking pro forma tax rate
Forward-looking pro forma tax rate and pro forma earnings per share are calculated before the effect of certain discrete tax
items. Management believes certain discrete tax items may not be reflective of income tax expense incurred as a result of
current period earnings. Therefore, in order to permit consistent comparison between periods, the tax rate and earnings per
share before the effect of such discrete tax items are important measures. In the 52-weeks ended December 30, 2017, such
discrete tax items were recognized on a U.S. GAAP-basis that would have affected comparability between periods and were
therefore removed from the pro forma tax rate. However, at this time management is unable to determine whether or not
significant discrete tax items will be identified in fiscal 2018.
Forward-looking pro forma earnings per share (EPS)
Our 2018 pro forma EPS excludes foreign currency exchange gains and losses. The estimated impact of such foreign
currency gains and losses cannot be reasonably estimated on a forward-looking basis due to the high variability and low
visibility with respect to non-operating foreign currency exchange gains and losses and the related tax effects of such gains
and losses. The impact of such foreign currency gains and losses, net of tax effects, was $0.04 and $0.09 per share for the
13-weeks and 52-weeks ended December 30, 2017, respectively.
26You can also read