Northamptonshire COVID-19 Weekly Surveillance Report
←
→
Page content transcription
If your browser does not render page correctly, please read the page content below
Northamptonshire COVID-19
            Weekly Surveillance Report
Due to increasing cases of COVID-19 Northampton, Corby, Kettering and Wellingborough residents are being asked to follow
                        local guidance to protect the local community and reduce transmission rates

                                           Data up to 9 August 2020
Data Considerations and Observations
    • Latest Government figures published this week (up to 9 Aug) show that the coronavirus infection rate in the borough of
      Northampton remains above the national and regional average at 619.2 per 100,000. This is higher than last week’s
      position and the continued increase is of particular concern.

    • The rate of infection is still at a high level and the amount of positive tests are also high within the borough. The focus
      of alert activity is in Castle Ward, Abington Ward, Brookside Ward, St James Ward, Delapre and Briar Hill Ward.
    • Victoria Ward in Wellingborough and the boroughs of Corby and Kettering are also areas of focussed activity following
      increases in cases.
    • This week we are also seeing the case rate across the county of Northamptonshire as significantly higher compared
      with the England rate.

    • This upward trend in the infection rate, coupled with the emerging situation at Greencore UK Northampton, means that
      we need to collectively take action now across the county to prevent further spread of the virus.

2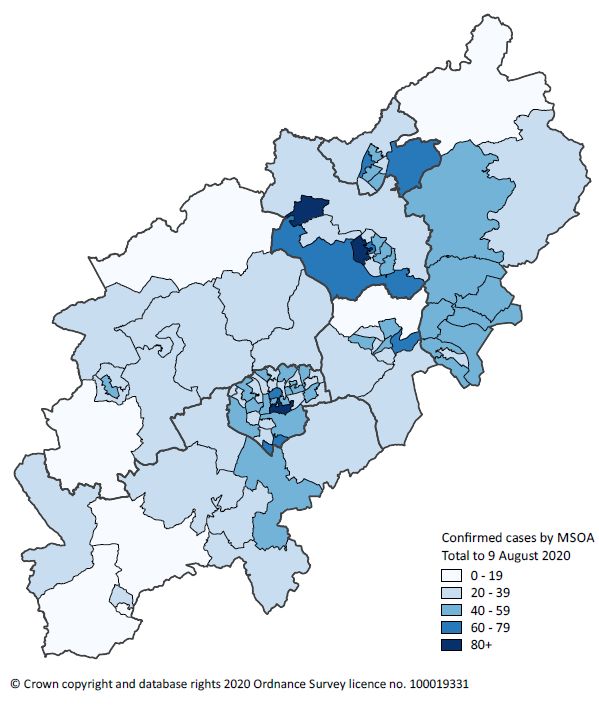
Data Considerations and Observations
• Whilst we still cannot yet pinpoint the exact reasons or trends in transmission, emerging evidence means we are
  increasingly concerned about non-compliant car sharing and social distancing outside areas of work and when
  residents leave work and return to their communities.
• We are also concerned about shared households where a high number of people are living together as rates of
  transmission are likely to be higher.
• Public Health Northamptonshire has created a workforce COVID-19 support pack for businesses across the county.
  The pack contains guidance to employees for safer car sharing and COVID-secure behaviour in the community. This
  can be accessed via Google Drive or WeTransfer.
• We are urging people who have symptoms, or have a concern they have been in contact with someone who has
  the virus, to get tested immediately. https://www.northamptonshire.gov.uk/coronavirus-
  updates/Pages/coronavirus-testing-in-northamptonshire.aspx
Public Health Measures
• We are continuing to urge all residents of Northampton, Corby, Kettering and Wellingborough to follow
  additional behavioural measures to avoid local lockdown (see slide 5).

• Multi team sports gatherings and tournaments across Northamptonshire continue to be paused until further
  notice. We thank Northamptonshire’s residents for supporting us in taking these actions.

• We are continuing to restrict visiting times to residents of care homes.

• We are reminding Northamptonshire residents to maintain social distancing and COVID-secure measures during all
  events, celebrations and social gatherings.

• We are also reminding residents to wear face coverings while on public transport and in enclosed public spaces
  and if they must car share, to wear a face covering and have all the windows down.

 3
Northampton, Corby, Kettering and
        Wellingborough Borough Residents Must:
                                                 Act Now
    •   Keep 2 metres from others at all times
    •   Limit contact with anyone outside of your household or bubble
    •   If you must meet those outside of your household or bubble, meet in an outdoor space
    •   Do not share items with others outside of your household or bubble
    •   If social distancing at 2 metres is not possible, always use a face covering
    •   Avoid using public transport or car sharing - wear face coverings if you must travel with others
    •   Wash your hands regularly and thoroughly for 20 seconds each time
    •   Work from home if you can

4
All Northamptonshire Residents Must:
In Northamptonshire we are a team of Test, Trace and Isolate
nearly 750,000 people – we must work • If you have concerns or COVID-19 symptoms, do not go
together to protect ourselves and to work, either work from home or report sick, self-
everyone else isolate and get a test.
• If you have COVID-19 symptoms, stay at home, self-
We all need to continue to protect isolate and get a test.
ourselves and each other by following the • Even if you only have mild COVID-19 symptoms, get a
social distancing guidelines, washing test.
hands regularly for 20 seconds, wearing a • If you are contacted by test and trace and asked to self-
face covering on public transport /in isolate, stay at home for 14 days.
enclosed spaces and contact tracing. • Details of all testing facilities across the county are
updated daily and can be found here.
If you’re told you’ve been in close contact https://www.northamptonshire.gov.uk/coronavirus-
with someone who has tested positive, updates/Pages/coronavirus-testing-in-
you must isolate for 14 days to protect northamptonshire.aspx
others. If you have symptoms, however
mild, isolate immediately and book a test
at nhs.uk/coronavirus.
5Total and Weekly Summary
A total of 3,743 positive cases have been identified in Northamptonshire to date. Of this number, 151 were identified
in the last week, 3rd – 9th August 2020.
• Pillar 1 (testing in hospitals for staff and patients) | 1,794 total | 6
in the last week.
• Pillar 2 (testing in the community, including mobile testing units) |
1,949 total |145 in the last week.
This graph shows the number of people who have tested positive for
COVID-19 in Northamptonshire each week since 18 May 2020. The
shape of the graph shows that rates of infection had been steadily
decreasing since the middle of May.
However, there has been an increase over the last five weeks and
the number of cases identified in the last week is the highest since
the beginning of June. Numbers are expected to rise even further
given the scale and nature of recent outbreaks.
6Total Cases by Age and Gender
These graphs show the number of positive
test results for COVID-19 in
Northamptonshire by gender and by ten-
year age band.
Pillar 1 positive tests (left) shows cases in
hospital settings and amongst NHS front
line staff. The age range reflects the ages of
patients who are admitted to hospital or
who work in a front line NHS setting.
Locally we also use Pillar 1 testing for care
home staff and residents who are showing
symptoms.
Pillar 2 positive tests (right) shows cases
among key workers and the wider general
public showing symptoms according to
current testing guidelines. This table shows
a more even spread of age ranges.
• The largest proportion of those showing positive from Pillar 2 testing is females between 20-59 and males aged 30-59. This age group is traditionally the working
population and some of the more mobile groups in our community.
• The population pyramid on the left detailing Pillar 1 cases shows a larger number of cases in the age groups over the age of 60. We know that these cases largely
come from care settings.
7Total Cases by District and Borough
This table shows the total number of
Cases in Change people who have tested positive for
Total cases Cases Cases
week 3 from
Area to 9 Aug from from COVID-19 up to 9 Aug 2020 in each of
Aug to 9 previous
2020 Pillar 1 Pillar 2 Northamptonshire’s seven districts and
Aug 2020 week
boroughs.
Northamptonshire 3,743 151 1,794 1,949 The county as a whole is showing an
increase from the previous week - with
Corby 356 17 138 218
Corby, Kettering, Northampton and
Daventry 290 0 164 126 Wellingborough showing an upward trend
East Northamptonshire 424 11 233 191 compared with figures presented last
Kettering 619 14 285 334 week.
Northampton 1,394 85 621 773 Please note that caution must be applied
South Northamptonshire 285 3 172 113 when viewing week on week changes.
To see the overall changes in areas in
Wellingborough 375 21 181 194
context please see slide 12.
8Total Cases to Date by District and Borough
The data in this table shows us what the total
positive COVID-19 case numbers for our districts
and boroughs would look like if each area had the
Rate per Compared to Compared to
Area exact same population (100,000).
100,000 county rate England rate
This helps us to compare different geographic areas
with different sized populations more accurately,
Northamptonshire 500.7 - Sig higher and also helps to compare individual areas with
Corby 502.6 Similar Similar local, regional and national averages.
Daventry 343.3 Sig lower Sig lower
In most cases, district and borough infection rates
East Northamptonshire 451.5 Similar Similar
per 100,000 population are similar or significantly
Kettering 611.3 Sig higher Sig higher lower than the national average but in
Northampton 619.2 Sig higher Sig higher Northampton and Kettering they are significantly
South Northamptonshire 308.1 Sig lower Sig lower higher.
Wellingborough 471.8 Similar Similar
This week we are seeing the case rate across
Northamptonshire as a whole is now significantly
† England rate from https://coronavirus.data.gov.uk/ on 10.08.20
higher compared with the England rate.
*Please note that the table shows rates since the start of the pandemic and the word significant is a statistical term which simply means
that the research is valid.
9Cumulative Cases by District and Borough
This graph shows the
total number of COVID-
19 positive rate of cases
added together
(cumulative) over time
across our seven districts
and boroughs.
10Rate of Daily Lab Confirmed Cases
This includes Pillar 1 and Pillar 2 data.
The graph shows that we still have
higher overall rates in our county
compared to the England average.
All districts and boroughs except for
Daventry and South Northamptonshire
have recently had increasing rates of
cases.
The most notable increases in rates of
cases are in Northampton,
Wellingborough and East
Northamptonshire. There are also
increasing trends in Corby and Kettering.
Northampton has the highest rate of
cases in the county.
*These are 7-day rolling averages of numbers of
cases as a rate per 100,000 population – this is
done to even out the fluctuations we see in
testing volumes on weekdays vs weekends.
Source: coronavirus.data.gov.uk
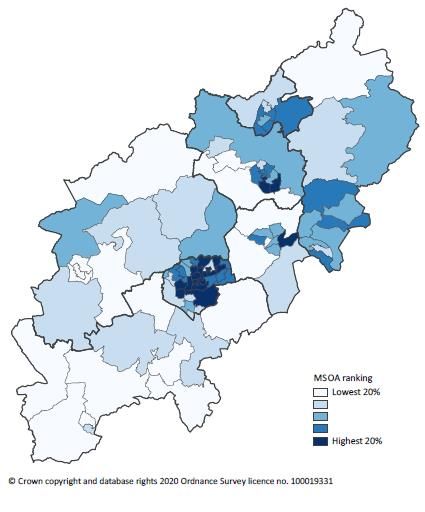
11Cumulative Cases by Community This chart shows the local communities within Northamptonshire where total COVID-19 infections since the start of the pandemic are highest. Local numbers of confirmed cases for the whole county are illustrated in the map. These are total cases throughout the period of the pandemic. The areas with the highest case numbers in central Northampton, closely followed by Kettering, help us to know where we should prioritise and focus our support locally. 12
Cumulative Case Rates by Community
per 100,000 population

These graphics show the total
positive COVID-19 case
numbers for local communities
in Northamptonshire would
look like if each community had
the exact same population
(100,000).
The chart highlights local
communities where overall
infection rates since the start of
the pandemic are highest, and
the map illustrates overall
infection rates per 100,000
population across the whole
county.
Areas with higher overall rates
of infection show us where we
need to prioritise and focus our
support locally.

     *Please note that the numbers shown on this page represent the best possible estimate we can make from a wider range of numbers, because there is
13   always a margin of error when calculating cases per 100,000 population – particularly where actual case numbers are small.
Cumulative Cases by Community – Last 28 Days The chart shows the local communities within Northamptonshire where total COVID-19 infections over the last 28 days are highest. The areas with the highest case numbers are central Northampton, closely followed by Wellingborough. Areas with the highest case numbers in the last 28 days help us to know where we should prioritise and focus our support locally. 14
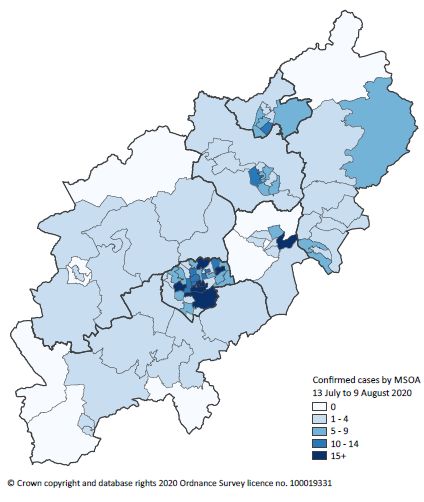
Cumulative Case Rates by Community – Last 28
Days per 100,000 population

These graphics show what
positive COVID-19 case
numbers over the last 28
days would look like if each
local community had the
exact same size population
(100,000).

The chart highlights local
communities where overall
infection rates are highest
since 13 July 2020.
The map illustrates the 28-
day infection rate per
100,000 population across
the whole county.

     *Please note that the numbers shown on this page represent the best possible estimate we can make from a wider range of numbers, because there is
15   always a margin of error when calculating cases per 100,000 population – particularly where actual case numbers are small.
Summary of Outbreaks, Exposures and Clusters
14/08/2020 Northamptonshire Confirmed
Total Total Cases
Active Outbreaks 16 403
Outbreak Care homes 11 62
(two or more cases linked by Workplaces 3 304
place and time to a setting) Schools 0 0
Hospital / Hospice 2 37
Exposure Exposures 23 26
(single case where there has Care Homes 19 20
been (or potentially been) Childminder 1 1
exposure to contacts in the
setting) Workplaces 3 5
Cluster Cluster 4 19
(two or more cases Care homes 1 2
associated with a setting but
not “connected by time and
place” to the setting Workplaces 3 17
Total incidents logged 43 Total confirmed cases 448Ongoing Public Health Actions
• We are tracking several outbreak situations daily and based on the intelligence we receive, are taking action to manage COVID-19 in
our communities. Part of this is communicating with you, the residents of Northamptonshire.
• We are continuing to drill deeper into the data at postcode level to understand the reasons for increased levels of infection and are
focusing our attention in central Northampton; however rates in Corby, Kettering and Wellingborough are higher than expected and
therefore focused communication and engagement is continuing in these boroughs too.
• We are harnessing links with the local communities in these areas with Environmental Health Officers, Health and Safety Officers
and local leaders to gather and act on soft intelligence on risk areas and activities, and to ensure businesses and workplaces are
COVID-Secure.
• We are closely monitoring COVID-Secure compliance with businesses across the county and we are taking immediate enforcement
action where compliance is found to be low.
• Based on the information we have collated, we are working within specific communities to improve vigilance, raise awareness,
encourage testing and reiterate prevention measures. We ask the public to play their part in the fight against coronavirus by
adhering to local guidance to reduce the risk locally.
• The Public Health team is continuing to work with our communities and taking prompt proactive action where needed. Specific
recommendations limiting sporting events with large crowds of spectators and increasing the availability of testing across the
county are just two of the actions we have taken to support residents to stay safe.
• We are communicating with our residents in a timely manner to update them on all activity and information.
• We are holding a weekly press conference with the media.
• We are continuing to be guided by the Northamptonshire Health Protection Board and the COVID-19 Local Oversight and
Engagement Board. The public part of this meeting is live streamed on YouTube.
16We are all in This Together • We all need to continue to protect ourselves and each other by following the social distancing guidelines, washing hands regularly for 20 seconds, wearing a face covering on public transport and in enclosed spaces. • To find out more information about local testing sites visit: https://www.northamptonshire.gov.uk/coronavirus- updates/Pages/coronavirus-testing-in-northamptonshire.aspx • Tests can be booked online at nhs.uk/coronavirus or by calling 119. Home testing kits can also be ordered subject to availability. • Advice on how to access a COVID-19 test can be found here https://www.gov.uk/guidance/coronavirus-covid-19-getting-tested 17
You can also read