New Mexico Department of Health Influenza & Respiratory Disease Report, 2020-2021

Page created by Mark Carroll
 
CONTINUE READING
New Mexico Department of Health Influenza & Respiratory Disease Report, 2020-2021
New Mexico Department of Health
         Influenza & Respiratory Disease Report, 2020-2021
2020-21 Influenza Season Week 47 ending Nov 21, 2020
                                                                   Summary of Activity: Week 47
                                                                November 15th – November 21st, 2020

                                                         ▪ New Mexico influenza-like illness (ILI) activity is
                                                           currently 2.6% of patient visits and is below the NM
                                                           ILI baseline of 3.4% in all but the SW Region (5.0%)

                                                         ▪ Based on testing results, we interpret ILI currently in
                                                           NM as a reflection of symptomatic COVID-19
                                                           infection

                                                         ▪ US ILI is 1.6%, which is below the national ILI
                                                           baseline of 2.6%
  New Mexico is experiencing Low ILI activity*           ▪ No influenza outbreaks were reported this week in
                                                           any of the five health regions
 Please visit https://cv.nmhealth.org for
 COVID-19 Weekly Epidemiology Reports                    ▪ The death of a woman in her 80’s was reported
                                                           during week 47. She tested positive for both SARS-
                                                           CoV-2 and influenza A.
Visit CDC FluView for the national ILI report

              *Activity Map from
              https://www.cdc.gov/flu/weekly/index.htm
New Mexico Department of Health Influenza & Respiratory Disease Report, 2020-2021
Influenza-Like Illness (ILI) Activity, 2015 to Present
  New Mexico Department of Health (NMDOH) is collaborating with 21 ILI sentinel sites and 30 syndromic surveillance sites* for the 2020-2021
  season. Sites report weekly on the number of patients that present to their facility with influenza-like illness (ILI). That number is then divided
  by the total number of patients seen for any reason, resulting in percent of ILI activity. ILI is defined as fever of greater than or equal to 100° F
  and cough and/or sore throat without a known cause other than influenza.

                                              New Mexico and U.S. ILI Activity, 2015 to Present
  12.0%

  10.0%

    8.0%

    6.0%

    4.0%

    2.0%

    0.0%
             OCT                 NOV                DEC           JAN             FEB                 MAR              APR              MAY

           2015-16 NM          2016-2017 NM     2017-2018 NM    2018-2019 NM     2019-2020 NM      2020-2021 US     NM Baseline 2020-2021      2020-2021 NM

                       % ILI, NM, Week 47                            % ILI, NM, Week 46                      % ILI, United States, Week 47
                November 15th – November 21st, 2020            November 8th – November 14th, 2020        November 15th – November 21st, 2020
                         (current week)                                (previous week)                               (current week)

                                       2.6%                                    2.0%                                          1.6%
* See appendix for reporting sites                                                                                                                        2
New Mexico Department of Health Influenza & Respiratory Disease Report, 2020-2021
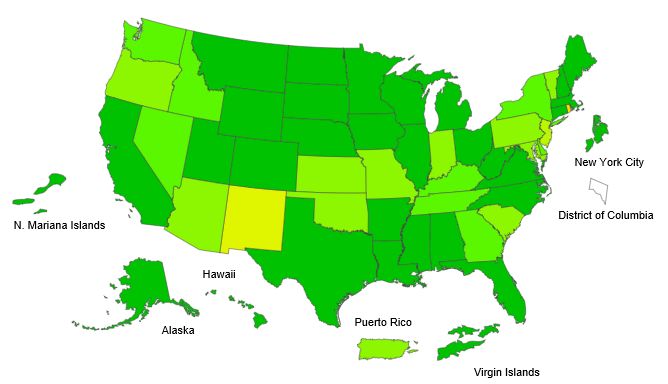
Regional Influenza-Like Illness (ILI) Activity, 2020-2021

          NM ILI Activity by Health Region, 2020-2021
6.0%

5.0%                                                                                NW                           NE
4.0%
                                                                                                    Metro
3.0%

2.0%
                                                                                                                    SE
1.0%
                                                                                         SW
0.0%
        OCT      NOV    DEC   JAN           FEB     MAR      APR       MAY

                                    NM Baseline

Region        This     Last   Outbreaks           +PCR testing     + Rapid
              Week     Week                          at SLD         tests    Outbreak: An influenza outbreak is defined as at
                                                                             least two cases of ILI in a congregate residential
  NW           2.6%    1.6%          No               No             No
                                                                             care setting with at least one laboratory
  NE                                 No               No             No      confirmed case.
               2.5%    1.8%

Metro          2.0%    1.9%          No               No             No      PCR Testing: Polymerase Chain Reaction (PCR)
                                                                             tests can identify the presence of influenza viral
  SW           5.0%    2.9%          No               No             Yes     RNA in respiratory specimens. PCR testing is
                                                                             performed at various laboratories across New
   SE          2.5%    2.1%          No               No             Yes     Mexico.
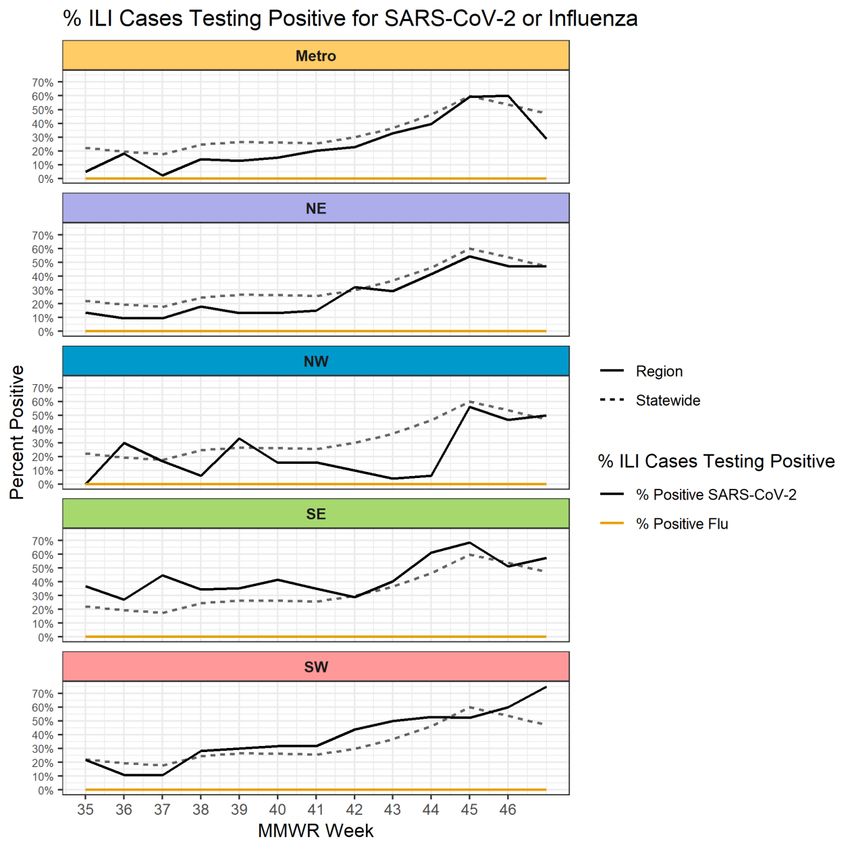
                                                                                                                                  3
Percent Positivity among ILI patients at Public Health Offices,
                           2020-2021
In order to determine the proportion of ILI
caused by SARS-CoV-2, the virus that causes
COVID-19, versus influenza, we are leveraging a
new source of data this season.

Individuals tested for SARS-CoV-2 at Public
Health Offices (PHOs) in New Mexico register for
their test via the NMDOH COVID-19 Test
Registration Portal, where they indicate which
symptoms they are experiencing.

Looking at just individuals who meet the ILI case
definition (Fever and Cough and/or Sore Throat),
we are able to match these individuals to their
test results from the Scientific Laboratory
Division (SLD).

The sampling strategy selects a proportion of
individuals who meet ILI case definition, to be
screened for influenza in addition to SARS-CoV-
2. One specimen from each of five age                   Legend: The dashed lines
categories per county is selected, for a                indicate the statewide
                                                        average % positivity for
maximum of 165 specimens per week. However,
                                                        each pathogen among all
there is not always a specimen that meets the           individuals tested at PHOs
sampling criteria in every age category in every        who meet ILI case
county. Please note, this sampling has not yet          definition, while solid lines
occurred for weeks 45, 46 or 47 due to a                indicate regional %
                                                        positivity. There have not
decrease in capacity at SLD. Sampled specimens
                                                        been any positive influenza
will be retrospectively tested for flu.                 results , but once we start
                                                        seeing more, there will be a
                                                        dashed and solid yellow line
                                                                                        4
Laboratory Data & Virologic Surveillance, 2020-2021
                               PCR Positive Results among Hospital/Clinical Sites and Scientific Laboratory                                                                    NM subtyping
                                                Division, October 2019 - November 2020                                                                                        performed at SLD **
                       375                                                                                                                              40%

                       350
                                                                                                                                                                             No positive Flu
                       325                                                                                                                              35%                  specimens at SLD
                       300
                                                                                                                                                                             during week 47.
                                                                                                                                                                             There has been one
                                                                                                                                                        30%
                       275                                                                                                                                                   positive Flu A at SLD
                       250                                                                                                                                                   during the 2020-
                                                                                                                                                                             2021 season.
 Number of specimens

                                                                                                                                                        25%
                       225

                                                                                                                                                              % Positive
                       200
                                                                                                                                                        20%
                       175

                       150                                                                                                                                                 U.S. virus characterization
                                                                                                                                                        15%                    performed at CDC **
                       125
                                                                                                                                                                                  n=3   n=3 n=3
                       100
                                                                                                                                                        10%
                                                                                                                                                                                                  n=7
                       75

                       50                                                                                                                               5%
                                                                                                                                                                           n=22
                       25

                        0                                                                                                                               0%
                             OCT    NOV          DEC   JAN     FEB        MAR   APR     MAY     JUNE   JULY     AUG          SEPT   OCT        NOV                                                 n=34
                                   A(H3N2)                   A(Not Subtyped)          A(2009, H1N1)           B(Not Subtyped)             B(Victoria)

                                   B(Yamagata)               % Positive               % Positive A            % Positive B

** Pie chart data and bar graph data are populated from two separate sources. Therefore, not equivalent
                                                                                                                                                                               2020-2021 US
***There was a false positive Flu B during week 42. The positive case had received an influenza vaccination the day before testing. This result was
excluded from the counts.                                                                                                                                                                                 5
RSV and Rapid Influenza Laboratory Data*, 2020-2021
                                20

                                                    A+                                                                                                                                                   14.00%
                                18
                                                    B+
                                16                                                                                                                                                                       12.00%
                                                    A/B+
                                14                  RSV +
                                                                                                                                                                                                         10.00%
                                                    NM % ILI
     Number of Positive Tests

                                12

                                                                                                                                                                                                                        Percent of ILI
                                                                                                                                                                                                         8.00%
                                10

                                8                                                                                                                                                                        6.00%

                                6
                                                                                                                                                                                                         4.00%
                                4
                                                                                                                                                                                                         2.00%
                                2

                                0                                                                                                                                                                        0.00%
                                              OCT               NOV                     DEC                JAN               FEB                  MAR                APR                MAY

* Rapid Influenza Diagnostic tests (RIDTs) are more likely to result in a false positive when community influenza activity is low. Early and late in the
season, it is best to confirm a positive RIDT result by PCR.
Laboratory Sites Participating in Rapid Influenza Data Collection                                                              Laboratory Sites Participating in RSV Data Collection
(Facility name, City)                                                                                                          (Facility name, City)

NW                              San Juan Regional Medical Center, Farmington; Northern Navajo Medical Center, Shiprock;        San Juan Regional Medical Center, Farmington; Cibola General Hospital, Grants; Crownpoint IHS,
                                Cibola General Hospital, Grants; Crownpoint IHS, Crownpoint; Gallup Indian Medical Center,     Crownpoint; Gallup Indian Medical Center, Gallup; Rehoboth McKinley Christian Hospital, Gallup;
                                Gallup; Rehoboth McKinley Christian Hospital, Gallup;
NE                              Los Alamos Medical Center, Los Alamos; Christus St. Vincent’s Hospital, Santa Fe               Los Alamos Medical Center, Los Alamos; Christus St. Vincent’s Hospital, Santa Fe

Metro                           New Mexico Veterans Affairs Medical Center, Albuquerque; Sandia National Labs, Albuquerque

SW                              Gila Regional Medical Center, Silver City; Gerald Champion Regional Medical Center,            Gerald Champion Regional Medical Center, Alamogordo
                                Alamogordo; Mimbres Memorial Hospital, Deming

SE                              Carlsbad Medical Center, Carlsbad; Lea Regional Medical Center, Hobbs; Roosevelt General       Carlsbad Medical Center, Carlsbad; Lea Regional Medical Center, Hobbs; Artesia General
                                Hospital Clinic, Portales; Artesia General Hospital, Artesia;                                  Hospital, Artesia;                                                                                        4
Influenza Hospitalizations, NM & US, 2020-2021

                                                  Hospitalization data for this season not
                                                        yet being reported by CDC

                                                   New Mexico has had 5 lab-confirmed
                                                   influenza-associated hospitalizations
                                                        reported since Oct 1, 2020.

             Pneumonia and Influenza (P & I) Deaths, NM, 2017-2021*
             Season                      Pneumonia (P)                   Adult Influenza (I)             Pediatric Influenza                    Total P & I
                                            Deaths                            Deaths                          Deaths                              Deaths
            2020-2021                             25                                1                                0                               26
            2019-2020                            187                                62                               5                              254
            2018-2019                            178                                57                               2                              237
            2017-2018                            222                                67                               3                              292
Pneumonia death: Is defined as having a cause of death that is related to pneumonia & influenza (P & I) not including: aspiration pneumonia, pneumonitis, or
pneumococcal meningitis.
Influenza death: Is defined as having a cause of death that is related to pneumonia & influenza (P & I) not including: parainfluenzae or Haemophilus influenzae.
                                                                                                                                                                   7
* Death data is delayed up to 8 weeks
Influenza Vaccination Information
                                                                                                “Influenza is a serious disease that can lead to hospitalization and
                             Still Need to Get Your Flu Shot?                                   sometimes even death. Every flu season is different, and influenza
                                                                                                infection can affect people differently, but millions of people get the
                                                                                                flu every year, hundreds of thousands of people are hospitalized and
 HealthMap Vaccine Finder:                                                                      thousands or tens of thousands of people die from flu-related causes
                                                                                                every year. Even healthy people can get very sick from the flu and
 http://vaccine.healthmap.org/                                                                  spread it to others. Flu-related hospitalizations since 2010 ranged
                                                                                                from 140,000 to 710,000, while flu-related deaths are estimated to
 Or
                                                                                                have ranged from 12,000 to 56,000. During flu season, flu viruses
 Contact your Primary Care Provider (PCP) or a local public                                     circulate at higher levels in the U.S. population in the United States
 health office (LPHO) near you:                                                                 can begin as early as October and last as late as May. An annual
                                                                                                seasonal flu vaccine is the best way to reduce your risk of getting sick
 https://nmhealth.org/location/public/                                                          with seasonal flu and spreading it to others. When more people get
                                                                                                vaccinated against the flu, less flu can spread through that
                                                                                                community.”
                                                                                                                          -Centers for Disease Control and Prevention
                     New Mexico and National Vaccination Coverage
                        by Season, Age >6 Months, 2010-2020                                      For Additional Vaccine Information/resources:
               100                                                                              FluVaxView:
                90
                80                                                                              https://www.cdc.gov/flu/fluvaxview/index.htm
Coverage (%)

                70
                60                                                       43.7            53.2
                      44.6     48.1    46.6     49.6    47.4     49.2            49.9
                50
                                                                                         51.8
                40
                30
                      41.8      45     46.2     47.1    45.6     46.8
                                                                         41.7
                                                                                 49.2           Seasonal Influenza Vaccination Resources for Health
                20                                                                              Professionals:
                10
                 0                                                                              https://www.cdc.gov/flu/professionals/vaccination/index.htm

                                                                                                Misconceptions about Flu Vaccines:
                                                       Season
                                                                                                https://www.cdc.gov/flu/about/qa/misconceptions.htm
                                                                                                                                                             8
                       United States          Healthy People 2020 Goal          New Mexico
Appendix
Health        Participating Sentinel Sites                                                              Syndromic Surveillance Hospitals
Region       (Facility name, City)                                                                      (Facility name, City)

             Acoma-Canoncito-Laguna Indian Health Services, Acoma; Dzilth Indian Health Services,       San Juan Regional Medical Center, Farmington; Cibola General Hospital, Grants
Northwest    Bloomfield
             Taos-Picuris Indian Health Services, Taos; Pecos Valley Medical Center, Pecos; Jicarilla   Alta Vista Regional Hospital, Las Vegas; Christus St. Vincent, Santa Fe; Los Alamos Medical
Northeast    Apache Indian Health Services, Dulce; Children’s Clinic PA, Los Alamos;                    Center, Los Alamos; Miners’ Colfax Medical Center, Raton; Union County General Hospital,
                                                                                                        Clayton; Guadalupe County Hospital, Santa Rosa; Presbyterian Hospital, Espanola
             University of New Mexico Student Health Clinic, Albuquerque; Presbyterian Medical          Lovelace Westside Hospital, Downtown Medical Center and Women’s Hospital, Albuquerque;
Metro        Group-Atrisco, Northside, Carmel Pediatric Urgent Care, Las Estancias Pediatric Urgent     UNM Health System, Albuquerque & Rio Rancho; Presbyterian Hospital, Kaseman and Rust
             Care; DaVita Urgent Care, Journal Center                                                   Medical Center, Albuquerque & Rio Rancho; UNM Sandoval Regional Medical Center, Rio
                                                                                                        Rancho
             Gila Regional Medical Center, Silver City; Ben Archer Health Centers – Dona Ana, Deming,   Mimbres Memorial Hospital, Deming; Mountain View Regional Medical Center, Las Cruces;
Southwest    Columbus; Hidalgo Medical Services, Lordsburg; La Clinica de Familia, Sunland Park; La     Socorro General Hospital, Socorro; Gerald Champion Regional Medical Center, Alamogordo
             Clinica de Familia, Santa Teresa School Based Clinic, Santa Teresa; Mescalero Apache
             Indian Health Hospital, Mescalero
             Roosevelt General Hospital Clinic, Portales;                                               Carlsbad Medical Center, Carlsbad; Eastern New Mexico Medical Center, Roswell; Lea Regional
Southeast                                                                                               Medical Center, Hobbs; Artesia General Hospital, Artesia; Dan C Trigg Memorial Hospital,
                                                                                                        Tucumcari; Lincoln County Medical Center, Ruidoso; Lovelace Regional Hospital; Roswell; Nor-
                                                                                                        Lea Hospital District, Lovington; Plains Regional Medial Center, Clovis;

    In accordance with New Mexico Administrative Code (NMAC) 7.4.3.13 Influenza is a reportable condition for the following:
    ▪ Influenza, laboratory confirmed hospitalizations only
    ▪ Influenza-associated pediatric death
    ▪ Acute Illness or condition of any type involving large numbers of persons in the same geographic area (outbreaks)
    ▪ Other illnesses or condition of public health significance (novel influenza A)

                                          For more information on reportable conditions please visit:
                                          http://164.64.110.134/parts/title07/07.004.0003.html
                                          Found at the New Mexico State Records Center and Archives - Commission for Public Records

                                Report published by New Mexico Department of Health (NMDOH), Epidemiology and Response Division (ERD)
                                Infectious Disease Epidemiology Bureau (IDEB)
                                For questions, please call 505-827-0006. For more information on influenza go to the NMDOH web page:
                                                                                                                                     9
                                https://nmhealth.org/about/erd/ideb/isp/ Or The CDC web page: http://www.cdc.gov/flu/index.htm
You can also read