Healthcare Forum Removing Private Activity from Public Hospitals & its Impact on the Healthcare System Society of Actuaries - Mr Martin Varley ...
←
→
Page content transcription
If your browser does not render page correctly, please read the page content below

Healthcare Forum
        Removing Private Activity from
      Public Hospitals & its Impact on the
               Healthcare System
              Society of Actuaries

Mr Martin Varley
                            3rd December 20191
Secretary General
History of Health Reform

• Track record: unimplemented reports and strategies
• Fitzgerald (1960s), Hanly (2003), VFC Mental Health (2006)
• Health Boards, HSE, Integrated Areas, Hospital Groups,
  CHOs, UHI
• Removal/Reinstatement of HSE Board
• Regional Integrated Care Organisations (RICOs): Health
  Boards revisited
• Rationalisation, colocation, reconfiguration, integration …
• Strategy, Planning, Management churn
• Indicator of dysfunctionality
                                                           2
2017 Sláintecare Recommendations

                            Sláintecare Year 10 Costs (%)

                              1%

                                                            Acute Hospital Expansion
                             4%

                      10%                                   Primary Care Expansion
                                      27%

                                                            Social Care Expansion
               15%

                                                            Reduce/remove charges

                     17%
                                    26%                     Expand Health & Wellbeing

                                                            Mental Health Programmes

                                                            Dentistry Expansion

• First decade cost: €20bn plus €3bn transitional
• Second decade cost: €28bn + inflation                                                 3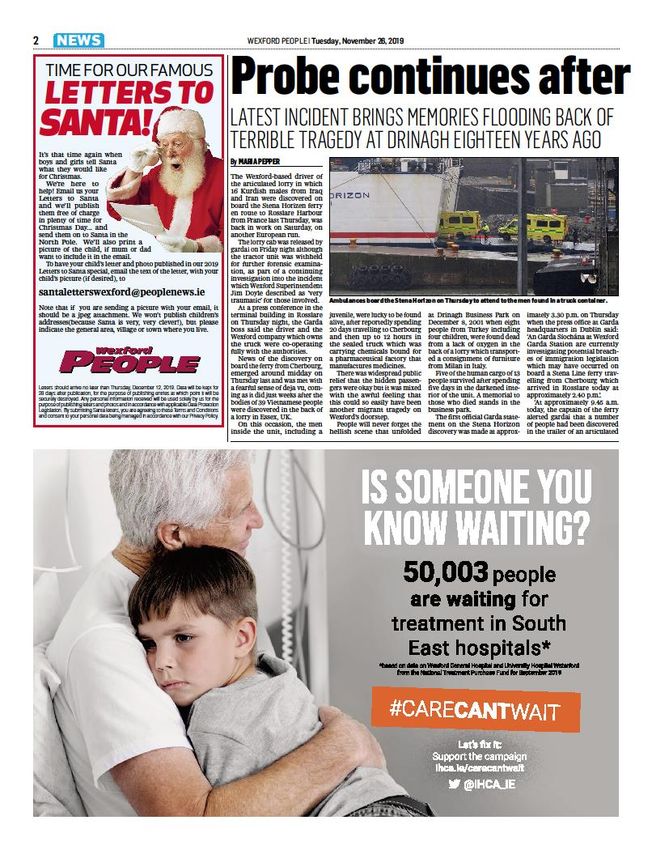
Sláintecare Qualifications & Unintended
                   Consequences
“The Committee acknowledges that removing private care
from public hospitals will be complex. It therefore proposes
an independent impact analysis of the separation of private
practice from the public system with a view to identifying any
adverse and unintended consequences that may arise for
the public system in the separation. Given the acknowledged
need to increase capacity in the public system, it is important
that any change should not have an adverse impact on the
recruitment and retention of consultants and other health
professionals in public hospitals.”

                                                              4
Sláintecare & Capacity Expansion??

• Expand Hospital
  Activity????
   o Replace private
      insurance income
      year 2 – 10: Year
      10 cost €649m
   o Increase
      consultant
      numbers by 593
      (+20%): Year 10
      costs €119m

                                            5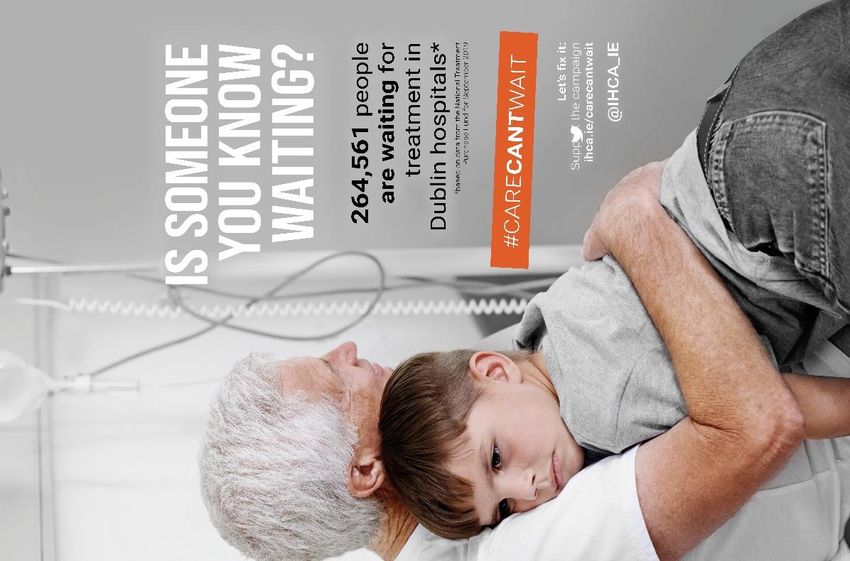
Other Capacity Expansion Needs

Bed Capacity
Deficits
    o 2,600
       additional
       public hospital
       beds (€2.6Bn)
    o 4,500
       Community
       beds (€4Bn)

ICU Capacity                       Equipment & Facilities
o Need 330 more ICU      o Replace obsolete
  beds (€412m)           o Expand facilities as inadequate
                         o €3.64bn to replace equipment (2017-2021)
                                                                  6
2019-2021 Capital Plan

• HSE to provide
  480 new
  hospital beds
  between
  2019-2021

• This is 100 less
  beds over each
  of 3 years

                                       7
de Buitléir Recommendations

• Legislation so public hospitals exclusively public patients
  from conclusion of 10 year Sláintecare implementation
  period
• New Consultant appointments Sláintecare Consultant
  Contracts – public only
• Restore pay parity to pre-2012 levels for all Consultants
• Offered “contract change payment”
• All existing contracts 39 hrs
• Declining Salaries A → B → B* → C ??

                                                                8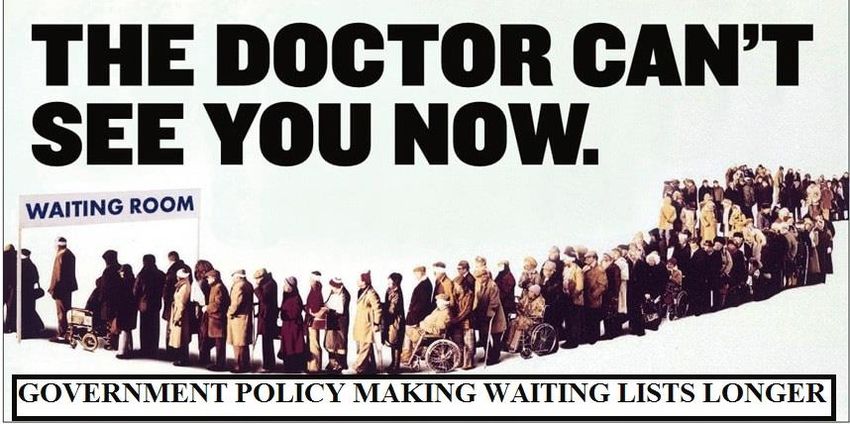
Consultant Vacancies and the Recruitment
and Retention Crisis

Outpatient Waiting List (March 2013-Oct 2019)
                          Capacity Deficits
  600,000
                                                                                  567,211 (Oct-
  550,000                                                                              19)

  500,000

  450,000

  400,000                                  375,440
        384,632
  350,000

  300,000         300,752
              Jul-13

              Jul-14

              Jul-15

              Jul-16

              Jul-17

              Jul-18

              Jul-19
            May-13

            Nov-13

            May-14

            Nov-14

            May-15

            Nov-15

            May-16

            Nov-16

            May-17

            Nov-17

            May-18

            Nov-18

            May-19
            Mar-13

            Sep-13

             Jan-14
            Mar-14

            Sep-14

             Jan-15
            Mar-15

            Sep-15

             Jan-16
            Mar-16

            Sep-16

             Jan-17
            Mar-17

            Sep-17

             Jan-18
            Mar-18

            Sep-18

             Jan-19
            Mar-19

            Sep-19
                             Total Outpatients       Linear (Total Outpatients)

Source: NTPF (2013 - 2019)

  •     567,200 in October
  •     ↑ 51,059 (9.9%) in 2019
  •     ↑ 189,709 (50%) in 5 years
  •     500 Permanent hospital Consultant posts can’t be filled                                   10
Consultant Vacancies and the Recruitment
and Retention Crisis
Specialist medical practitioners per 1,000 population in EU in 2018
(or nearest year)
• 42%
Ireland
France
1.44
fewer
Denmark
Belgium
1.76
medical
Finland
Poland
specialists
Netherlands
Norway
1.97
than EU
Luxembourg
UK 2.09
average
Sweden
Slovenia
EU Average 2.47
Latvia
Portugal 2.49
• Over 500
Spain
Switzerland
posts
Hungary
Estonia
2.62
vacant or
Austria
Czechia
2.75
filled on a
Italy
Germany
3.1
3.25
temporary
Lithhuania
Greece
3.51
4.95
basis
0 0.5 1 1.5 2 2.5 3 3.5 4 4.5 5
Source: Eurostat 11Specialist medical practitioners in Ireland per
100,000 population as a percentage of the EU
average (2016 or nearest year)
% of EU
Average
100
• 1/to 1/2 in
4
90
80
82 82 many
70 66 specialties
61
58
60 55 53 52 51
48 46
50
40 37
32 32 30
• UCC at
30 25
20
23
Connolly
10
Hospital only
0 open for 1/3 of
planned hours
Source: Eurostat
12Increased Acute Hospital Capacity
Requirements
Public Hospital Inpatient and Day Case Beds, and Population Growth 2008 to 2019
Total Inpatient and Day Case beds Total Population 2008-2019 (April)
2008-2019 YTD
13,584 4921.5
4,857.00
13,231 4,792.50
13,141 13,096 4,739.60
4,687.80
12,847 12,835
12,732 4,645.40
12,630 4,614.70
4,593.70
4,574.90
12,48612,499 4,554.80
12,38612,432 4,533.40
4,485.10
2008 2009 2010 2011 2012 2013 2014 2015 2016 2017 2018 2019
YTD
2008 2009 2010 2011 2012 2013 2014 2015 2016 2017 2018 2019
Source: Department of Health Open Beds Report Sept 2019; Health in Ireland: Key Trends 2017, DOH; CSO
• Population ↑ 9.7% • 22% ↑ (273,433) in inpatient and
day cases performed
• Bed capacity ↓ 2.6%
• 12.3% increased deficit
13Total Inpatient and Day Case Waiting List
(March 2013-Oct 2019)
90,000 86,111
85,000
80,000
75,000
68,086 67,511 (Oct-
70,000
19)
65,000
60,000
55,000
50,000 47,413
45,000
44,870
40,000
Jul-13
Jul-14
Jul-15
Jul-16
Jul-17
Jul-18
Jul-19
May-13
Nov-13
May-14
Nov-14
May-15
Nov-15
May-16
Nov-16
May-17
Nov-17
May-18
Nov-18
May-19
Mar-13
Sep-13
Jan-14
Mar-14
Sep-14
Jan-15
Mar-15
Sep-15
Jan-16
Mar-16
Sep-16
Jan-17
Mar-17
Sep-17
Jan-18
Mar-18
Sep-18
Jan-19
Mar-19
Sep-19
Total Inpatients/day cases Linear (Total Inpatients/day cases)
Source: NTPF (2013 - 2019)
• ↑ 24,089 (55%) in 7 years
14Hospital beds per 1,000 of population in EU, 2018
(or nearest year)
Sweden 2.04
UK 2.11
Denmark 2.44
Spain 2.43
Italy
Ireland
2.62
2.77
Our hospital
Finland
Netherlands
2.8
2.92
bed capacity:
France 3.09
Portugal
Latvia
3.25
3.3
• 31% below
Cyprus
Estonia
3.43
3.45
EU average
Greece 3.6
Luxembourg
EU28
3.7
4.02
• Regular bed
Czech Republic 4.11 shortages
Slovenia 4.2
• Rationing
Hungary 4.27
Malta 4.69
Poland 4.85
Slovak Republic 4.91 care
Belgium 4.98
Austria
Lithuania
5.45
5.47 • Delays
Croatia 5.49
Germany 6.02
Romania 6.84
Bulgaria 7.27
0 1 2 3 4 5 6 7 8
Source: OECD.Stat; Eurostat 16Consultant Vacancies and the Recruitment
and Retention Crisis
• Over 500 Vacancies + 108 non-specialists in
Consultant posts since 2008
• “Jeopardising patient safety” – Justice Peter Kelly
• Medical agency spend 2012-2018 ↑€57m p.a.
• Agency Consultant costs up to three times New
Entrant Permanent Consultant Cost
• New Entrant salary is up to 51% below colleagues
• Failed to fill 38% of posts advertised 2015-2017
• Not competitive – salaries in Australia, Canada and
US up to 48% above non-new entrant salary
• Annual Medical Indemnity costs quadrupled
between 2013-2018. Increase of €184 million
19Number of patients treated on trolleys annually
(2008 – 2018)
108,227
98,981
100,000 92,998 93,621
86,481
80,000 75,859 77,091
Number of Patients
66,308 67,863
63,713
59,435
60,000
40,000
20,000
0
2008 2009 2010 2011 2012 2013 2014 2015 2016 2017 2018
Source: INMO Trolley Ward/Watch
• 108,000 admitted patients treated on trolleys in 2018
• Nearly double ‘national emergency’ level of a decade earlier
21Trolley Analysis January/July 2008-January/July 2019
Source: INMO Trolley Ward/Watch
• Year round problem
• July 2019 (9,439) a record for the month – ↑ 33% on July ’18
• August 2019 (9,562) highest ever for the month – ↑ 10% Aug ’18
• September 2019 (10,641) – worst Sept on record – ↑ 36% Sept ’18
• Oct 2019 (11,452) – worst Oct and 2nd worst month ever – ↑ 26% Oct ’18
22Delays in Accessing Treatment
resulting in missed Cancer KPI targets
• Symptomatic
Breast Disease
Clinics 44% <
target
• Rapid Access
Clinics for Prostate
Cancer patients
21% < target
Source Health Service Performance Profile January to March 2019
23Media Coverage
de Buitléir Report Terms of Reference

“The Review Group will examine and enquire into the effects of
the removal of private activity from public hospitals and will
specifically examine potential benefits and potential adverse
consequences, including any unintended consequences that
may arise, in the removal.
In particular the group will examine and consider…
• possible impacts, both direct and indirect, immediate and
over time, of removing private practice from public hospitals,
including but not limited to impacts on: access; hospital
activity (including specialist services); funding; recruitment
and retention of personnel; and any legal or legislative issues
that might arise.”
                                                              25
Sláintecare and the de Buitléir Report
• €20bn to implement Sláintecare in
first decade (€28bn thereafter)
• Confirms need for more Consultants
and beds
• Removing private care from public
hospitals to cost €6.5bn over 10
years (€8bn thereafter)
• In reality loss in private health
insurance income will not be
replaced
• Exacerbate Consultant recruitment
and retention crisis & hospital
capacity deficits
• Ideology v Pragmatism
26Real World Challenges on Hospital Frontline
• Hospitals crumbling after a decade of cuts (€1.88bn
health capital cuts 2009-2019)
• Health capital budget in 2019 €667m, including
€325m for acute hospitals
• Delays in bed capacity ↑ by 2,600 beds before
2027
• Delays in community beds ↑ by 4,500 beds by 2027
• Rationing of care, growing waiting lists, and trolley
crisis
• Nearly 50% population with PHI: Capacity & Delays
27Real World Challenges on Hospital Frontline
• Need separate additional funding for National
Children’s Hospital (€2Bn vs €0.63Bn estimate)
• National Children’s
Hospital Cost
Overrun:
o €100m in 2019
(€25m from HSE)
o €107m in 2020
o €120m in 2021
o €150m in 2022
• Ongoing problem
• Cost of Relocation of
3 Dublin Maternity
Hospitals
28Real Strategic & Hospital Needs
o Fill all approved Consultant
posts on a permanent basis
o ↑ Frontline capacity to
treat people awaiting
outpatient appointments,
and inpatient and day case
elective procedures
o ↑ Public acute hospital bed
capacity
o ↑ Funding to address
capacity deficits
o Meet KPI targets for cancer
care, surgical procedures
and key aspects of patient
care
29Solutions to Frontline Problems
• Resolve public hospital access crisis
• Insufficient public hospital capacity
o Record waiting lists
o Record numbers on trolleys
• All patients in public hospitals are public
hospital patients who need care without
current delays
30Sláintecare & de Buitléir Reports
• Unintended consequences
• Loss of €6.5Bn PHI per decade
• Won’t be replaced
• Substantial other investment and operating costs
• Already lagging behind NDP 2,600 hospital bed
timetable
• Counter productive – Prolonging Access Crisis
31Sláintecare & de Buitléir Reports
• 2.22m (45%) PHI members • 50:50 reliance Public &
Private Hospital care
• Increased by 64,000 (3%)
since May 2017 • Little or no capacity freed
up in Public Hospitals
• Market segmentation
• 10% PHI members with
Public Hospital cover only 32Removal PHI Income
• Capacity expansion delayed
• Unprecedented Consultant Recruitment &
Retention Crisis
o Type A tried 2008 & 2011 and failed
o Current Pay Inequality: 500+ vacancies
o Increased exodus & greater recruitment
problems
o Deterioration in public hospital care
33Conclusions
• A strategy or plan which is based on
ideology over pragmatism and focuses on
the symptoms rather than the root cause
problems is damaging and deflects from
addressing the real problems.
• Capacity deficits need to be addressed.
• Let’s focus on fixing the real problems.
34Thank You
Support the IHCA campaign at:
35You can also read