Growth in Africa: The opportunity beyond beer - Distell

Page created by Tim Vasquez
 
CONTINUE READING
Growth in Africa: The opportunity beyond beer - Distell
Forecasting the future

Growth in Africa:
The opportunity beyond beer
DECEMBER 2019

                   14|03|2017
                               I N T E R I M F I N A N C I A L R E S U LT S
      Creating memorable moments.
                                 A S AT 3 1 D E C E M B E R 2 0 1 8
         Crafting a better future.
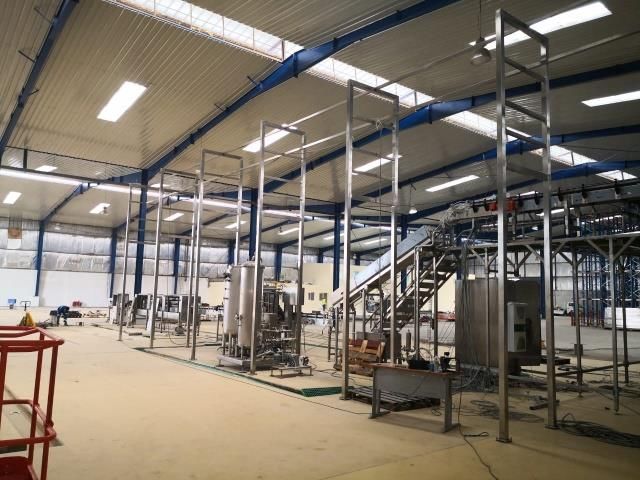
Growth in Africa: The opportunity beyond beer - Distell
Our brands
Our top 15 brands generate 70,2% of total revenue and have recorded strong growth

       Hunter’s           Savanna              Bernini            Amarula         Gordon’s Gin          Klipdrift           Richelieu

  Scottish Leader       Three Ships           Viceroy          4th Street    Autumn Harvest      Drostdy-Hof        Nederburg        Original
                                                                                Crackling                                           Paarl Perlé

                                                         1 4 | 0 3 | 2OF
                                                   OUR REPERTOIRE     0 1 BRANDS:
                                                                          7

               Resonates with a broad spectrum of consumers with different taste profiles; plays across the price continuum; and
                                          is enjoyed at mixed-gender drinking occasions worldwide.
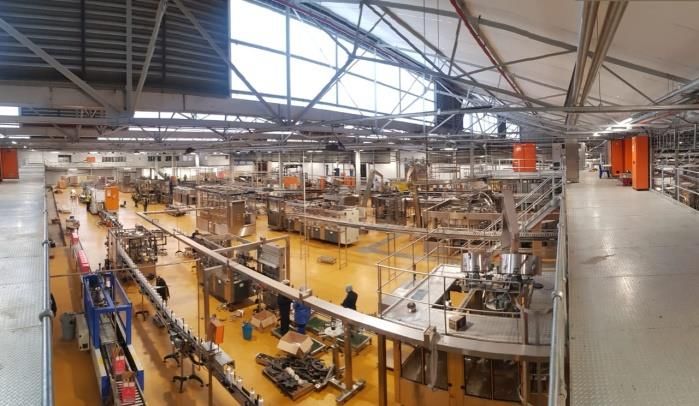
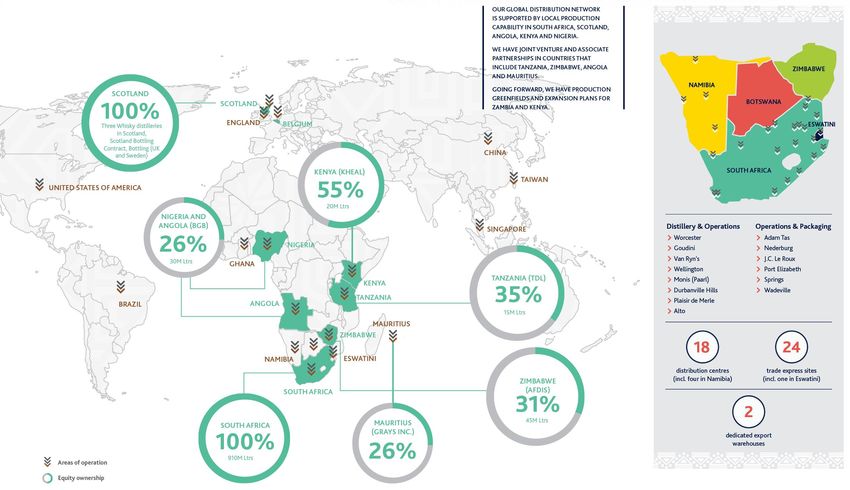
Growth in Africa: The opportunity beyond beer - Distell
WHERE WE OPERATE

                   14|03|2017
Growth in Africa: The opportunity beyond beer - Distell
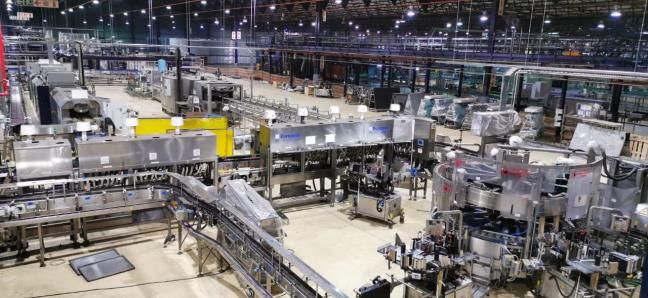
Africa macro dynamics
                                                                                                                                          Key facts
                      Strong population growth
                                                                                                                                        • Represents 16% of the world’s population but consumes 5% of the
                     • 1.3 billion people, growing to 2.5 billion                                                                         world’s beverage alcohol
                       by 20501
                                                                                                                                        • Ave alcohol consumption: 6l vs. 6.3l global average
                     • 2.4% p.a. growth in the short term2
                     • 65% of global population growth
                     • 19 years median age of population                                                                                      GDP 2018 ($bn)                       GDP growth ('18 - '23)
                                                                                                                                            Mozambique     14
                      Rapid urbanisation                                                                                                        Zambia     26
                                                                                                                                                                                      Zambia     1,5%
                  • Urban population to grow from 41%                                                                                                                             South Africa    2,1%
                                                                                                                                                 Kenya       88
                                                                                                                                                                                      Nigeria      2,6%
                    to 59% from 2015 - 2050                                                                                                      Angola       114
                                                                                                                                                                                  Mozambique        3,3%
                                                                                                                                            South Africa                   368
                       Improved (known) political stability                                                                                                                            Angola        4,0%
                                                                                                                                                Nigeria                     422         Kenya           5,7%
                     • Heavy election schedule in 2019/2020
                     • Rising number of democratic regimes                                                                                   Grocery spend 2018 ($bn)                Population (mm)
                        Emerging middle class / consumer demand                                                                                  Algeria      31                        Kenya    51
                                                                                                                                                 Angola        39                   Tanzania     56
                     • 376 million to 582 million people from 2013 - 2030
                                                                                                                                            South Africa            61            South Africa   57
                                                                                                                                                   Egypt             67                 Egypt      97
                     Strong positive GDP outlook into the mid & long-term
                                                                                                                                                  Kenya               77
                    • 3.7% p.a. real growth long term2                                                                                                                               Ethiopia       109
                                                                                                                                                Nigeria               80
                                                                                                                                                                                      Nigeria             196
Source: UN World Population Prospects 2018; McKinsey Global Institute “Lions on the move – realizing the potential of Africa’s
economies; Deloitte – The Deloitte Consumer Review Act: A 21st Century view; Deloitte – African Powers of Retailing, New horizons for
Growth; Oxford Economics; EIU: Africa Trade Report 2018; International Trade Centre (ITC)
1 As compared to 2015 population. 2 2018 – 23 CAGR
Growth in Africa: The opportunity beyond beer - Distell
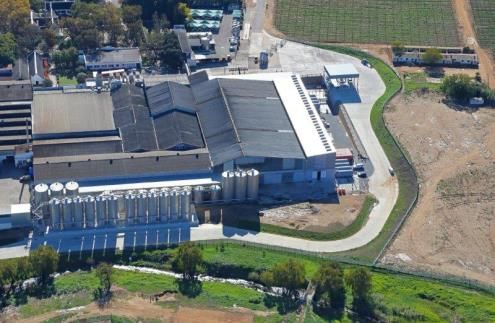
African growth & share trends
                                                                                                  KENYA
                                                                                                                                            %Chg Volumes %Chg Volumes
                        NIGERIA
                                                                                                                       Region                 2013 - 2018  2018 - 2023
                                       56                                                                              Central America             32.4%        22.3%
                      40                                                       48                   48
                                                                                                                       Middle East                 17.4%        16.7%
                                                                                             2                         Africa                      10.3%        12.0%
                        13                                                              2
                                                                                                                       South America                -4.5%         7.7%
                                                                                                                       Southern Europe             10.5%          6.7%
             GHANA*
                                                                                                    1
                                                                                                                       Nordic Countries              1.4%         6.6%
                             26                                                              23            76          Central Europe and
                                                                                                                       Balkans                       1.6%           5.5%
                                   3                                                                                   Caribbean                     6.5%           4.1%
              68                  2
                                                  ANGOLA
                                                                                                                       Asia                         -8.2%           2.6%
                                                                                                       TANZANIA
                                                                                                                       Australasia                  -0.1%           1.7%
                                        30
                                                                                                                       North America                 1.2%          -0.8%
                                   1                                                              18                   North West Europe            -0.9%          -1.2%
                                        5
                                                  64                                     2                             CIS                         -16.8%          -6.4%
                                                                                        3                         77
                                                                                                                       Eastern Europe and
                                                                                                                       Baltics                     -10.8%        -20.6%
                                                  4 8                    18
                                                                                                       MOZAMBIQUE
* In mature developed markets beer                                              53                                      The total African alcoholic beverage market is
share of LAA drops down to average                            58     9
30%-40%. Ghana is an exception, as           29                                                                         expected to grow by 12% in volume by 2023 –
bitters (traditional drink) is massive.                              19                                                   more than double Europe as well as other
                                                           NAMIBIA            SOUTH AFRICA
Source: IWSR / Distell                                                                                 Source: IWSR            developed markets in decline.
Growth in Africa: The opportunity beyond beer - Distell
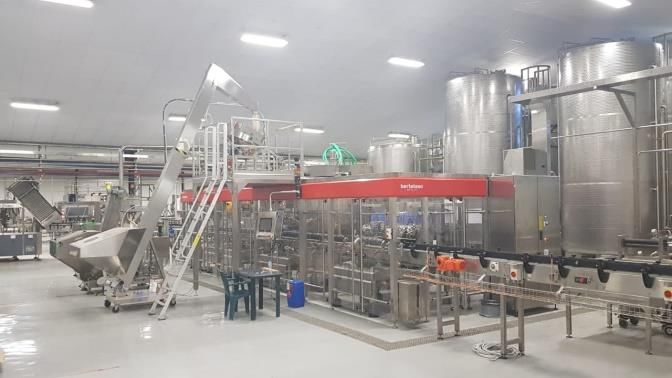
Addressable market sizes
                     South Africa’s has the 2nd largest addressable alcohol market after Nigeria. Despite its size and
                     attractiveness for investment, growth in household incomes and market size will lag the likes of Nigeria
                                                                                                                     CORE ADDRESSABLE POPULATION*
                                                                                                                                  Country, Million, 2018, 2023
                                  8

                                  7
Investment Attractiveness Score

                                                                     South Africa

                                                      8.9; (10.7)                                                                                                                                                        Ethiopia
                                                                                                   Nigeria                                                                         Kenya
                                  6                                                                                                    Tanzania
                                                                                                                                                                     1.8; (3.5)                                                            0.40; (1.5)
                                                                           17.8; (24.7)                                   1.2; (2.4)
                                                                                                                                                                   1.8; (3.1)                                                       1.5; (3.0)

                                                                                                        Zambia                                               Ghana                                 Ivory Coast
                                  5                                                                                     0.45; (0.64)

                                                                                                                               1.8; (2.6)
                                                                                                            Angola                                                       Mozambique
                                  4         The core addressable                                                                                                                                                                                         Total
                                                                                                                                                                                            0.16; (0.48)
                                            market is the alcohol                                                                                                                                                                                        Adult
                                            consuming adult
                                                                                                                                                                                                                                                         Alcohol Consuming Adults
                                            population excluding
                                            the marginalised class                                                                                                                                                                                       Core Addressable Population
                                  3
                                      0,0                            0,5                   1,0                        1,5                       2,0                       2,5                                                    3,0                              3,5
                                                                                                      Household income growth (%), 2019-2023, constant local currency, 2005
                                                                                                                                                                                                                                                                                 6
                   *Core addressable population excludes population segment that are considered as marginalised ( Population that cannot afford branded goods on a regular basis). However, they may make infrequent purchases
                   Sources: CGIDD; WHO; Deloitte analysis, RMB
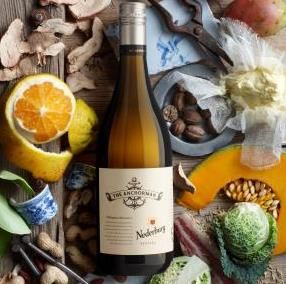
Growth in Africa: The opportunity beyond beer - Distell
Spirits, wine and RTDs  50% of consumption but growing
ahead of beer
Most of the alcohol consumption growth in leading Africa markets will come from value & standard price segments, as the
informal/unrecorded segment declines – with premiumization being a strong longer term opportunity
 ANGOLA ((MILLION LITRES

                                                                                            NIGERIA ((MILLION LITRES
                                                                                5 YR                                                                                               5 YR
   ABSOLUTE ALCOHOL)

                                             +2,4%                             CAGR                                                                                               CAGR

                                                                                              ABSOLUTE ALCOHOL)
                                                                                                                                                 +4,1%
                                                                     99                                                                                                186
                           90                    6            0                                                                                                  2
                                    3                                      Spirits   3.3%                                  158                      15                        Spirits   3.7%
                                                                                                                                      11

                                                                           RTDs      2.1%                                                                                     RTDs      -0.1%
                                          Spirits      Wine                                                                                   Spirits     Wine
                                                                           Wine      1.1%                                                                                     Wine      2.7%
                                          RTDs         Beer                                                                                   RTDs        Beer
                                                                           Beer      1.6%                                                                                     Beer      3.1%

                           2019   Value     Standard      Premium   2023                                                  2019       Value     Standard      Premium   2023

                                                                                                                          KEY DRIVERS
 KENYA ((MILLION LITRES

                                                                                5 YR
  ABSOLUTE ALCOHOL)

                                             +5,9%                             CAGR
                                                                     71                                               Premiumisation: Shift from
                                                 2            1                                                        informal to branded items
                                                                           Spirits   6.2%
                           56      11
                                                                                                                      Rise of female consumers
                                                                           RTDs      6%
                                                                                                                      Mixed gender occasions
                                          Spirits      Wine
                                          RTDs         Beer
                                                                           Wine      4.9%                             Income growth broadens
                                                                                                                       repertoire beyond beer
                                                                           Beer      2.8%
                                                                                                                      Beer share of alcohol can
                 2019             Value     Standard      Premium   2023                                               drop to 30%-40% as markets
    Note: RTDs excludes Beer                                                                                           mature
    Source: GlobalData, IWSR
Growth in Africa: The opportunity beyond beer - Distell
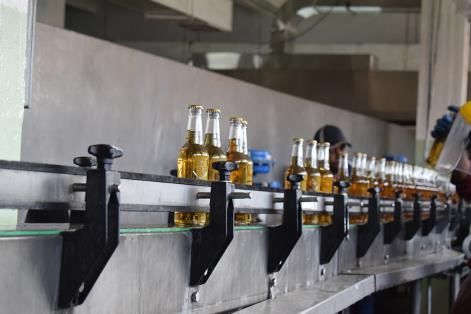
Key consumer trends in Africa

As markets mature in Africa,
alcohol consumption is set to
                                   01   Female consumption
                                        •
                                        •
                                            To grow significantly with economic participation
                                            Mature markets = 4 litres LAA per capita & 2 litres in low income countries
grow and expand in repertoires &        •   Cider/RTD’s trends growing whilst brands offering more options targeted at females
demographics

                                   02   Premiumisation
                                        •   Per capita consumption increase & growth in value (60% higher in mature markets vs. low
                                            income markets)
                                        •   Informal liquor decline as formalisation grows with branded goods

                                   03   Consumer repertoire expanding beyond beer
                                        •
                                        •
                                            Beer = 65% of absolute alcohol consumed in Africa – can reduce to 45% as markets mature
                                            Wine: Key entry level category to win share from beer
                                        •   Whisky established as a category; showing good growth potential

                                   04   Pack Size and Flavour options
                                        •   Beers moving to shared pack formats; RTD’s & FABs introducing more flavour options

                                        Total Brand Experiences

                                   05   •
                                        •
                                            Increased foreign competitor activity resulting in more personalised brand experiences
                                            Local insight and brand investment driving choice
Growth in Africa: The opportunity beyond beer - Distell
The female opportunity

                     Internationally:
                     •  Females represent 85% of consumer buying decisions
                     •  Considered the largest market opportunity in the world
                     •  Controlling $20 trillion in annual consumer spending globally
                     •  Expected to rise to $30 trillion within next 5 years
                     •   Influencing drink choices of male counterparts through the consolidation of a
                         more unisex drinking culture
                     South Africa:
                     • 21-million female consumers expected in local market by 2025
                     • Will increase labour force participation
                     • Currently 9.5-million (2019) >> 11-million (by 2025)
                     • Increasing this segment’s spending power
                     • Strong bottle-serve culture, but making collective decisions on drinks
                         favouring vodka, gin, Cognac, cider, champagne and wine.
Growth in Africa: The opportunity beyond beer - Distell
Females represent an exciting opportunity based on
unmet needs-SA segmentation example

   Currently satisfied by       Female-specific and mixed                More potential exists to delight              Distell’s approach to winning
     traditional offers         gender demand moments                            unmet needs                              with female consumers
                            OFF PREMISE, MIXED GENDER OCCASIONS
                                                                                           •   Open to unique and
                            Close Connections      Savour & Treat time                         unusual taste
                                                                                               experiences,

                                                                                           •   Desire to explore &
                                                                              Bold             experiment.
                                                                         Interpretations
         Ciders/FABS

                                                                                           •   Health & Wellness
                                         Weekend Release
                                                                                           •   Manifestations of
                                                                                               moderation offer
                                                                           Mindful
                                                                         Consumption
            Spirits

                            ON PREMISE, FEMALE-SPECIFIC OCCASION                           Building meaningful         Brand and marketing
                                                                                           connections in a hyper
                                                                                                                       offerings tapping into trends:
                                                                                           connected & digital world
                                                                                           amplifying premium          - Engaging brand
                                                                                           credentials, purpose and        propositions
                                                                             Real          brand story-telling
                                                                          Connections                                  - Tailored offerings
            Wines
                                         Girl’s Night Out
Significant opportunity for leading female empowerment
indicators to improve: SA vs. rest of Africa
•        Bar religion & societal norms, the most important driver of future female consumption is financial freedom
•        1. Access to secondary education; 2. Being employed; and 3. Earning a good salary
                                                                                                                                        LABOUR FORCE
                GENDER INEQUALITY                         ESTIMATED EARNED                  ACCOUNT AT A FINANCIAL                                                        POPULATION WITH SECONDARY
                                                                                                                                        PARTICIPATION
                     INDEX                                     INCOME                            INSTITUTION                                                                     EDUCATION**
                          20I7                               20I5, ‘000 PPP$                            20I5
                                                                                                                                            RATE*                                       2005-2015
                                                                                                                                            2005-2015

     United States               0.189                                               43.9                           95.0%                                55.7%                                          95.5%

               Kenya                         0.549           2.5                                            52.0%                                          62.4%                        29.2%

            Tanzania                         0.537           2.3                                   17.0%                                                         79.5%             11.9%

             Ethiopia                       0.502          1.3                                      21.0%                                                        77.2%             11.2%

         South Africa                    0.389                                 9.1                             69.0%                                    47.9%                                       74.2%

              Angola      N/A                                       5.1                             22.0%                                                       75.3%            N/A

              Nigeria      N/A                                     4.4                                 34.0%                                            50.4%                     N/A

     •         In terms of gender inequality index, Kenya has an index score of 0.55 and is the highest of Distell’s African countries indicating a generally marginalized female workforce in terms of income
     •         The population of females with secondary education was 29.2% on average, and this is expected to continue to grow into the future indicating a growing base of informed female cohort that could
               generate a market for Distell in the future once income levels and biases improve

    *Include female population above age 15+
    **Include female population above age 25+
    Source: United Nations Development Programme (UNDP)
Our Africa performance -June 2019 results

     SOUTH AFRICA                                    AFRICA (excl SA)                                 KWA Holdings EA
                                                                              incl BLNS   excl BLNS

                                 -0,9%                                                                           +56%
                                                                           +10,3%         +28,6%                 Volume
                                Volume
                                                                           Volume         Volume
                                                                                                                 +47%
                                 +9,5%                                                                           Revenue
                                                                            +20,0%        +40,7%
                                Revenue                                    Revenue        Revenue     • Growth driven by mainstream spirits and
                                                                                                        wines led by Kibao, Hunters Choice, Cellar
 Cider & RTD revenues up 11,5%
                                                 Cider & RTD Revenues up 15,6%                          Cask & 4th Street
 •   Led by Savanna, Extreme and Bernini
                                                 Spirit Revenues up 37,2%                             • Acquired property in Tatu City to double
 •   Successful Esprit launch
                                                 Wine Revenues up 11,3%                                 local production capacity
 Spirit Revenues up 11,6%
                                                                                                      • Doubled revenue and tripled EBITDA since
 •   Strong double-digit growth from Vodka and   •    Exceptional double-digit volume and revenue       acquisition
     Gin led by Cruz, Old Buck and Gordon's           growth across all key markets except Angola
 •   High single-digit Whisky growth led by           and Namibia                                     KES                  Jun-15      Jun-19
     Bain's, Scottish Leader and Harrier         •    Growth in Spirits category led by Kibao,        Volumes ('000 Li)    9,077       14,998
 •   Brandy under pressure due to pricing             Hunters Choice & Best Whisky
 Wine Revenues up 3,2%                           •            1 4led|by0 Savanna
                                                      RTD growth         3 | 2 0&1Hunter’s
                                                                                   7                  Revenue              4,419,091   8,184,556
 •   Growth from Drostdy-Hof and Nederburg       •    Nigeria & Kenya additional local production     EBITDA               261,394     1,013,136
 •   Volumes impacted by pricing (input costs)        established; Angola & Ghana planned
                                                                                                      EBITDA %             5.9%        12.4%
 Margin improvement in all 3 categories
Investing behind an African manufacturing footprint
FUTURE DEVELOPMENTS
• SA: Northern Mega DC                                                              R1610m
• Africa: Angola & KWAL Tatu City                                                     CAPEX
• Mozambique & Zambia                                                               2015 - 2019
                                                                                                  SA CAPACITY BUILD
  investigation                                                                                     480m L/pa cider
                                                                                                      70m L/pa BIB
                                                                                                      60 m L/pa RB
                                                                                                     50 m L/pa NRB
                                       NIGERIA                  KENYA

                           ANGOLA
                                                                        WADEVILLE

                                                 14|03|2017

                                    NEDERBURG                 SPRINGS
Key lessons from Africa

            Local brands key

         Building local RTM & customer affinity

         Local Production vs. Export model

         Africa not one continent

         Prudent risk management is imperative

         Measured capital allocation – not betting the farm

         Local partnerships to ensure localisation & beneficiation
You can also read