UGANDA BUREAU OF STATISTICS - INTERNATIONAL WOMEN'S DAY CELEBRATIONS MARCH 08, 2021 - Uganda ...
←
→
Page content transcription
If your browser does not render page correctly, please read the page content below

UGANDA BUREAU OF STATISTICS

INTERNATIONAL WOMEN’S DAY CELEBRATIONS MARCH 08, 2021

GLOBAL THEME:      Women in Leadership - Achieving an
                   Equal Future in a COVID-19 World

                                        NATIONAL
                                        THEME:
                                        Building on
                                        Womens’
                                        Strength
                                        for a Better
                                        Future in
                                        the COVID-19
                                        World
IN THIS BULLETIN...
Exposing Gender Issues through Statistics

                                            UGANDA’S POPULATION AT A GLANCE			                                                  4

                                            WOMEN REPRODUCTIVE HEALTH				6

                                            MATERNAL MORTALITY RATE				5

                                            BIRTHS ATTENDED TO BY A SKILLED HEALTH PERSONNEL 8

                                            PATIENT HANDLING AT THE HEALTH FACILITY		                                           9

                                            MAJOR CONCERNS WITH CLIENTS ACCESSING

                                            SERVICES AT THE HEALTH FACILITY				                                                 10

                                            WOMEN IN LEADERSHIP AND DECISION MAKING                                             10

                                            OTHER KEY INDICATORS ON WOMEN			                                                    12

                                            UBOS CELEBRATES THE WOMEN OF UGANDA
                                            At the national level, the theme earmarked for the day is cognizant of the
                                            role that women play in society. Women and girls constitute the majority
                                            of the population. Females constitute a majority of the population (51%)
                                            and as such require special attention to eliminate challenges that hinder
                                            not only their individual progress but for the entire population. Women and
                                            girls who are empowered are integral in the household and community,
                                            and for the sustainable development of the country. In the 1995 Uganda
                                            Constitution, matters pertaining Women Empowerment are well articulated.
                                            Statistics indicators on the progress the country has made in addressing
                                            the gender issues in the country are compiled by UBOS.

                                                     It is therefore our pleasure to share with you the selected statistical
                                                     indicators across sectors highlighting the efforts so far undertaken to
                                                     bridge the gender equality gap for holistic national development.

                                   2
                                                          Women in Leadership - Achieving an Equal Future in a COVID-19 World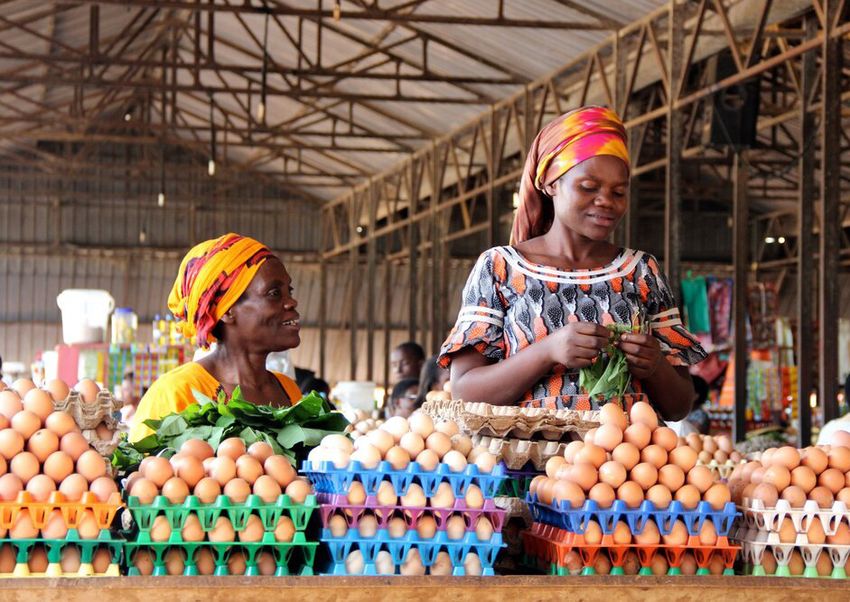
H.E Gen. Yoweri Kaguta Museveni
                      President of the Republic of Uganda

          CONGRATULATORY MESSAGE
The Board of Directors, Management              the President upon another resounding
and Staff of the Uganda Bureau of               electoral victory setting pace for
Statistics congratulate His Excellency          another five-years of transforming
the President of the Republic of                and securing our nation’s future.
Uganda H.E Gen. Yoweri Kaguta                   We commit ourselves to continuously
Museveni and the entire people                  deliver on our mandate of producing
of Uganda on this occasion of                   and disseminating quality official
celebrating the International Women’s           statistics for informed policy and
Day on 8th March, 2021.                         decision making, and tracking our
In the same spirit, we congratulate H.E         progress in achieving our Vision 2040.

                      Long live Your Excellency,
                   Long live the People of Uganda!

                                                      Chris N. Mukiza (PhD)
                                                        Executive Director
                    Albert Byamugisha (PhD)
                    UBOS, Board Chairman

   Building on Womens’ Strength for a Better Future in the COVID-19 World
                                                                                         3
UGANDA’S POPULATION AT A GLANCE
    •   Uganda’s population grew from 5 million persons in 1948 to 6.5 in 1955.
    •   After Independence in 1962, Uganda’s population rose to 9.5 million persons
        in 1969.
    •   The projected total population for Uganda as at mid-year 2021 is 42.8
        million persons.
        o Females account for 51% of the total population while males account
             for 49%.

             51%                                              49%

        o   Wakiso district remains the most populated with a projected population
            of 3,105,700 million persons by mid-2021, followed by Kampala City
            Council Authority with a projected population of 1,709,900 persons.

        o   Kalangala district has the least population, projected at 69,500
            persons in mid-2021.
    Figure 1: Population of Uganda, 1948 – 2021 (in millions)

4
                    Women in Leadership - Achieving an Equal Future in a COVID-19 World
•     Distribution of population by age-group shows that females dominate age
      groups from 20-24 years and above
•     Among the elderly aged 80- years and above, about six out of every ten
      are female

Table 1: Population by Age Group as at Mid-Year 2021
                                                                                        Percent
 Age group                 Male                  Female                    Total
                                                                                        Female
    0-4                 3,681,400              3,589,000                7,270,400        49.4%
    5-9                 3,231,000              3,066,900                6,297,900        48.7%
    10-14               2,892,200              2,735,100                5,627,300        48.6%
    15-19               2,574,500              2,527,900                5,102,400        49.5%
    20-24               2,085,200              2,155,900                4,241,100        50.8%
    25-29               1,562,100              1,814,300                3,376,400        53.7%
    30-34               1,203,000              1,455,500                2,658,500        54.7%
    35-39                952,600               1,108,900                2,061,500        53.8%
    40-44                747,300                853,400                 1,600,700        53.3%
    45-49                620,600                680,600                 1,301,200        52.3%
    50-54                474,500                499,100                  973,600         51.3%
    55-59                366,200                420,700                  786,900         53.5%
    60-64                245,100                292,700                  537800          54.4%
    65-69                168,900                210,400                  379,300         55.5%
    70-74                121,900                155,600                  277,500         56.1%
    75-79                 81,900                113,800                  195,700         58.2%
    80+                   80,200                117,500                  197,700         59.4%
Total                 21,088,600             21,797,300               42,885,900         50.8%
Source: UBOS Censuses and Population Projections Reports 1948 – 2021

•     The Life expectancy has improved to 63.7 years from 50.4 years in 2002.

•     The women have continued                                          64.5 years
      to have a longer life                                                             62.8 years
                                                                           52.0 years
      expectancy from 52.0 years
                                                                                        48.8 years
      in 2002 to 64.5 years now
•     Male life expectancy stands
      at 62.8 years compared to
      48.8 years in 2002.

            Building on Womens’ Strength for a Better Future in the COVID-19 World
                                                                                                     5
Figure 2: Life expectancy at birth, 1991-2016

    Source: UBOS Periodical Censuses and Surveys

                  WOMEN REPRODUCTIVE HEALTH
    •   The median age at first marriage (for persons aged 25 -49 years) is at 19
        years for women and 23 years for men.

    •   60% of pregnant women attend antenatal care (ANC) visits for at least
        four (4) or more times as recommenced during their entire pregnancy, an
        increase from 48% in 2011.

    •   The total number of children a woman can produce during her life time
        subject to the prevailing mortality patterns has declined to about five children
        per woman from seven children per woman in 1991.

    •   The infant mortality rate stands at 43 deaths per 1,000 live births down from
        54 deaths per 1, 000 live births in 2011.

    •   • The under-five mortality rate is 64 deaths per 1,000 live births down from
        90 deaths per 1,000 live births in 2011.

6
                     Women in Leadership - Achieving an Equal Future in a COVID-19 World
Figure 3: Average Number of Births per Woman (Fertility) 1988-2016

Source: Uganda Demographic and Health Survey (UDHS) Report, 2016

                MATERNAL MORTALITY RATE
The maternal mortality ratio for women aged 15-49 is 368 deaths per 100,000
live births compared to 438 deaths per 1000 live births in 2011.

          Figure 4: Trends in Pregnancy - Related Mortality Ratio

  Source: Uganda Demographic and Health Survey (UDHS) Report, 2016

       Building on Womens’ Strength for a Better Future in the COVID-19 World
                                                                                7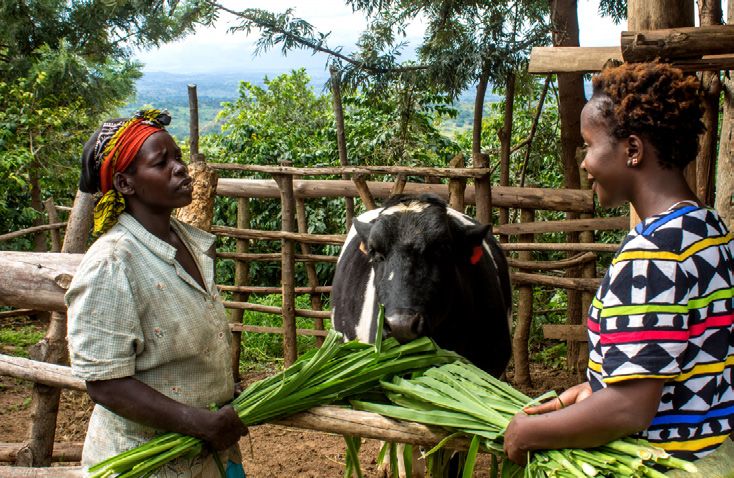
BIRTHS ATTENDED TO BY A SKILLED
                          HEALTH PERSONNEL
    Obstetric care from a skilled health professional during
    delivery is recognized as critical for the reduction
    of maternal and neonatal mortality.

    •   During pregnancy, it is recommended that
        women attain at least four (4) Antenatal Care
        (ANC) visits under the supervision of a skilled
        health professional.

    •   60% of pregnant women attain the requisite
        ANC visits up from 48% in 2011.
    Figure 5: Deliveries in health Facilities, 2000 – 2016 (%)

    •   The percentage of child births                       o     For instance, 86% of first
        attended to by a skilled health                            births are delivered by a
        professional has increased over                            skilled health professional
        the years, from 37% in 2001 to 73%                         compared to 64% for the
        in 2020.                                                   sixth or higher birth order.
        o The proportion of deliveries
            attended to by a skilled                    •     The percentage of childbirths
                                                              attended to by a skilled health
            health professional reduces
                                                              professional has increased over the
            with increasing birth order.

8
                      Women in Leadership - Achieving an Equal Future in a COVID-19 World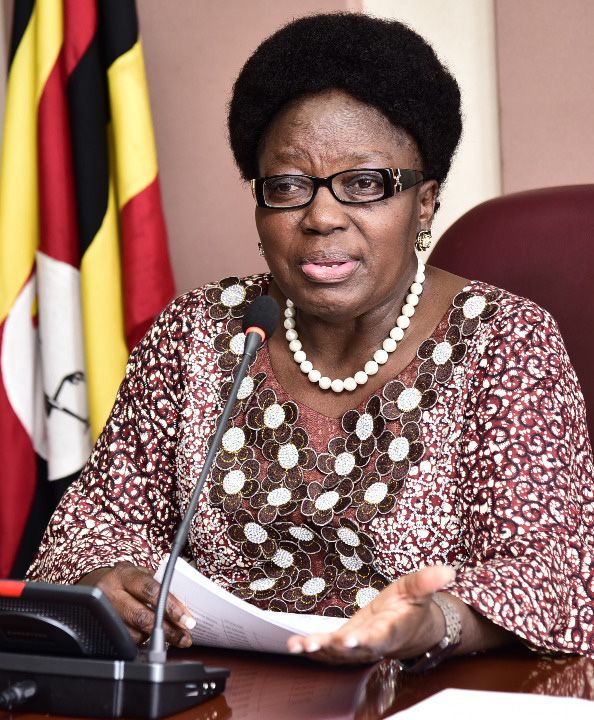
years, from 39% in 2001 to now 73%.                     o     For    instance,    98%    of
    o The proportion of child births                              pregnant women with more
       attended to by a skilled                                   than secondary education
       professional increases with a                              are delivered by a skilled
       higher level of education of                               provider compared to 63%
        the mother.                                               of the mothers with no formal
                                                                  education.
Source: Uganda Demographic and Health Survey (UDHS) Report, 2016

     PATIENT HANDLING AT THE HEALTH FACILITY
How clients at health facilities are
handled is a major cause for debate
in various communities. Scepticism at
the way in which a client is handled
whenever they visit the facility is a
thought that crosses the minds of those
in need of health care.

•   Overall, 79% of the communities
    in 2019/20 felt that patients are
    handled with respect compared
    to seventy-five percent in 2018/19.

•   Seventy-two        percent       of
                                                      •     In 2019/20, negligence was only
    communities reported satisfaction
                                                            reported in government health
    with the privacy and confidentiality
                                                            facilities and the percentage
    with which patients were handled
                                                            of communities that reported it
    at health facilities which was a
                                                            declined to 12 percent in 2019/20
    decline from 77 percent in 2018/19.
                                                            compared 16 percent in 2018/19

Table 2: Clients’ Satisfaction with Patients Handling at the Health Facility (%)

Source: Uganda National Panel Survey, 2019/20

       Building on Womens’ Strength for a Better Future in the COVID-19 World
                                                                                                  9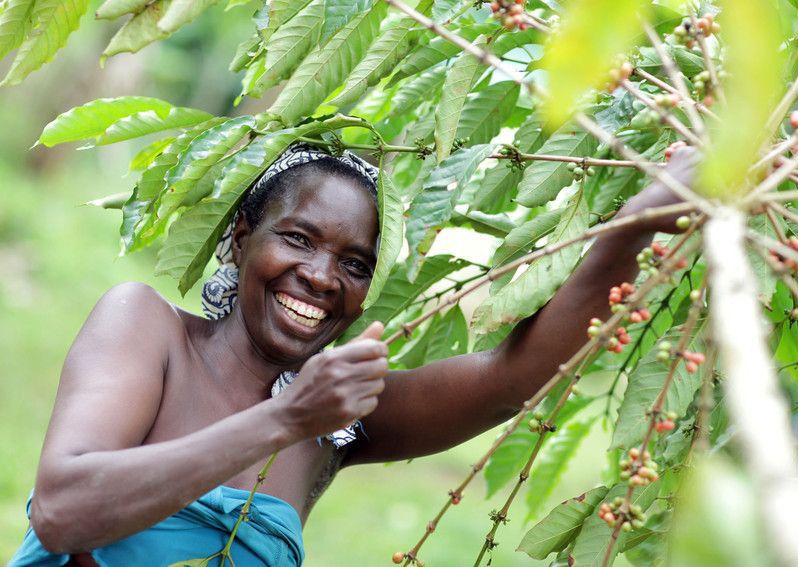
MAJOR CONCERNS WITH CLIENTS ACCESSING
         SERVICES AT THE HEALTH FACILITY
 •    Six in every ten communities (63%) in 2019/20 reported long waiting time
      as a major concern in accessing services at health facilities which is an
      increase from 60% in 2018/19.

 •    Regarding unavailability of medicines/supplies, 68 percent of communities
      reported it as a major concern in 2019/20 similar as it was in 2015/16.

 •    The percentage of communities reporting affordability as a major concern
      (13%) has also remained the same in both survey periods 2018/19 and
      2019/20.
 Table 3: Concerns with Clients Accessing Services at Health Facility (%)

 Source: Uganda National Panel Survey, 2019/20

     WOMEN IN LEADERSHIP AND DECISION MAKING

 •    There is a demonstrated positive trend towards women empowerment

 •    Female cabinet ministers have increased from 14 (19.4%) in 2006 to 26
      (49%) in 2016.

10
                 Women in Leadership - Achieving an Equal Future in a COVID-19 World
• World over, Female Members and re-elected in 2016. The Speaker
of Parliament have increased is now a role model for fellow women
compared to the pre- Second World aspiring top leadership positions in
War when the Austrian Parliament the country.
was the only one to have a Female
• In F/Y 2019/20, out of 457 Members
speaker of Parliament.
of the Ugandan Parliament, 296
• The Arab region only elected their were directly elected members,
first Female Speaker of parliament 124 district women representatives.
for the United Arab Emirates in 2015.
• Overall, out of the total number
• In Uganda, the First Female Speaker of Members of the Ugandan
of Parliament was elected in 2011 Parliament, 35% were women.
Table 4: Composition of Parliament as at 30th June, 2020.
Source: Parliamentary Commission Annual Report 2019/20
• In the just concluded 2021 general elections, out of 353 directly elected
Members of Parliament, 18 of them are women.
• Reserved seats for Women elected MPs increased from 122 in 2006 to
146 in 2021.
Building on Womens’ Strength for a Better Future in the COVID-19 World
11Table 5: Women representation in Parliament from the 2021 General Elections.
Source: Uganda Electoral Commission
OTHER KEY INDICATORS ON WOMEN
Composition of
Women in Local
Governments
• Women in local government
constitute 45.7% of the total,
higher than affirmative action level
requirement of 30% provided in the 1995
Constitution of the Republic of Uganda.
o Specifically, 42% of district councillors
are female,
o 41.9% are councillors at Municipal
divisions
o 46.5% are councillors
at Sub-county/Town
council (UBOS 2017).
12
Women in Leadership - Achieving an Equal Future in a COVID-19 WorldDecision-making
Decision making at household level is about making major household
determined by access and control over purchases (64%) (UDHS 2016).
resources and assets, opportunities and
• As regards to financial decision, 53%
entitlements.
of the respondents made financial
• Half (51%) of the married women decisions in consultations with their
aged 15-49 participate in only three partners/spouses while 35% reported
specific household decisions either that they made decisions alone.
alone or jointly with their husbands.
• Consultative decision-making within
• Women are more likely to participate households especially on finances is
in decisions about their own health more common in rural areas (55%)
(74%) and visits to their families or than in urban areas (46%).
relatives (72%) than in decisions
WATER SOURCES
• The water sub-sector aims at schemes and rain water.
ensuring availability and sustainable
• Overall, 80 percent of households
management of water and
had access to improved water
sanitation for all. Safe drinking water
sources in 2019/20 compared to
is a critical factor affecting the
75 percent of households in 2015/16.
health of the population. The WHO/
UNICEF Joint Monitoring Programme • The percentage of households in
(JMP) has established a standard urban areas that had access to
set of drinking-water categories that improved water sources increased
are used for monitoring purposes. by five percentage points between
2015/16 and 2019/20.
• An “improved” drinking water
source is one that, by the nature of
its construction and when properly
used, adequately protects the
source from outside contamination,
particularly fecal matter. Sources
which are likely to provide water
suitable for drinking have been
considered as improved sources
and include private connection to
pipeline, boreholes, protected wells
and springs, water from gravity floor
Building on Womens’ Strength for a Better Future in the COVID-19 World
13Table 6: Households whose main source of drinking water is improved (%)
Source: Uganda National Panel Survey, 2019/20
ASSET OWNERSHIP BY WOMEN
Assets can be financial or physical. 27% by only female members while
Asset ownership is at the centre of family 36% are jointly owned.
power relations, mainly between men
• Males dominate ownership of
and women.
bicycles, radios, motorcycles and
• Among the households that have cars.
owner occupied houses, 41% are
• Overall, compared to 2012/13,
jointly owned by females and males,
ownership of assets by males has
28% by only females, and 31% by
declined considerably alongside
only males.
a corresponding increase in joint
• Of the households with agricultural ownership of assets by both males
land, male members own 34% only, and females.
Table 7: Ownership of selected household assets by sex of household members (%)
2012/13 2016/17
Both Men Both Men
Men Women and Men Women and
Asset type Only Only Women Only Only Women
Furniture 61.0 14.8 24.2 31.3 28.1 40.6
Mobile Phone 67.1 13.3 19.5 39.4 26.7 33.9
House 59.2 15.6 25.3 30.5 28.1 41.4
Agricultural land 62.3 14.3 23.3 33.5 26.7 39.8
Radio 69.6 12.7 17.6 50.8 21.8 27.4
Livestock - - - 29.8 28.1 42.1
Land (excluding agric land) - - - 37.1 26.6 36.3
Bicycle 75.7 6.8 17.5 63.1 13.5 23.4
Television 65.4 14 20.6 36.9 26.2 37
Solar 70.9 9.2 19.9 44.6 20.2 35.2
Appliances 59.8 16.3 23.9 34.2 27.8 38
Buildings 66.6 11.3 22.1 44.4 22.8 32.8
Jewellery 34 52.4 13.5 14.4 67.1 18.6
Cassette 68.4 11.9 19.7 41.2 22.2 36.6
Motorcycle 87.8 2.5 9.6 75.9 4.2 19.9
Refrigerator 60.5 18.7 20.8 29.6 27.7 42.7
Home Theatre (music system) - - - 38.6 15.8 45.6
Vehicle 76.9 8.4 14.7 62 7.8 30.2
Source: Uganda National Household Survey, 2016/17
14
Women in Leadership - Achieving an Equal Future in a COVID-19 WorldBuilding on Womens’ Strength for a Better Future in the COVID-19 World
15HOUSEHOLDS USAGE OF ENERGY FOR
COOKING PURPOSES
• For cooking purposes, overall, 60 percent of
households use a 3-stone/open fire stove,
compared to 39 percent using an improved
cook stove (ICS) while only one percent use a
clean fuel stove.
• In rural areas, about 7 out of every 10 households
use the 3-stone/open fire stove for cooking
compared to households in urban areas
• At regional level, the majority of households in
the Western (73%) and Eastern (71%) dominated
the use of 3-stone/open-fire stoves as the main
cook stove.
• Improved cook stoves are mainly used in Female-
headed households (40%) compared to male-
headed households (39%).
• Also, the improved cook stoves are common
among urban households (68%) than their rural
counterparts (28)
• More than half of the households in Central Region
(55%) use the improved cook stoves.
16
Women in Leadership - Achieving an Equal Future in a COVID-19 WorldTable 8: Distribution of households by type of main Cook Stove (%)
Source: Energy for Rural Transformation (ERT) Survey, 2019
COVID-19 SURVEYS
Following the outbreak of CORONA
Virus, the Bureau has continued with
the COVID-19 telephone surveys to
track the impact of the pandemic
on households. So far three rounds
have been disseminated and
findings show that the incidence
of wearing masks in public has
declined.
At the national level 66% of the
population, in September/October,
reported to be wearing a mask all
or most of the time while in public
a reduction from 72% reported in
July/August 2020
Urban residents were more likely
to wear masks compared to their
rural counterparts.
Building on Womens’ Strength for a Better Future in the COVID-19 World
17Figure 6: Self-reported wearing a mask while in public and among 10 people
respondents knew (%)
Source: COVID-19 Household Telephone Surveys
18
Women in Leadership - Achieving an Equal Future in a COVID-19 WorldFigure 7: Map of Uganda Showing Population
Distribution for Districts & Cities
Building on Womens’ Strength for a Better Future in the COVID-19 World
19UGANDA BUREAU OF STATISTICS
Plot 9 Colville Street
P.O Box 7186, Kampala – Uganda
Tel: +256-414-706000
Fax: +256-414-237553
Email: ubos@ubos.org
Website: www.ubos.org
:Uganda Bureau of Statistics
:@StatisticsUgYou can also read