Investor Presentation Q3 2020 | October 2020
←
→
Page content transcription
If your browser does not render page correctly, please read the page content below
BUILDING FOR
                                      STRENGTHENING TODAY,

                                                  TOMORROW
Investor Presentation Q3 2020 | October 2020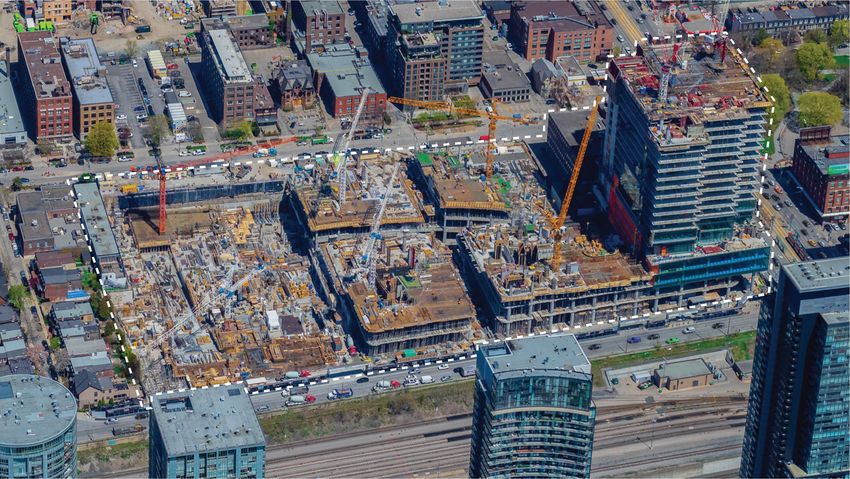
90.2%
                                                                              1
                            Retail:

                                         8.1%
                                                                              1
About RioCan                Office:
                                                                                             ~78%
                            Residential: 1.7%
                                                                               1
High quality portfolio                                                                          of tenants
concentrated in
Canada’s major                   Increasingly                                           Providing Strong or
markets with a strong,        Mixed-Use Portfolio                                         Stable Income
diversified and largely
defensive tenant base

                                   ~42M Sq. Ft.                                             96.0%
                                     Development Pipeline                               Committed Occupancy during
                                                                                            Global Pandemic

                                   Embedded                                             With Significant
                                  Value Creation                                        Room to Grow to
                                     Potential                                           Market Rents
                          1. Based on annualized rental revenues as of Sept. 30, 2020          Investor Presentation Q3 2020 | RioCan | 2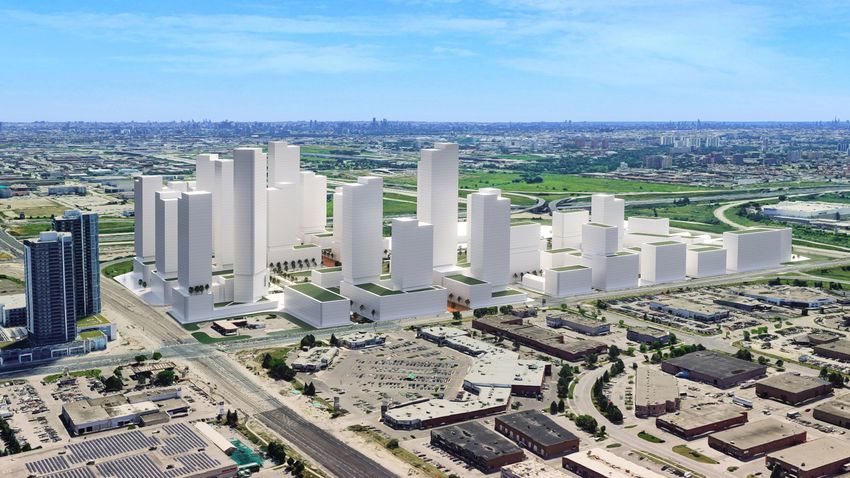
Why Invest in RioCan
•   High quality, sustainable income given our
    tenant composition, low enclosed mall
    exposure and major market concentration

•   NAV creation and additional income through
    scaled development program with in-house
    expertise and advanced zoning entitlements
    ahead of peers

•   Balance sheet strength and ample liquidity

• Deeply discounted unit price trading at record
%
    low FFO multiple despite strong Q3/20 cash
    rent collection of 93.4% amidst the pandemic

                               Investor Presentation Q3 2020 | RioCan | 3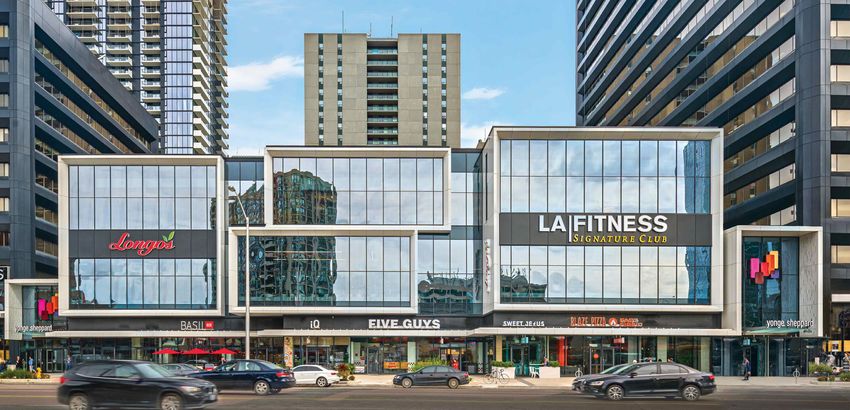
Deep
                                                                                                                                          %
Highly compelling investment opportunity
                                                                                                                                                 Discount

Current negative sentiment will shift when health crisis dissipates

                                                            18.0x

    Dislocated trading
    price represents                                        15.0x

    tremendous value
                                                            12.0x       5-year avg
    in RioCan units                                                     FFO Multiple:                                                      9.0x1
  Current                    5-yr Avg                                   13.2x
FFO Multiple        Vs     FFO Multiple                      9.0x

   9.0x1                       13.2x
                                                             6.0x
                                                              27/Oct/16                27/Oct/17   27/Oct/18   27/Oct/19               27/Oct/20

1. Priced as of October 27, 2020 based on 1-year forward FFO/unit consensus estimate
                                                                                                                 Investor Presentation Q3 2020 | RioCan | 4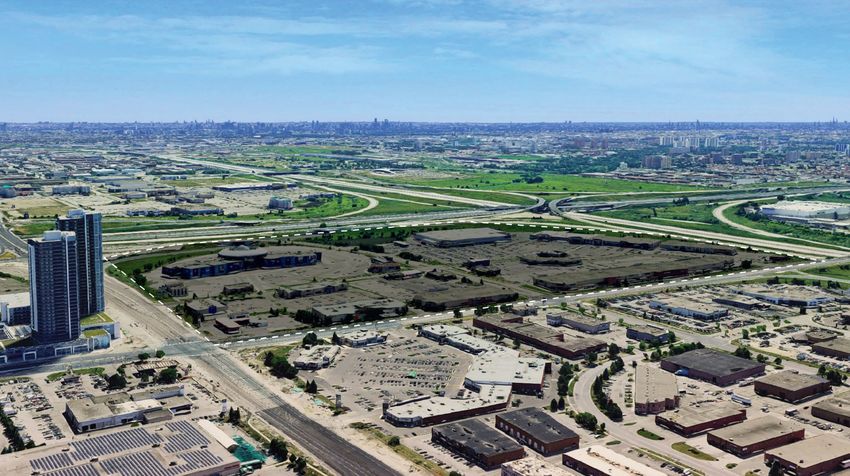
High Quality,
                                                                                                                               Sustainable Income

RioCan locations – Where Canadians Live, Work and Shop
Concentrated in transit corridors of Canada’s fastest growing major markets

 Dense Population
 201,3261 People

 Strong Household Incomes
 $117,9181

 Last Mile Hub
 Ideal for micro-fulfillment and
 Buy Online Pick-up In Store

 Residential Development
 Potential
 Highest and best use redevelopment
 addressing rental supply gap
                                                                                          Percentage of annualized rental revenue as of Q3 2020
1.   Population and average household income within 5Km of RioCan center, respectively;
     Source: DemoStats – 2020 - Trends, ©2020 Environics Analytics
                                                                                                    Investor Presentation Q3 2020 | RioCan | 5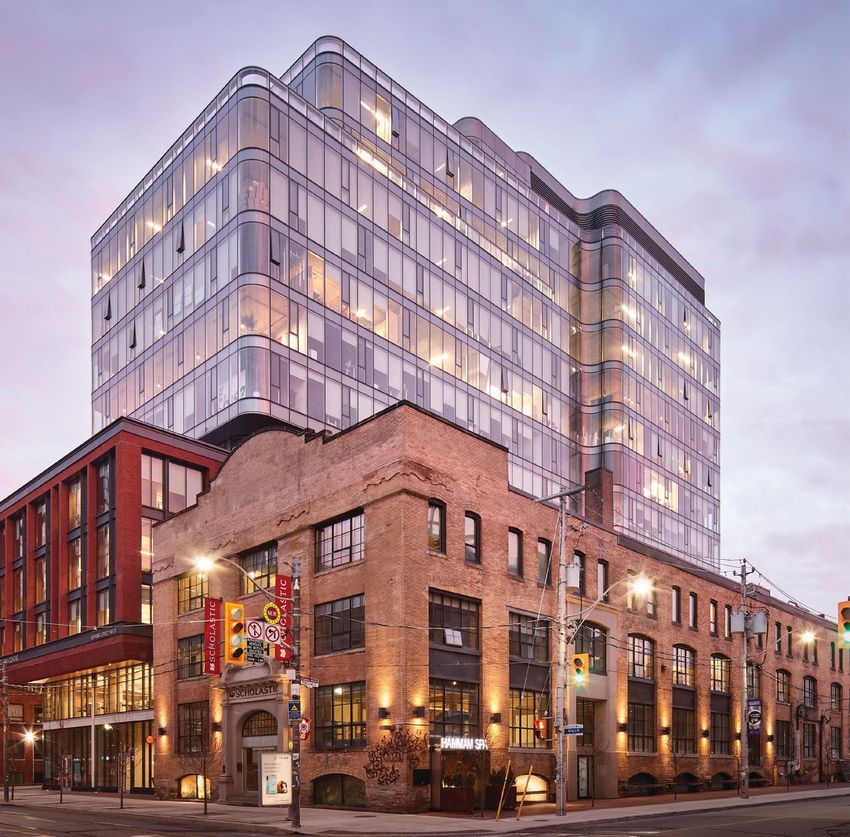
High Quality,

Rent Collection during COVID-191
                                                                                                                                                Sustainable Income

Positive trend through the quarter with                                93%2 of tenants currently open

        Rent Collection Trend                                                      Rent Collection by Tenant Type
                  (% billed gross rent)                                                                (% billed gross rent)

                                             ~94%
             ~91%
                                                                0.5%                                              78%         of tenants
               ~6%
                                                                                       ~61%

                                              ~93%
                                                                                                                           97%
                                                                                                          Q3 cash rent collection
             ~85%                                                                      ~17%
                                                                                                                       85%
                                                                                       ~22%
                                                                                                              Q3 cash rent collection
              Q2 2020                         Q3 2020
                                                                               Strong tenants           Stable tenants              Potentially Vulnerable
                                                                               National office and      Tenants with strong or      tenants
             Cash Rent Collection          Approved Deferrals                  essential / necessity    medium consumer             Tenants significantly
                                                                               / value and specialty    offering combined with      impacted by pandemic and
                                                                               retail tenants with      good or strong rent         uses or tenants that were of
1.   As of October 28, 2020
                                                                               strong rent paying       paying ability              concern prior to pandemic
2.   Based on occupied net leasable area
                                                                               ability
                                                                                                                       Investor Presentation Q3 2020 | RioCan | 6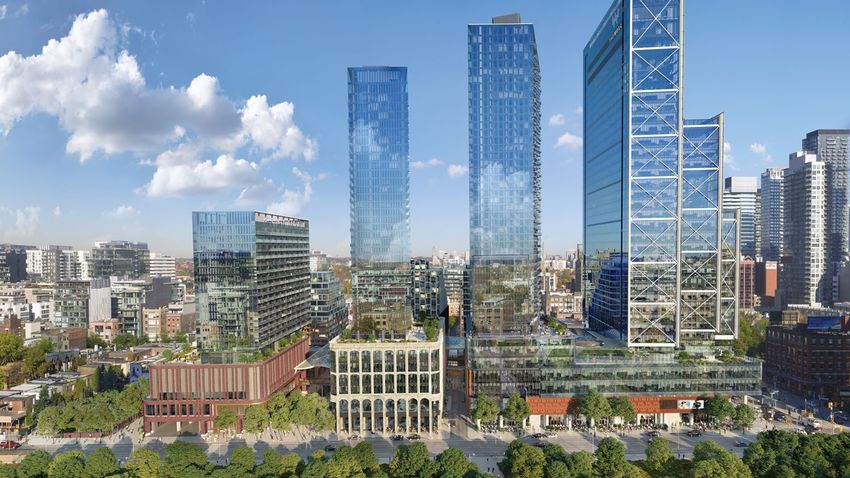
High Quality,
                                                                                                                           Sustainable Income

Strategic leasing that provides necessities for communities
Complementary necessity-based and value-oriented tenancies mitigate risks

                                                          Low Exposure to
         Increasing Exposure                          Declining Retail Concepts
                                                                                   % of Annualized      Confirmed closures
                                                       Retailers restructuring
                                                                                     total rental       as % of annualized
                                                        since March 31, 2020
                                                                                       revenue          total rental revenue
                                                                        1
                                                     Globo Shoes                         0.2%                    -%
                                                     L'Aubainerie                        0.1%                  0.1%
                                                                    2
                                                     Reitmans                            0.9%                  0.3%
                                                                        3
                                                     Stern Group                         0.2%                  0.1%
                                                     GNC                                 0.1%                  0.1%
                                                            4
                                                     Laura                               0.4%                    -%
                                                     Moores                              0.3%                  0.1%

         Reducing Exposure                           Le Chateau
                                                                5
                                                                                         0.1%
                                                                                         0.5%
                                                                                                               0.1%
                                                                                                               0.1%
                                                     Others
                                                     Total RioCan Exposure               2.8%                  0.9%
                                                     ( as of Oct 28, 2020)

                                                1)      Globo Shoes includes Aldo, Call it Spring and Globo
                                                2)      Reitmans includes Penningtons, RW&CO., Addition Elle and Thyme Maternity
                                                3)      Stern Group includes Ricki’s, Cleo and Bootlegger
                                                4)      Laura includes Laura and Melanie Lyne
                                                5)      Others include Anna Bella, Ascena Group Inc., Brooks Brothers, Chuck E. Cheese,
                                                        Coats Co., Davids Tea, Dr. Bernstein Health and Diet Clinic, Garage, Henry’s, Infinity
                                                        Dental, Jack & Jones, J. Crew, Lucky Brand, Mendocino, Mountain Equipment Co-
                                                        Operative, Solutions and Swimco.

                                                                                                Investor Presentation Q3 2020 | RioCan | 7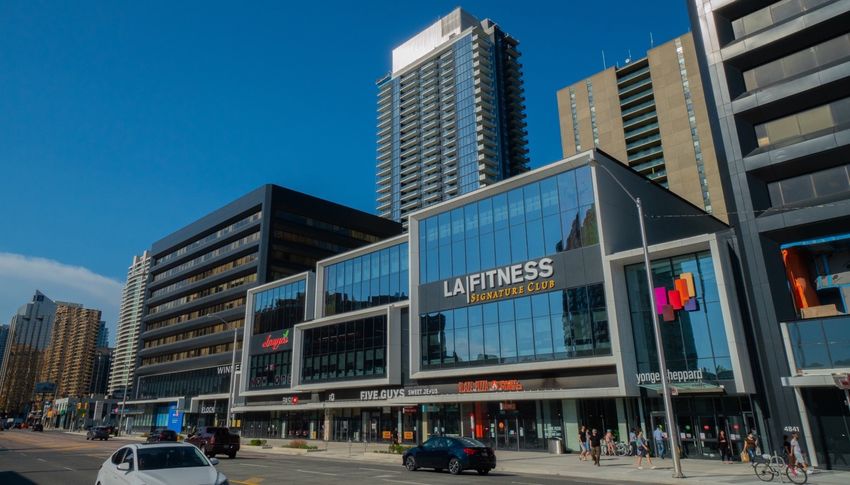
High Quality,
                                                                                                                                                                        Sustainable Income

Well-positioned portfolio retains and attracts tenants
Strong leasing activity despite pandemic

                                                                                                                                              19.8%
                                                      89.4%            88.4%
                                     83.1%
                                                                                                        New
     Retention                                                                                         Leasing                                                9.2%
       Ratio                                                                                           Spread                         6.7%
            (%)                                                                                              (%)

                                   Q1 2020          Q2 2020           Q3 2020                                                                          1
                                                                                                                                    Q1 2020   Q2 2020        Q3 2020

       Renewal                                                                                          Blended
       Leasing                        5.3%             4.6%              4.6%                           Leasing                       5.6%     5.8%           5.5%
        Spread                                                                                          Spread
              (%)                                                                                             (%)

                                    Q1 2020          Q2 2020           Q3 2020                                                      Q1 2020   Q2 2020        Q3 2020

1.   Q2 2020 New leasing spread primarily driven by higher concentration of smaller, specialty tenants executing new leases and a pet store
     releasing space formerly occupied by a value retailer
                                                                                                                                               Investor Presentation Q3 2020 | RioCan | 8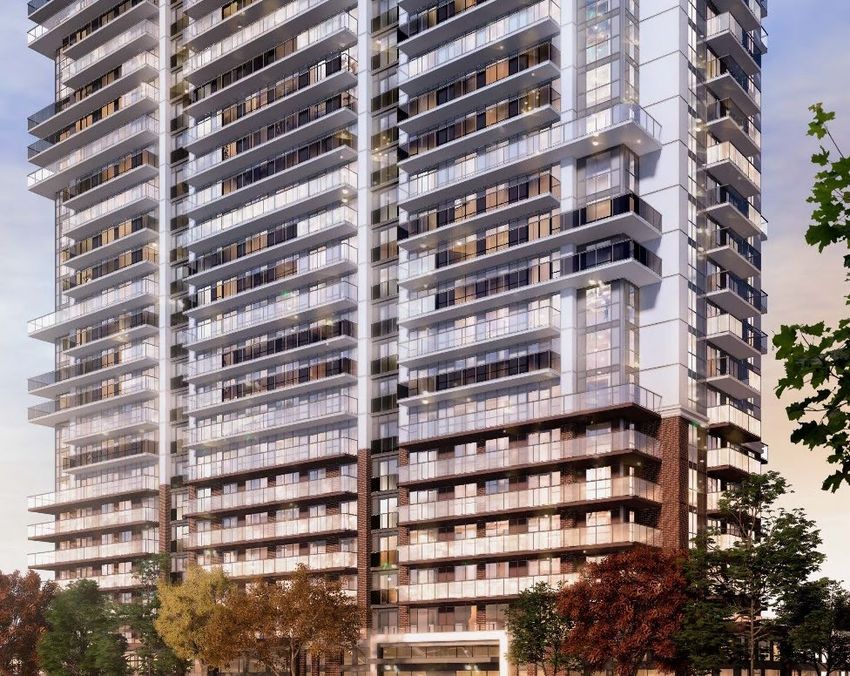
High Quality,
                                                                                             Sustainable Income

Additional sources bolster traditional income stream
RioCan has access to various avenues to generate income and cash flow

                                              Diversity of asset types:
                                              • Mixed-use developments increasingly
                                                 expanding our exposure to office and
                                                 residential NOI

                                              Inherent value in portfolio
                                              provides:
                                              • Inventory gains through condo /
                                                 townhouse developments or through
                                                 sale of certain development land
                                              •   Third-party fees for RioCan expertise

                                                                    Investor Presentation Q3 2020 | RioCan | 9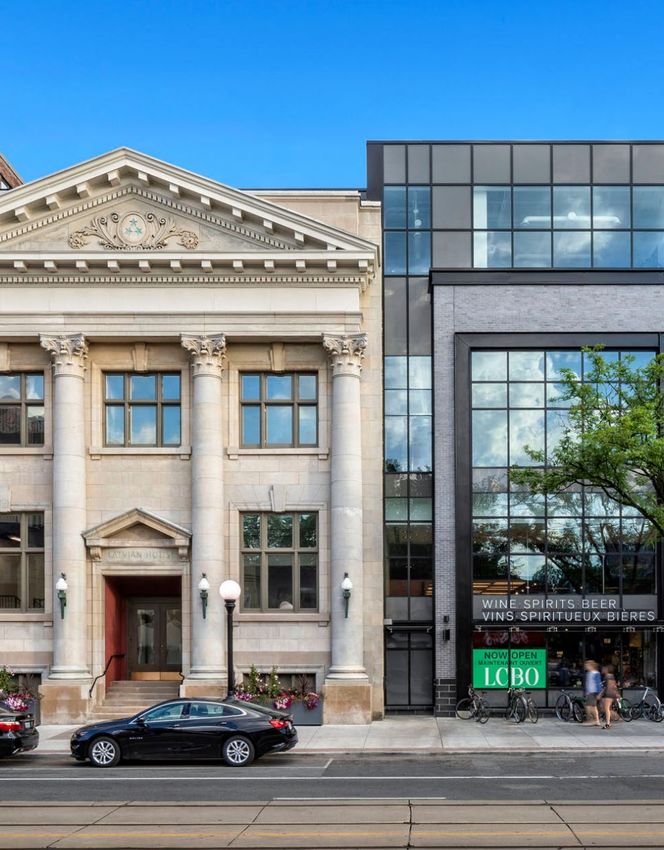
NAV
Creation
Value creation through mixed-use development
With highest zoning entitlements among peers
Total Pipeline by Zoning Status • ~100% located in Canada’s six major
markets
7.3M
SF, 17% Zoning • ~73% located in the GTA
Approved
• ~99% of projects are mixed-use
Zoning residential projects
42M 14.3M
Applications
SF, 34% • ~60% located on transit
SF Submitted
Future • Completed / In development1
Estimated
20.5M SF, Density ~5,400 residential rental units
49%
~2,900 condo/townhouse units
1. In development includes projects in various stages of development
with construction currently underway or starting by 2022
Investor Presentation Q3 2020 | RioCan | 10NAV
Creation
Enhancing quality and security
of income with diversification into
RioCan’s residential rental
Asset
development Diversification
program offers Yield Enhancement - example
multiple Development
Yield based
Corp CHMC
Levered
Development
Leverage financing
benefits on IFRS Cost
5.5%
42% 1.7%
Yield
8.3%
Development is a key NOI Creation
driver of future growth Residential vs Commercial - example
and NAV expansion
Residential Development Commercial Development
Development Yield: 5.5% Development Yield: 5.5%
Cap rate: 3.5% Cap rate: 5.0%
NAV Growth over Cost NAV Growth over Cost
NAV Creation 57% 10%
Investor Presentation Q3 2020 | RioCan | 11NAV
Proven mixed-use experience and value creation
Creation
Total estimates as of Q3 2020 for five recently completed development projects
$574.9M $32.1M 5.6% $752.3M $203.6M
Total Estimated Estimated Yield on Estimated Total Estimated
Estimated Net Stabilized Total Costs Future Stabilized Incremental
Project Costs NOI Value 1 Value Creation2
1. Excludes condo gains; 2.Includes $26.2M of condo gains.
Bathurst College Centre, Toronto
ePlace, Toronto King and Portland Centre, Toronto
Frontier, Ottawa
With direct links to two subway lines Top 10 most Influential Buildings
of the 2010s (Urban Toronto) Sage Hills, Calgary 12NAV
Creation
Unlocking the full potential of transit-oriented locations
RioCan’s selected developments mapped to Toronto transit system
Demographics, 5km radius
Toronto Pearson Average population1: ~320K
International Airport
Average household income1: ~$132K
Post-secondary education: ~62%
Legend1
Under Construction: 2.3M sf
Completed Development: 0.8M sf
Future Development: 28.5M sf
Total (at RioCan’s Interest): 31.6M sf
Union
Station TTC – Existing
TTC – Under Development
CN Tower
Billy Bishop TTC – Station
Toronto City Airport
Planned Rapid Transit Line
1. Square footage accounts for mixed-used residential development projects throughout the Greater Toronto Area at RioCan’s interest
Investor Presentation Q3 2020 | RioCan | 13NAV
RioCan Living – High Quality Rental Residences
Creation
Strong leasing velocity amidst the pandemic
eCentral, Toronto, ON Frontier, Ottawa, ON Brio, Calgary, AB
• 466 units, 36-storey building • 228 unit, 23-storey building • 163 unit, 12-storey building
• ~92% leased as of Oct. 28, • 100% of Phase One, Frontier, is • Despite lease-up
2020 leased as of Oct. 28, 2020 commencing in midst of
COVID-19 and in Calgary,
• Rents averaging $3.90 per sf • Rents averaging $2.50 per sf which has also been impacted
(for market rental units) by the prolonged oil crisis,
• Phase Two Latitude is under ~53% leased as of Oct. 28,
• Stabilization expected in construction with expected 2020
Q4 2020 completion date in 2021
• Rents averaging $2.53 per sf
Investor Presentation Q3 2020 | RioCan | 14NAV
Condo / Townhouse development and value creation
Creation
Strong pre-sales for condos and townhomes despite the pandemic
Yorkville Condos Windfield Condos Windfield Townhomes
(11YV) (U.C. Tower) (U.C. Uptowns)
~99% of the 586 units pre-sold as of ~95% of the 503 units pre-sold as of Effectively all 153 units pre-sold as of
Oct. 28, 2020 with first possession Oct. 28, 2020 with first possession Oct. 28, 2020 with first possession
anticipated in 2024. Estimated anticipated in 2023. Estimated anticipated in 2022. Estimated
inventory gains1 of $65.0M-$71.0M inventory gains1 of $14.0M-$16.0M inventory gains1 of $5.0M-$5.5M
1. Estimated inventory gains are at RioCan’s interest Investor Presentation Q3 2020 | RioCan | 15Balance Sheet
Strength
Capital Structure Metrics
Target Q3 20201
Disciplined
Liquidity n/a $803M
and prudent Debt to Adjusted EBITDA 3.0x 3.22x
Debt Service Coverage >2.25x 2.71x
Ample liquidity Fixed Charge Coverage >1.10x 1.06x
bolstered by large pool
of unencumbered Unencumbered Assets N/A $8.7B
assets Unencumbered Assets to Unsecured Debt >2.0x 2.21x
NOI % from Unencumbered Assets >50% 57.1%
Unsecured vs. Secured Debt 60% / 40% 57% / 43%
Ratio of Floating Rate Debt to Total Debt2323
Yonge St.
2345
Yonge St.
APPENDIX AND FEATURE PROJECTS
Investor Presentation Q3 2020 | RioCan | 17Value creation underway
Development pipeline: 59 projects delivering 42M square feet of NLA
• 21 projects already under
Estimated Density (NLA) at RioCan's Interest
# of projects Commercial
Residential
Air Rights Sale
Residential
Total
construction and on track for
Rental Inventory
completion in the near to
(thousands of sq. ft.)
Under construction
Mixed-use residential 10 1,012 862 1,030 211 3,115
Greenfield Development 2 432 - - - 432 mid-term
Expansion & Redevelopment 9 114 - - - 114
Subtotal under construction 21 1,558 862 1,030 211 3,661
Approved Zoning
• $1.2B invested to-date to
Mixed-use residential 15 2,612 7,059 - 961 10,632 drive further income
Zoning applications submitted
Mixed-use residential 7 667 6,161 - 446 7,274
diversification and creating
Total Active Projects 43 4,837 14,082 1,030 1,618 21,567
net asset value for the long
Future estimated density term
Mixed-use residential 16 2,092 18,179 0 180 20,451
Total development pipeline 59 6,929 32,261 1,030 1,798 42,018
• Only $81.3M of cumulative
fair value recognized as of
Sept 30, 2020
Investor Presentation Q3 2020 | RioCan | 18Mixed-used Residential Projects Currently Under Construction
Projects # of Cost to Total Est.
Value ($ in millions and thousands of sq. ft.) Location
RioCan Ownership
% (Partner) ft)
Total NLA residential
('000s sq. at Riocan
Interest
units at
100%
date at
RioCan
Interest
Cost at
RioCan
Interest
Inventory gain
($M)
Anticipated
date of
Completion
creation Yonge Sheppard Centre Residential (Pivot)
Windfield Farm U.C. Towns
Toronto, ON
Oshawa, ON
100%
50% (Tribute)
258 258 361
166
$218.3
34.0
$237.8
35.1 $12.9
2020
2020
underway Dupont Street (Litho)
Fifth and Third East Village (5th & THIRD)
College & Manning (Strada)
Toronto, ON
Calgary, AB
Toronto, ON
50% (Woodbourne)
100%
50% (Allied)
177
754
108
89
754
54
210
-
61
48.5
114.0
30.1
77.6
118.2
42.2
2021
2021
2021
Gloucester - Phase Two (Latitude) Gloucester, ON 50% (Killam) 160 80 209 23.7 45.6 2021
Projects under
50% commercial (Allied);
The Well Toronto, ON 40% residential 2,615 1,200 na 517.0 888.4 2021 - 2023
(Allied/Diamond)
construction on Elmvale Acres - Phase One (Luma) Ottawa, ON 50% (Killam) 135 68 168 18.0 45.3 2022
track to deliver Windfield Farm U.C. Uptowns Oshawa, ON 50% (Tribute) 153 2.8 30.2 $5.0 - $5.5 2022
value creation
Westgate - Phase One (Rhythm) Ottawa, ON 100% 165 165 213 23.0 98.5 2022 - 2023
The Well - (FourFifty The Well) Toronto, ON 50% (Woodbourne) 393 196 592 10.1 143.6 2023
Windfield Farm U.C. Tower Oshawa, ON 50% (Tribute) 503 13.3 72.6 $14.0 - $16.0 2023
over the next Yorkville
Rental units and retail
Condominium (11YV)
Toronto, ON
50% (CD
Capital/Metropia)
80
422
40
211
81
586
15.0
85.2
48.4
258.4 $65.0 - $71.0
2024
2024
four years Total Under Construction 5,267 3,115 3,303 $1,152.9 $2,142.0 $96.9 - $105.4
Completed Projects
50% condo
Yonge Eglinton N/E (eCentral & eCondos) Toronto, ON (Metropia/Bazis) 712 356 1,089 na na $14.5 2019
Gloucester Phase One (Frontier) Gloucester, ON 50% (Killam) 185 93 228 na na na 2019
King and Portland Center Office and retail Toronto, ON 50% (Allied) na na na na na na
Condominium (Kingly) 421 210 132 na na $11.70 2019
Brentwood Village (Brio) Calgary, AB 50% (Boardwalk) 144 72 163 na na na 2020
Total Completed 1,462 731 1,612 na na $26.2
Total Completed and Under Construction 6,729 3,846 4,915 na na $123.1 - $131.6
Investor Presentation Q3 2020 | RioCan | 19HWY 400
HWY 407
HWY 7
VAUGHAN, ON
RIOCAN COLOSSUS CENTRE
Investor Presentation Q3 2020 | RioCan | 20• >50 acre site currently
consisting of 571k sq. ft of
income producing retail
• ~10M sq. ft. of mixed-use
density contemplated involving
VAUGHAN, ON multi-phase development
RIOCAN COLOSSUS CENTRE Investor Presentation Q3 2020 | RioCan | 21• 36-storey, 1.1 million square
feet1 of office – 84% pre-leased
• ~420k square feet
of retail
• 592-unit residential rental
under construction
TORONTO
THE WELL
Investor Presentation Q3 2020 | RioCan | 22TORONTO
THE WELL
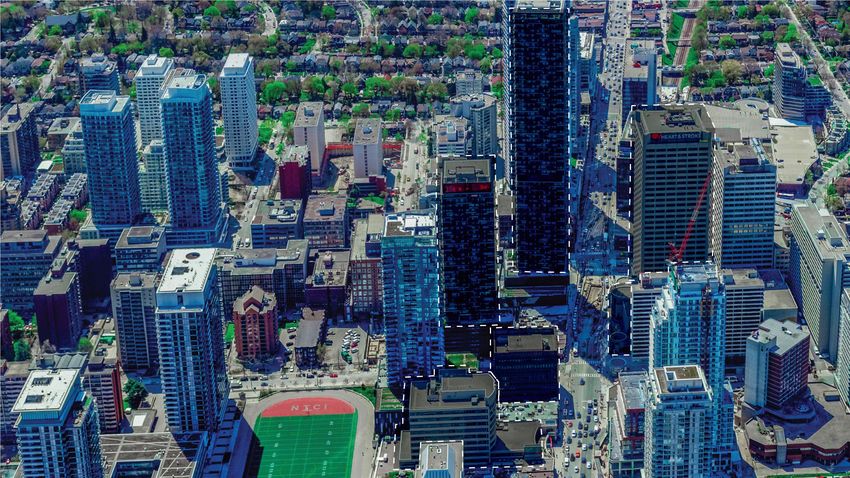
Investor Presentation Q3 2020 | RioCan | 23• ~315k sq. ft. of office
• ~305k sq. ft. of retail
• 36-storey, 361 unit residential
rental - completed
TORONTO
YONGE SHEPPARD CENTRE & PIVOT Investor Presentation Q3 2020 | RioCan | 24Frontier, Phase 1 – 100% leased
• 33-storey, 228 unit residential rental
Latitude, Phase 2 – under construction
based on success of Phase 1
Gloucester • 20-storey, 209 unit residential rental
Frontier & Latitude Investor Presentation Q3 2020 | RioCan | 25• 8-storey, 210 unit residential rental
• ~30.5k sq. ft. of retail
• Under construction for
completion Summer 2021
Toronto
Litho Investor Presentation Q3 2020 | RioCan | 26• 7-storey, 61 unit residential rental
• ~5.6k sq. ft. of retail
• Under construction for
completion Spring 2021
Toronto
Strada Investor Presentation Q3 2020 | RioCan | 27NON-GAAP FORWARD LOOKING
MEASURES INFORMATION
RioCan’s consolidated financial Certain information included in this presentation contains forward-looking statements within the meaning of applicable
statements are prepared in accordance securities laws including, among others, statements concerning our objectives, our strategies to achieve those objectives, as
with IFRS. Consistent with RioCan’s well as statements with respect to management's beliefs, plans, estimates, and intentions, and similar statements
management framework, management concerning anticipated future events, results, circumstances, performance or expectations that are not historical facts.
uses certain financial measures to Certain material factors, estimates or assumptions were applied in drawing a conclusion or making a forecast or projection
assess RioCan’s financial performance, as reflected in these statements and actual results could differ materially from such conclusions, forecasts or projections.
which are not generally accepted
accounting principles (GAAP) under Forward-looking information is not a guarantee of future events or performance and, by its nature, is based on RioCan’s
IFRS. current estimates and assumptions, which are subject to numerous risks and uncertainties. Such risks and uncertainties
include, but are not limited to, the effects of COVID-19 on the businesses, operations and financial positions of RioCan and
The following measures, Funds From its tenants, as well as on consumer behaviors and the economy in general, including the length, spread and severity of the
Operations (“FFO”), Net Operating pandemic; the nature and length of the restrictive measures implemented or to be implemented by various levels of
Income (“NOI”), Adjusted Earnings governments in Canada; RioCan’s tenants' ability to pay rents as required under their leases; the availability of various
before interest, taxes, depreciation support programs that are or may be offered by the various levels of government in Canada and worldwide; domestic and
and amortization (“Adjusted global supply chains; timelines and costs related to the Trust’s development projects; the pace of property lease up and
EBITDA”), Debt to Adjusted EBITDA, rents and yields achieved upon development completion; potential changes in leasing activities, market rents and property
Same Property NOI, Interest valuations; the availability and extent of rent deferrals offered or to be offered by the Trust; domestic and global credit and
Coverage, Debt Service Coverage, capital markets, and the Trust’s ability to access capital on favourable terms or at all, and its ability to maintain its current
Fixed Charge Coverage, and Total credit ratings; total market return and the dividend yield of the Trust’s Units; and the health and safety of our employees,
Enterprise Value as well as other tenants and people in the communities that our properties serve. For more information on other risks, uncertainties and
measures discussed in this presentation, assumptions that could cause the Trust's actual results to differ from current expectations, refer to the “Risks and
do not have a standardized definition Uncertainties” section in RioCan’s Third Quarter 2020 MD&A for the period ended September 30, 2020 and in its most
prescribed by IFRS and are, therefore, recent Annual Information Form, available at www.sedar.com and at www.riocan.com.
unlikely to be comparable to similar
measures presented by other reporting The forward looking information contained in this presentation is made as of the date hereof. Except as required by
issuers. applicable law, RioCan undertakes no obligation to publicly update or revise any forward-looking statement, whether
as a result of new information, future events or otherwise.
Investor Presentation Q3 2020 | RioCan | 28You can also read


