Corporate investor presentation - February 2021 - Mondi Group
←
→
Page content transcription
If your browser does not render page correctly, please read the page content below

Corporate investor
presentation

February 2021
Mondi: Forward-looking statements disclaimer

This document includes forward-looking statements. All statements other than statements of historical facts included herein, including, without limitation, those regarding Mondi’s financial position,
business strategy, market growth and developments, expectations of growth and profitability and plans and objectives of management for future operations, are forward-looking statements. Forward-
looking statements are sometimes identified by the use of forward-looking terminology such as “believe”, “expects”, “may”, “will”, “could”, “should”, “shall”, “risk”, “intends”, “estimates”, “aims”, “plans”,
“predicts”, “continues”, “assumes”, “positioned” or “anticipates” or the negative thereof, other variations thereon or comparable terminology. Such forward-looking statements involve known and unknown
risks, uncertainties and other factors which may cause the actual results, performance or achievements of Mondi, or industry results, to be materially different from any future results, performance or
achievements expressed or implied by such forward-looking statements. Such forward-looking statements and other statements contained in this document regarding matters that are not historical facts
involve predictions and are based on numerous assumptions regarding Mondi’s present and future business strategies and the environment in which Mondi will operate in the future. These forward-
looking statements speak only as of the date on which they are made.

No assurance can be given that such future results will be achieved; various factors could cause actual future results, performance or events to differ materially from those described in these
statements. Such factors include in particular but without any limitation: (1) operating factors, such as continued success of manufacturing activities and the achievement of efficiencies therein,
continued success of product development plans and targets, changes in the degree of protection created by Mondi’s patents and other intellectual property rights and the availability of capital on
acceptable terms; (2) industry conditions, such as strength of product demand, intensity of competition, prevailing and future global market prices for Mondi’s products and raw materials and the pricing
pressures thereto, financial condition of the customers, suppliers and the competitors of Mondi and potential introduction of competing products and technologies by competitors; and (3) general
economic conditions, such as rates of economic growth in Mondi’s principal geographical markets or fluctuations of exchange rates and interest rates.

Mondi expressly disclaims

a) any warranty or liability as to accuracy or completeness of the information provided herein; and

b) any obligation or undertaking to review or confirm analysts’ expectations or estimates or to update any forward-looking statements to reflect any change in Mondi’s expectations or any events that
occur or circumstances that arise after the date of making any forward-looking statements,

unless required to do so by applicable law or any regulatory body applicable to Mondi, including the JSE Limited and the LSE.

2
Strong delivery, sustainable growth

    • Enabling delivery of essentials   • Leveraging key long-term      • Leader in sustainability –
    • Excellent cash generation           trends – leading innovation     purpose, strategy, culture
    • Strong operational                • Investing through-the-cycle   • Prioritising safety and health
      performance                       • Unique portfolio

3
Mondi at a glance (2020)

                      Corrugated Packaging                                        Flexible Packaging                         Engineered Materials                      Uncoated Fine Paper

Segment                              €1,879m                                                  €2,667m                                     €801m                                 €1,485m
revenue1                                (27%)                                                   (39%)                                     (12%)                                   (22%)

Underlying
                                  €518 million                                               €519 million                             €80 million                              €266 million
EBITDA

ROCE                                   22.5%                                                    14.5%                                     7.5%                                    11.3%

Products

End uses                                                 Consumer                                           Consumer                                 Consumer
                                                         and retail2                                        and retail2                              and retail2

                                                                                                                 Building and construction        Paper for home, office and
  1. Segment revenues and related percentages before elimination of inter-segment revenues                                                        professional printing
  2. Includes consumer non-durables, e-commerce and other retail applications                                    Chemicals, industrial,
  4                                                                                                              agriculture and other            Market pulp and other
Leading market positions

        virgin containerboard                                             kraft paper producer          commercial release liner   uncoated fine paper supplier
        producer in Europe                                                globally                      producer in Europe         in Europe (including Russia)

        containerboard producer                                           paper bag producer in         extrusion coatings         uncoated fine paper
        in emerging Europe                                                Europe and a global leader    producer in Europe         producer in South Africa

        corrugated solutions producer                                     consumer flexible packaging
        in emerging Europe                                                producer in Europe

Refer to the end of this document for market position sources and definitions

5
Our growth focus – packaging

6
Strong global presence

Revenue by location
2020 (%)

Revenue from customers in South America
represented 2% in 2020

7
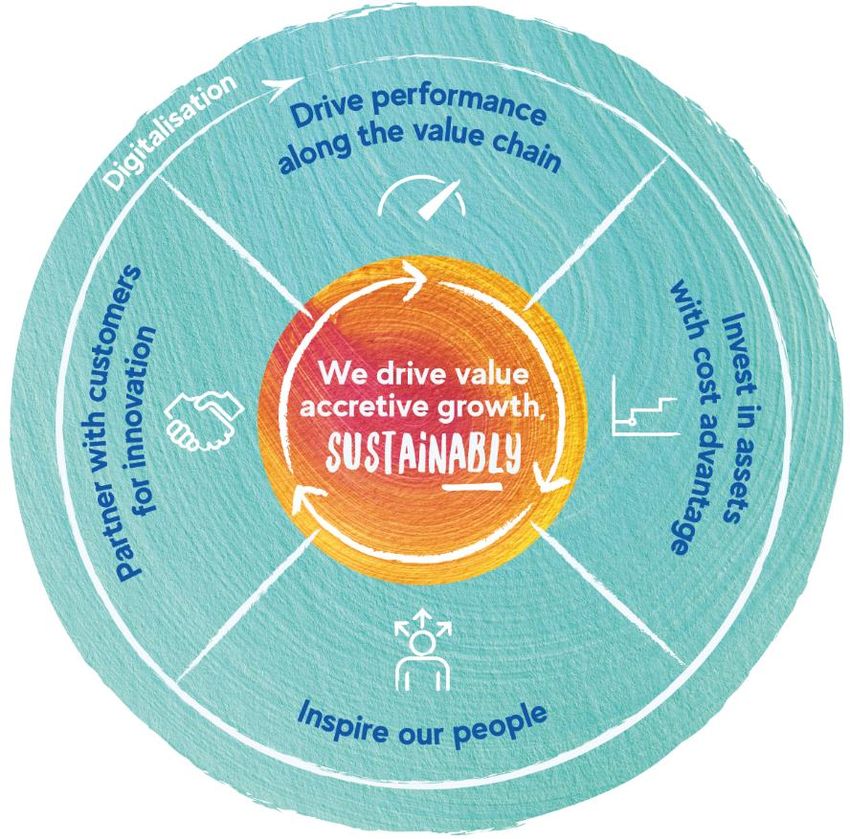
Strategic framework

                  continues to be at the centre of our strategy
8
Consistent strategy driving strong performance

Underlying EBITDA and margin                                              Cash generated from operations
€ million and %                                                           € million

                                      23.6%          22.8%
       20.5%             20.9%
                                                                  20.3%

        1,366           1,482         1,764          1,658        1,353           1,401   1,363   1,654    1,635   1,485
        2016             2017          2018           2019         2020           2016    2017    2018     2019    2020

                  Underlying EBITDA           Underlying EBITDA margin

 9
Delivering on our strategy

Driving value
accretive growth    ● Delivering on our 2020 sustainability targets
                    ● Setting our commitments to 2030

                         Sustainability
Leveraging key
                         E-commerce
long-term trends
                         Enhancing customer brand value

Investing
through-the-cycle    organic                 cost           environmental
                     growth               advantages          footprint

Strategic           ● Strong cash generation
flexibility         ● Unique platform with options for growth

10
Delivering on our 2020 sustainability commitments
Some key examples:
TRCR (per 200,000 hours worked) tonne per tonne of saleable production kg per tonne of saleable production
reduction vs 2015 reduction vs 2014 reduction vs 2015
reduction vs 2005 reduction vs 2004 reduction vs 2005
2004/2005 were the baseline years of Mondi’s 1st set of sustainability commitments while 2014/2015 are the baseline years for the Group’s 2020 commitments
11Mondi recognised as a leader in sustainability
A few external benchmark examples:
One of only 10 Top quartile Top 1%
companies globally with a in the Paper & Forest in our sector for 5
CDP Triple A rating Products industry consecutive years
Making a real contribution to the UN SDGs
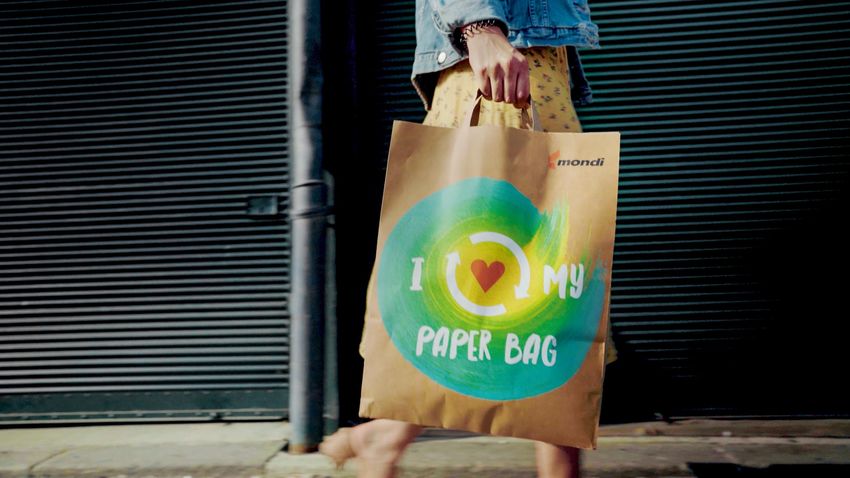
12Sustainability targets to 2030 13 For more details please visit: www.mondigroup.com/MAP2030
Sustainable packaging solutions

             Mondi’s customer-centric approach to sustainable packaging

14
A unique platform to deliver
High Renewable Low
High Recyclable Low
Low Barrier functionality High
Moisture Grease Mineral Oil Gas
Added Barrier Aluminium
Paper
barriers Material films foil
15– a few examples:
A fully corrugated alternative to plastic fruit A 100% renewable, recyclable and highly
punnets and plastic foil wrapping protective alternative to plastic mailers that use
bubble foil protective padding
A 100% recyclable paper rice bag that replaces A fully recyclable, mono-material
plastic while continuing to meet food shelf life alternative – maintaining vital barrier
preservation and industry regulations properties and aesthetics
16Replacing plastic with paper e-commerce and shopping bags
Machine conversion at Štětí
● Strong customer demand for paper-based
solutions supported by legislation to eliminate
plastic waste
● Sole European supplier offering full portfolio of
paper for shopping bags
● Up to 130ktpa1 integrated capacity at flagship
mill – potential to replace up to 2 billion plastic
bags per annum
Closing the loop with Tesco Supporting fashion retailer
in central Europe with our with a paper-based
recycled paper-based e-commerce bag solution
shopping bag offering
1. Net capacity increase of 45ktpa for the Group (+75ktpa of speciality kraft paper and -30ktpa of containerboard)
17Unique offering unlocking opportunities
Recyclable functional barrier paper solutions
Barrier
coating
Paper
Base papers Barrier coatings Printing and converting
(speciality kraft paper) (functional paper and films1) (paper bags and
consumer flexibles)
Leveraging paper, coating and converting know-how
combined with blue chip customer relationships
1. Functional paper and films comprises release liner and extrusion solutions coating technology
18Innovation supporting customers’ sustainability goals
PerFORMing – alternative to plastic trays
Growing our customer reach
14 customers at start of 2021 with an
additional 18 trials ongoing
Launched removable film
solution and extended offering
to cold meats - 12 customers
1st customer supplied for
cheese packaging
Development of
formable paper-based
food tray
+250%
vs 2020
+130%
vs 2019
< 2019 2019 2020 2021
19Offering full range of sustainable e-commerce solutions
European market e-commerce packaging growth
€ billion
Corrugated and flexible paper-based solutions
+8%
CAGR
10 +20%
9
in 2020
8
7
6
5
4
3
2
1
0
2019 2020 2023E
Source: Statista
20Enhancing customer brand value and shelf-appeal
Ružomberok kraft top white machine
White virgin top layer
● Excellent printability
● Fantastic strength
Brown recycled layer
● Cost advantages
Project details
Excellent for shelf-ready packaging,
● 300,000 tonne integrated kraft top white machine POS displays, e-commerce, trays
● Started up end of January 2021 and other applications
21Cost advantaged operations combined with our
relentless focus on driving performance
Cost advantaged asset base Focus on driving performance
Mondi capacity by quartile of relevant industry cost curve (%) Ongoing processes
● Core organisation competence
● Ongoing process to set profit improvement initiatives
in four key areas:
‒ Commercial
‒ Supply chain
‒ Procurement
‒ Operational
1st quartile o Accelerated via digital tools
o Clear commitment and ownership, ongoing tracking
2nd quartile
● Benchmarking performance internally and externally
● Collaboration and knowledge sharing network
in the 1st or 2nd cost quartile ● Culture of continuous improvement
Refer to the end of this document for relevant industry cost curve sources and definitions
22Integrated value chain (2020)
Pulp3
0.5 mt
Mondi managed forests Internally procured wood1 Pulp
Annual allowable cut 4 million m3 4.5 mt
Externally procured wood Containerboard3
9 million m3
14 million m3 1.6 mt
Corrugated solutions
1.8 bn m2
Paper for Containerboard
2.5 mt Box plants
recycling
1.3 mt Kraft paper3
0.3 mt
Kraft paper Paper bags
1.1 mt 5.4 bn bags
Consumer flexibles
2.5 bn m2
Resin, films and Converting plants Engineered materials
other raw materials 5.1 bn m2
Uncoated fine paper
1. Due to commercial, logistic and sustainability considerations, the actual wood procured from our
managed forests was lower than the annual allowable cut 1.4 mt
2. In addition to the 1.4 mt of uncoated fine paper, the Group also produced 0.2 mt of newsprint
3. Pulp and packaging paper net exposure Uncoated fine paper2
1.4 mt
23Investing for growth through-the-cycle
● €1.4 billion spent on commissioned major projects since 2014
o >20% average return1
Strong o >600ktpa of cost-advantaged capacity added
track ● Key benefits:
record o Enhanced customer offering
o Better cost / operational efficiency
o Improved environmental footprint
● Current projects increasing pulp and paper production by around 7%
● Expanding and upgrading converting business footprint:
Focused o E-commerce offering
project o Sustainable products
pipeline o Better geographic footprint to serve customers
● Evaluating further projects leveraging strong asset base
1. Average return defined as underlying operating profit contribution once the project is fully ramped up divided by capital expenditure approval amount (considered
24 projects commissioned between 2014 and 2020)Our cash flow priorities remain unchanged
Maintain our strong and stable financial position
and investment grade credit metrics
Grow through selective capital investment opportunities
Free cash flow
priorities
Support payment of dividends to our shareholders
Evaluate growth opportunities through M&A
and/or increased shareholder distributions
25Strong cash generation through the cycle
Cash flow generation
€ million
648 538 705 516 648 549 715 796 1,039 1,061 972 1,226 1,215 1,244
2007 2008 2009 2010 2011 2012 2013 2014 2015 2016 2017 2018 2019 2020
More than €11 billion generated since listing
Cash flow generation based on net cash generated before capital expenditure, acquisitions and disposals
of businesses, investment in equity accounted investees and payment of dividends to shareholders
26Investing in our business and distributions to shareholders
Cash flow generation since listing
€ billion
Strong cash Investing in Taking Divesting Returning
generation our cost advantage of non-core and capital to our
through the advantaged opportunities underperforming shareholders
cycle asset base at the right operations in line with
(5% CAGR to 2020) value our cash flow
priorities
(7.3)
11.9
(2.5) 0.8
(3.1)
0.2
Cash flow Capital expenditure Acquisitions Disposals Payment of Increase in
generation dividends to net debt
shareholders
Cash flow generation based on net cash generated before capital expenditure, acquisitions and disposals
of businesses, investment in equity accounted investees and payment of dividends to shareholders
27Strong financial position providing strategic flexibility
Net debt
€ million (net debt) and ratio (net debt to underlying EBITDA)
● 1.3x net debt to underlying EBITDA
1.3x 1.3x 1.3x
● Investment grade credit ratings reconfirmed
(BBB+ / Baa1)
1.0x 1.0x
● Group’s maturity profile extended
● Strong liquidity of around €1.2 billion
1,383 1,532 2,220 2,207 1,791
2016 2017 2018 2019 2020
Net debt to underlying EBITDA
28Dividends in line with our policy
Dividends declared and recommended
euro cents per share
76
62
60
57 57 ● Given strong financial position and confidence in the
future of the business:
3.0
o Recommended final dividend of 41.00 euro cents
per share
2.4 2.4
2.5
● Dividend policy unchanged:
2.2
o Targeted cover range of 2-3x on average over the
cycle
2016 2017¹ 2018 2019 2020
Dividend cover (times)
1. Excludes the 2017 special dividend of 100 euro cents per share
29Sources and definitions Mondi region definitions Europe – Europe including Russia and Turkey Emerging Europe – Albania, Armenia, Azerbaijan, Belarus, Bosnia and Herzegovina, Bulgaria, Croatia, Cyprus, Czech Republic, Estonia, Georgia, Hungary, Latvia, Lithuania, Macedonia, Malta, Moldova, Montenegro, Poland, Romania, Serbia, Slovakia, Slovenia, Turkey, Ukraine Sources for market position estimates Virgin containerboard (Europe) (including kraft top liner) based on capacity – Fastmarkets RISI and Mondi estimates Containerboard (emerging Europe) based on capacity – Fastmarkets RISI and Mondi estimates Kraft paper (Global) based on capacity – Fastmarkets RISI and Mondi estimates Corrugated solutions (emerging Europe) based on production – Henry Poole Consulting and Mondi estimates Paper bags (Global & Europe) based on sales volume – Eurosac, Freedonia and Mondi estimates Consumer flexible packaging (Europe) based on sales – PCI Wood Mackenzie Commercial release liner (Europe) based on sales volumes – Alexander Watson Associates and Mondi estimates Extrusion coatings (Europe) based on Mondi estimates Uncoated fine paper (Europe) based on sales volumes (Ilim JV considered separate from IP) – EURO-GRAPH, EMGE, Fastmarkets RISI, Pulp and Paper Products Council, Bumprom/SBO and Mondi estimates Uncoated fine paper (South Africa) based on Mondi estimates Sources for relevant industry cost curves Includes unbleached kraftliner, white top kraftliner, nordic and semi-chemical fluting, recycled containerboard, bleached & unbleached sack kraft paper, UFP (including value added grades) and BHKP Based on delivered cost to Frankfurt except BHKP (delivered to Rotterdam) and UFP – Merebank (delivered to South Africa) Global capacity for all grades except European capacity for unbleached kraftliner, recycled containerboard and UFP, and South African capacity for UFP – Merebank Source: Fastmarkets RISI and Mondi estimates, Q3 2020 30
You can also read