REC GROUP SOLAR MARKET INSIGHT - Q3 2017

Page created by Jay Klein
 
CONTINUE READING
REC GROUP SOLAR MARKET INSIGHT - Q3 2017
REC GROUP
SOLAR MARKET INSIGHT
Q3 2017

                       November 2017
REC GROUP SOLAR MARKET INSIGHT - Q3 2017
Major REC Q3 2017 Highlights

• REC achieved its best third quarter result ever in the
  EMEA thanks to a strong demand pull for high quality high
  efficiency panels
• REC was awarded the prestigious Solar + Power
  SILICON MODULE AWARD 2017 for its TwinPeak 2
  technology
   o This is one of the most prestigious awards in the solar
     industry
   o Recognition for “Pushing multicrystalline module
     performance to be competitive with
     monocrystalline and industrializing world-record
     power levels in the 60 and 72-cell module classes”
• REC expanded its successful channel program further
  into the APAC region
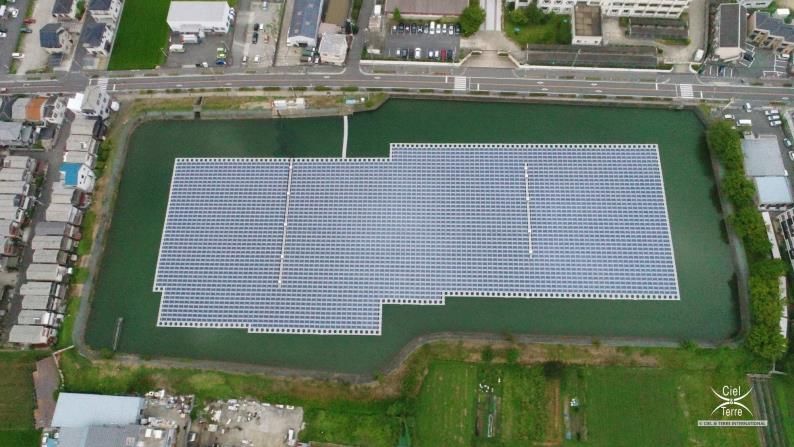
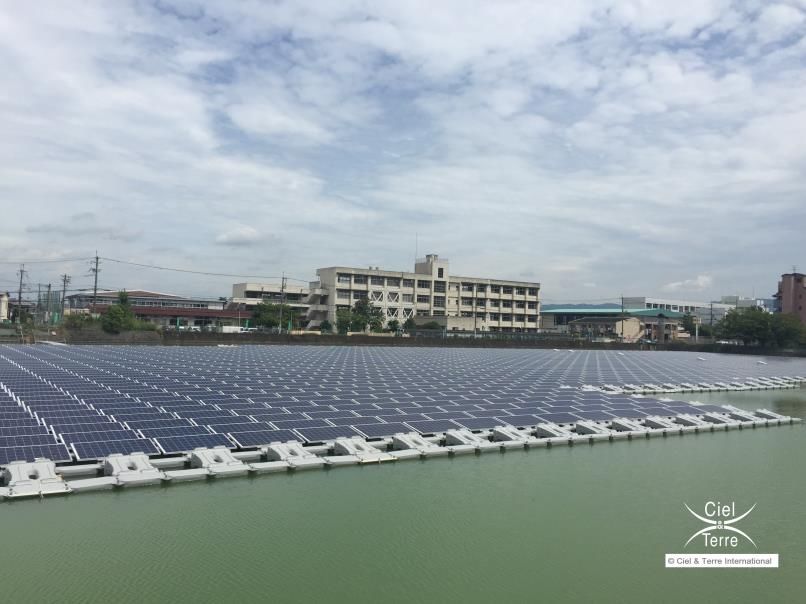
• REC and Ciel & Terre announced the grid connection of a
  973 kWp floating solar plant on an irrigation pond in
  Japan

                                                               2
REC GROUP SOLAR MARKET INSIGHT - Q3 2017
Table of contents

 1   REC Highlights Q3 2017

 2   Global Performance Q3 2017

 3   Regional Performance Q3 2017

 4   Market Snapshot – Europe

 5   REC Outlook

                                    3
REC GROUP SOLAR MARKET INSIGHT - Q3 2017
1   2   3   4   5

REC Highlights – Q3 2017
REC GROUP SOLAR MARKET INSIGHT - Q3 2017
REC receives prestigious Solar + Power SILICON
MODULE AWARD 2017

• REC Group received the prestigious
  Solar + Power Award 2017 in the
  category “Silicon Module Award” for
  its TwinPeak 2 solar panel
• The award marks the second time
  REC is recognized for its industry-
  leading TwinPeak technology as it was
  honored already in 2015 with the
  Intersolar Award for Photovoltaics
  panel shortly after its market launch
• Jury remarks: “REC’s TwinPeak 2
  exemplifies efforts to increase
  multicrystalline silicon efficiency to
  the point where it rivals that of
  monocrystalline PV products, all
  while reducing the number of modules
  needed to generate energy, or
  increase yields by utilizing a similar
  surface area.”

                                                 5
REC GROUP SOLAR MARKET INSIGHT - Q3 2017
REC expands its successful channel program into the
APAC region

• In India, REC is recognized as strong      As India’s first REC Platinum Partner,
  and trusted brand and has been able        Redington has been honored during the
  position itself as the #1 European brand   REI Expo trade show in October 2017
  of solar panels in the market thanks to
  more than 250 MW of REC panels
  shipped to India to date
• The channel programs includes the REC
  Partner Program for distributors and
  REC Solar Professional Program for
  solar installers and system integrators
• REC created those programs to
  promote and reward long-term
  alliances between REC and the different
  industry players along the downstream
                                             From left: Rohit Kumar, Head of Indian Subcontinent at REC Group,
  value chain                                Pradeep Srikanthan, Vice President Solar Equipment Group at
                                             Redington India Ltd, Kasturi Rangan, Whole Time Director at
• The channel programs prove successful      Redington India Ltd, Milan Koev, Vice President Sales & Marketing
                                             for Asia Pacific at REC Group, Somnath Yogi, Technical Manager for
  already in Europe, Japan, Australia, and   Asia Pacific at REC Group
  other APAC markets such as Sri Lanka

                                                                                                                  6
REC GROUP SOLAR MARKET INSIGHT - Q3 2017
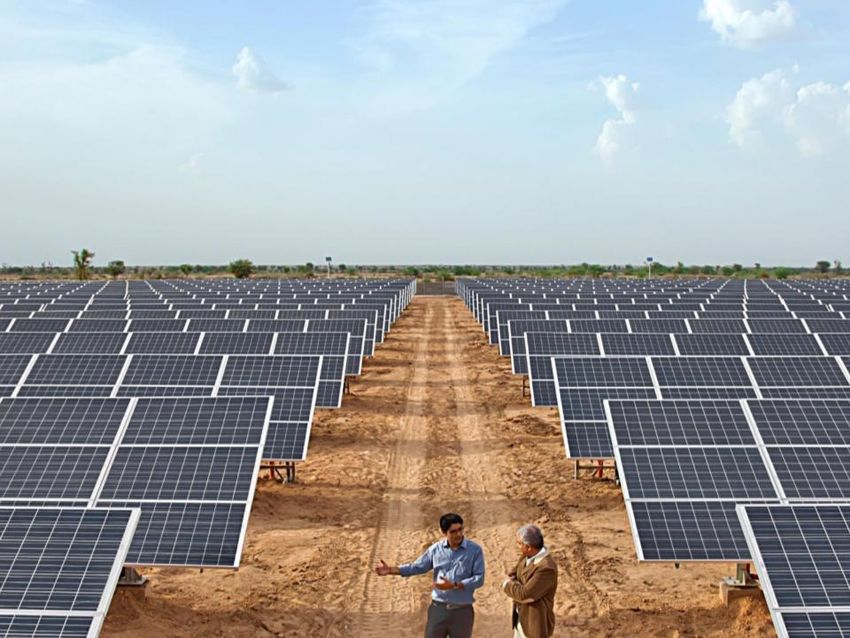
REC - Making Waves in Floating Solar, partnering with
Ciel & Terre

• As floating PV is spreading globally,
  REC and Ciel & Terre are pleased to
  announce the grid connection of a
  973 kWp floating solar plant on an
  irrigation pond in Nara prefecture,
  Japan
• Key benefits of floating PV:
  ecological, reliable and cost-
  effective way to generate clean,
  renewable energy while conserving
  land and water resources
• Based on IHS Markit1, there are over
  300 MW of floating projects already
  installed globally and a pipeline for
  completion amounting to approx. 2.3
  GW

1 IHS Markit “Solar Deal tracker”, November 2017)       7
REC GROUP SOLAR MARKET INSIGHT - Q3 2017
1   2   3   4   5

Global Performance – Q3 2017
REC GROUP SOLAR MARKET INSIGHT - Q3 2017
REC’s quarterly shipments grew by 19% year-over-year
and rose by 9% compared to the previous quarter

Module Shipments by Quarter
(in MW)                                     • Shipments in Q3 2017 totaled 329
                                              MW globally
                 +19%                          o Increase of 19% year-over-year
          349                                    and
                               329
                 300    301           +9%      o 9% growth compared to Q2
    276                                          2017
                                            • The company has enlarged its
                                              customer base by 66% from Q1-
                                              Q3 2017 compared to the same
                                              period in 2016
                                            • REC enjoys continuous strong
                                              demand for its high efficiency
                                              products across all market
                                              segments
    Q3     Q4     Q1     Q2     Q3          • The company is actively
   2016   2016   2017   2017   2017           diversifying its geographical reach
                                              (e.g. Turkey)

                                                                                9
REC GROUP SOLAR MARKET INSIGHT - Q3 2017
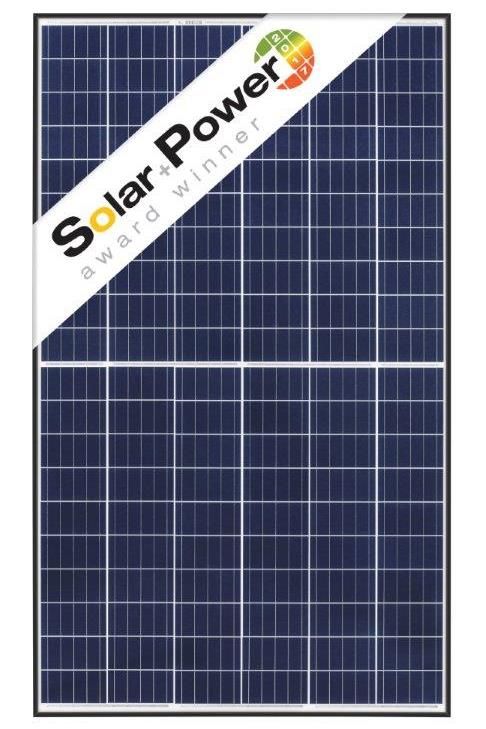
EMEA accounted for the largest share of Q3 2017
    shipments

     Module Shipments by Region                       APAC1
     (in MW)                                          EMEA    • The EMEA region accounted with
                                                      US        46% for the largest share of REC
                                                                shipments in Q3
                                349
                                                     329         o Best third quarter result ever
                                 71    300    301                o Strong performance with 23%
               276                                   63
                                                                   shipments growth quarter-
                47                             86                  over-quarter
                                       140
                                                              • Japan and APAC saw a solid quarter
                63              166                  151        performance with sales being driven
                                              123               by India and Australia
                                       97                     • Thanks to its growing and
               166                                              diversified customer base, the US
                                112                  115        enjoys rising shipments with a 25%
                                              92
                                       63
                                                                growth over Q2’17 following a
                                                                strong +46% growth already in Q2
               Q3               Q4      Q1     Q2     Q3
              2016             2016    2017   2017   2017
                                                                compared to Q1’17

1   Including Japan, Excluding China
                                                                                                    10
1   2   3   4   5

Regional Performance Q3 2017
Americas – REC performance and regional highlights

  Q3 2017 Module Shipments split by Segment1                                           REC Performance Highlights
  (in %)
                       Commerical / Utility                                             • REC ranks amongst the Top 5 most popular panel
                                        Residential / Distribution                        brand for residential installations in the entire U.S.
                                                                                          in the 1st half of 20172
                                                                                        • REC is placed amidst the top suppliers in each of
                                                                                          the largest 5 residential solar PV markets in the
                                                                                          US3

                                                                                       U.S. Market Development Highlights

                                                                                         • In residential PV the trend of switching away from
                                                                                           third-party ownership continues due to declining
                                                                                           cost of solar with large installers adjusting their
                                                                                           product offerings
                                                                                                   • Example California: Latest numbers from
                                                                                                     SEIA and GTM see only 33% of new installed
                                                   xxx                                               capacity being third-party owned in Q2 2017
                                                                                                     compared to 47% in Q2 2016
                        43%
                                              57%                                        • Growing interest in energy storage in the US market
                                                                xxx                        due to price declines and increasing the cost
             xxx                                                                           effectiveness of storage technology in both, utility-
                                                                                           and behind-the-meter applications

1 REC market segment module shipment volume splits are best estimates; 2 Based on 1H 2017 data by GTM, published September 2017; 3 Top 5 residential markets which are
tracked by GTM for supplier ranking
Source: REC; GTM Research US PV Leaderboard Q3 2017, GTM + SEIA US Solar Insight report Q3 2017 ; IHS Markit                                                             12
EMEA – REC performance and regional highlights

  Q3 2017 Module Shipments split by Segment                             REC Performance Highlights
  (in %)                                                                 • Best third quarter shipment results ever for REC in
                      Commerical / Utility
                                                                           EMEA
                                       Residential / Distribution
                                                                         • Germany was once again the top market accounting for
                                                                           the largest share of EMEA shipments
                                                                         • Netherlands, which faces a very positive growth outlook
                                                                           for PV is amongst the top REC markets as well
                                                                         • REC has been hugely successful in entering the
                                                                           Turkish market in Q3’2017
                                                                         • The company sees increasing interest especially from
                                                                           Scandinavian countries in the Commercial &
                                                                           Industrial rooftop segment based on self-consumption
                                                                         • The company is actively screening business
                                                                           opportunities in the emerging Eastern European
                                                                           markets
                                                                        EMEA Region Development Highlights

                                                                         • Irish government launched a public consultation running
                        36%                                                until November 3 on its new Renewable Electricity
                                                                           Support Scheme (RESS), aiming at supporting large-
                                           64%                             scale solar and renewables through competitive
                                                                           auctions
                                                                         • European Commission agreed to a new price
                                                                           mechanism, it published a fixed schedule with
                                                                           quarterly reduction of the MIP for mono and multi
1 REC market segment module shipment volume splits are best estimates      panels until Sept. 2018 imported from China
Source: REC
                                                                                                                                 13
APAC – REC performance and regional highlights

  Q3 2017 Module Shipments split by Segment                             REC Performance Highlights
  (in %)                                                                 • Japan - continuous solid demand from partner distributors
                                        Commerical / Utility
                                                                           in the Commercial & Industrial as well as residential
                                        Residential / Distribution         segment, with the latter having seen the successful launch
                                                                           of the PE50 2S mono; REC also delivered into utility scale
                                                                           projects in Q3
                                                                         • India - top market with a strong brand recognition for
                                                                           REC across all market segments despite the tough pricing
                                                                           environment
                                                                         • Australia – serving successfully the distribution
                                                                           segment with long-standing partnerships
                                                                         • As the importance of panel quality is widely recognized
                                                                           among industry stakeholders, REC faces growing demand
                                                                           from several APAC countries (i.e. Thailand and Taiwan)
                                                                        APAC Region Development Highlights

                                                                         • India’s utility sector faces uncertainty following PPA
                                                                           signing delays due to rising module prices, PPA
                         30%                                               renegotiations by several states, slowing auction activity and
                                                                           the ongoing Antidumping investigation against Chinese PV
                                                                           imports
                                           70%                           • Australia reached 5.9 GW cumulative installed PV
                                                                           rooftop as of the end July 2017, according to figures
                                                                           provided by Australia’s Clean Energy Regulator
                                                                         • Japan will hold its 1st renewables auction for up to 500MW
1 REC market segment module shipment volume splits are best estimates      of PV projects larger than 2MW in Q4’17
Source: REC; IHS Markit, Bloomberg
                                                                                                                                   14
1   2   3   4   5

European Market Outlook
After years of decline, Europe will return to growth
due to demand via tenders and self-consumption

 PV Installations by Country
 In GW, 2016-2020E, Ranked by 2017E                                                              • By having mostly transitioned from
                                                                                                   pure government-based support
                                                                                                   schemes to utilizing market
                                                             13.4
                                                                                                   based instruments like auctions,
                             +17%              12.7                                                REC expects Europe will return to
                                  9.9                                                              PV growth in the years ahead
                                                              6.4                                • Demand facilitators are mainly:
                                                5.8
                    7.9                                                            Others1           •     Auctions for large-scale PV
                                  4.1
       7.2                                                                         Italy             •     New business models via
                    2.4                         0.6           0.6                  Netherlands             self- consumption
       1.6
                                                0.8           0.8                  UK                 • Market growth will be driven
          0.4                     0.5                         0.4
                       0.4                      0.4                                                        by both, established (i.e.
    0.5           0.6               0.7                                            France
                                0.3                           1.5                                          Germany, France,
                    0.8                         1.5                                Turkey
       2.0                        1.4
                                                                                                           Netherlands) and new PV
                    0.9                                                            Germany                 markets (i.e. Turkey, Hungary,
                                                1.5           1.6
       0.6                        1.1                                                                      Ireland)
                    1.3
       0.6                                                                                       • A positive outlook also exists on
                    1.6           1.9           2.0           2.1                                  subsidy-free solar farms planned,
       1.5
                                                                                                   i.e. in Italy and the UK
     2016         2017E         2018E         2019E        2020E

1 – Others mainly driven by Spain, Ireland, Hungary, Russia, Poland, Scandinavia
Source: REC internal estimates, IHS Sept. 2017, BNEF Aug. 2017
                                                                                                                                      16
Europe remains mainly a rooftop market, but the
growing number of tenders fuels utility growth
 PV Installations by System Type                                                         • Commercial & industrial segment is a key
 In GW, %                                                                                  driver for installations across Europe
                                                  Residential (incl. Off-grid)
                                                                                             • Top markets for C&I installations are
                                                  Commercial & Industrial
                                                                                               markets with high electricity prices
                                                  Utility-scale                                making PV a very attractive option for
                                                                    CAGR %                     energy cost savings (i.e. Germany,
         7.2        7.9         9.9       12.7        13.4         2016-2020                   Denmark)

                                          18%         18%             +12%               • Introduction of tenders & auctions in several
        21%        21%         21%
                                                                                           countries  strong growth of utility scale
                                                                                           segment in the years ahead
                                                                                             • Examples: Germany, France, Poland,
                                                                                               Turkey and possible Ireland (from 2018
                                          49%         48%             +15%
                                                                                               onwards)
        51%        53%         54%
                                                                                         • Despite facing some decline in market share,
                                                                                           by absolute terms residential PV demand
                                                                                           also grows meaningful 2017 to 2020
                                                                                             o Most residential PV markets rely on self-
                                                                      +23%
                                          33%         34%                                      consumption as demand driver - currently
        28%        26%         25%                                                             often only viable if supported by some sort
                                                                                               of regulatory framework i.e. net metering
                                                                                               or FiT for surplus electricity
       2016       2017E 2018E 2019E 2020E
                                                                    Rooftop1
                                                                                             o Examples: Germany, Denmark, Italy,
         3.4         4.7        6.1         6.7        6.9          (in GW)                    Switzerland
1 Rooftop including Residential and Off-grid as well as small and medium commercial
Source: REC, IHS Demand tracker Sept. 2017 & Europe Residential PV Report – April 2017                                                           17
                                                                                                                                             .
Self-consumption to spur stable growth of residential
PV across Europe, avoiding FiT volatility
Examples for business models via self- consumption
                                                                                       Sweden – self-consumption tax
                                                                                         scrapped
•      High electricity prices lead the way to self-                                   • Increase of attractiveness for PV
       consumption                                                                       due to nearly eliminated tax
•      Self-consumption levels are a sensitive                                         • Introduction of storage funding
       factor for socket parity1                                                       Denmark – self consumption
•      As systems become cheaper and storage                                           • High retail electricity prices are in
       accessible, the future looks rather bright                                        favor for the pick up of residential
•      Clear regulatory framework for prosumers                                          and small-commercial PV
       needed i.e. in regard to grid tariffs and
       payments for excess electricity as such factors                                 Germany – “Mieterstrom” model
       significantly influence the revenue & savings                                   • Neighbor solar supply model
       model                                                                           • Involves multiple mini onsite direct
                                                                                         wire PPAs

                                                                                       France – “collective self-
                                                                                         consumption”
                                                                                       • PV installation(s) and consumers
                                                                                         need to be located near to one
                                                                                         another

                                                                                       Italy – “Sistemi Efficienti di Utenza”
                                                                                       • Power Purchase Agreements are
                                                                                         governed by the “Sistemi Efficienti di
                                                                                         Utenza” (SEU) regulatory framework

1 Reflects the point in time then solar electricity is cheaper than grid electricity                                             18
Source: REC, SolarPower Europe, Bloomberg
Commercial socket parity is already widely spread in
Europe in 2017 but it needs to be leveraged more
  Commercial SP in 2017, 75% on –site consumption                                                         •     Self-consumption levels are a sensitive
  Value from solar energy, ($/kWh)                                                                              factor for socket parity – however
                                                                                                                commercial customers and their
                                                                                                                consumption profile often can be well
                                                   U.S.: HI
                                                                                                                matched with a PV system design
      0.20
                                                                                                          •     Clear regulatory framework needed to
                                                                              Italy                             avoid consumer uncertainties
                                                                Spain
                                                                                                          •     Actively address and overcome
                                                                                Jordan                          consumers hesitation on PV adoption
      0.16                                                                                   Turkey

                                                               U.S.:NY                                                        Japan: Aichi               MEA
                                                                                       Germany
                                    U.S.:CA                                                                                                              APAC
      0.12                                                                                                        UK
                                                                                                                 Netherlands                             AMER
                                                                           France
               Australia:                                                                                                                                EUROPE
               Queensland             China:                                  Algeria Mexico    Chile
                                      North central                               China:
      0.08                  India: Tamil Nadu                                     Eastern
                                                                               U.A.E.     Canada                    Hungary
                                                                                                                                             = Bubble sizes denote total
                                                 South Africa                                                                                addressable market size
                                                                      Egypt
                                                                                                                                             = indicating socket parity
      0.04                                                                                                                                   (SP); Regions above this
                                                                                                                                             line have reached SP

     0.02
                                                                                                                                                    LCOE
           0.04                      0.06                      0.08                      0.10                    0.12               0.14
                                                                                                                                                    ($/kWh)
Source: Bloomberg New Energy Finance “Socket Parity is Here, but solar adoption needs more”, October 16, 2017
                                                                                                                                                                   19
Rising PV installation levels in Europe will trigger
significant job creation based on SolarPower Europe
                                                                                                 The EU could see a 115% increase of jobs
•    Europe is entering into a new PV growth phase
                                                                                                 created by PV in 2021 compared top 2016 with
     after years of decline due to market mechanism
                                                                                                 rooftop installations supporting the vast majority of
     adjustments
                                                                                                 FTEs
•    Significant positive impact of direct and indirect
                                                                                                Jobs² supported by PV industry in EU-28
     job creation in the EU in the years to come
                                                                                                In ‘000 FTE (Full-time Employees) by segment
•    Latest job study by SolarPower Europe1 and EY
                                                                                                   350
     has found that                                                                                                                                      Ground-mounted
                                                                                                                            -73%
         •     By 2021 the EU should have around                                                   300                                                   Rooftop
               ~175.000 jobs connected to PV (+115%
               compared to 2016)
                                                                                                   250
         •     Due to efficiency gains in manufacturing
               and services, employment levels like in                                             200                                          +115%
               2008 are only realistic under a massive PV
               ramp-up scenario – like a much higher RE                                            150
               target by the EU
         •     Rooftop PV installations support almost 3                                           100
               times as many jobs than ground-mounted
               installations due to higher labor needs for                                           50
               installation, maintenance and operations
•    Based on a countries installation growth as well as                                              0
     installation mix, the job creation can vary                                                                  2008                 2016                 2021
     significantly among EU member states

1 SolarPower Europe “SolarPV Jobs & Value Added in Europe”, Nov. 2017; 2 Jobs referring to Direct & indirect jobs as well as upstream and downstream related jobs   20
SolarPower Europe1 latest report highlights the positive
impact of a more ambitious EU RES target for job creation
•       There is much more potential to explore if the EU                                          A RE target change from 27% to 35% could
        would increase its current renewable energy (RE)                                           trigger an additional job creation of up to 56%
        target of at least 27% of final gross consumption by
        2030 towards 35%                                                                           Jobs2 supported in 2030 by EU-28-RE targets
                                                                                                   In FTE (Full-time Employees) by sector
•       Achieving the 27% RE target requires additional PV
        installations of 110GW between 2016 to 2030                                                                                                       FTE Upstream
           •      Roughly 8 GW p.a., which is not too ambitious                                                                                           FTE Downstream
                                                                                                          350
           •      PV would account for 7% of total electricity
                  consumption in 2030                                                                     300
•       An revised RE target of 35% requires further                                                                                                        +56%
        additional 118 GW of PV capacities                                                                250
           •      This would in total add up to required 228 GW
                                                                                                          200
                  of additional PV (~16 GW p.a. from 2016-
                                                                                                                                          +50%
                  2030)
                                                                                                          150
           •      This is feasible due to the competitiveness of
                  PV against other technologies in adjusted                                               100
                  power markets which account for a higher
                  share of RES                                                                              50
           •      Under the 35% RE Target, its assumed that PV
                  accounts for 10% of electricity demand                                                      0
                                                                                                                        2020            2030       2030
•       REC highlighted already in 2016 the need for higher                                                                           27% Target 35% target
        installation levels globally to achieve the COP21
        target
                                                                                                                                                                         21
    1 SolarPower Europe “SolarPV Jobs & Value Added in Europe”, Nov. 2017; 2 Jobs referring to Direct & indirect jobs as well as upstream and downstream related jobs
The temperature increase targets mean up to 4.8 TW of
PV capacity is needed in addition to current trend by 2025
 Forecast annual solar PV installations
 GW
                                                                                                 ~9x
      Additional capacity required to abate CO2 emissions to meet 1.5C target
      Additional capacity required to abate CO2 emissions to meet 2C target                      1,713
      Projections based on current trends before COP21

~Yx    Annual increase in forecast capacity required to meet 1.5ºC target
                                                                                                 489
                                                                                         1,300

                                                                                         364
                                                                                  966

                                                                                  264
                                                                            697
                                                                                                 1,035
       1.3x
                                                                            184
                                                               481                       772
                                                               120                559
                                                        310
                                                                            389
                                                         69    254
                                            176
              6         97    9    118 14          30   147
        86
              13              20                   64                             142    164     188
        67              68          75 29    81          94    108          124

      2016             2017        2018     2019        2020   2021     2022      2023   2024    2025
Source: REC analysis
                                                                                                         22
1   2   3   4   5

REC Global Outlook Q4 2017 & 2018
Outlook towards Q4 2017 and beginning of 2018

  •     REC Q4 2017 outlook
          •     Expected sequential volume growth of approximately 12 - 18%
          •     Nearly fully booked for Q4 2017 – strong demand pull from all regions

   •     Outlook beginning 2018:
           •     Strong order books going into Q1 2018
           •     Continuous investment in technology ensuring technology leadership and a competitive
                 cost position

   •     PV market outlook - Strong PV demand fueled by several factors across all segments:
           •     Auctions / tendering for large-scale PV supporting demand creation via declining pricing
           •     New business models via self- consumption and an increasing number of consumer who
                 want to actively participate in the electricity market by selecting the right supplier or
                 become a producer themselves (“prosumer”) - Example: in 2017, around 30 regions
                 globally have already reached commercial socket parity1
           •     Declining LCOE of PV and storage leading to increasing attractiveness and
                 competitiveness providing cheap and clean electricity 24/7
           •     Rising interest and demand for corporate PPAs also in Europe, following the US example,
                 where such agreements are well recognized

1 assuming 75% on-site consumption, “Socket Parity Is Here, But Solar Adoption Needs More”, BNEF, Oct.16,2017)   24
Thank you!

                                                                    For more information, please contact:
                                                                              Agnieszka Schulze
                                                                        Head of Global PR, REC Group
                                                                   E-mail: agnieszka.schulze@recgroup.com

The content of this presentation is strictly confidential. REC is the exclusive owner or licensee of the content, material, and information in this presentation. Any reproduction, publication or reprint, in whole or in part, is strictly prohibited. The information in this presentation may not
be accurate, complete or up to date, and is provided without warranties or representations of any kind, either express or implied. REC, as well as its directors, officers and employees, shall not be responsible for and disclaims any liability for any loss or damages, including without
limitation, direct, indirect, incidental, consequential and special damages, alleged to have been caused by or in connection with using and/or relying on the information contained in this presentation.
You can also read