Corporate Presentation - Q1 2021 TSXV: OM - 121 Group
←
→
Page content transcription
If your browser does not render page correctly, please read the page content below

Corporate Presentation
             Q1 2021

           TSXV: OM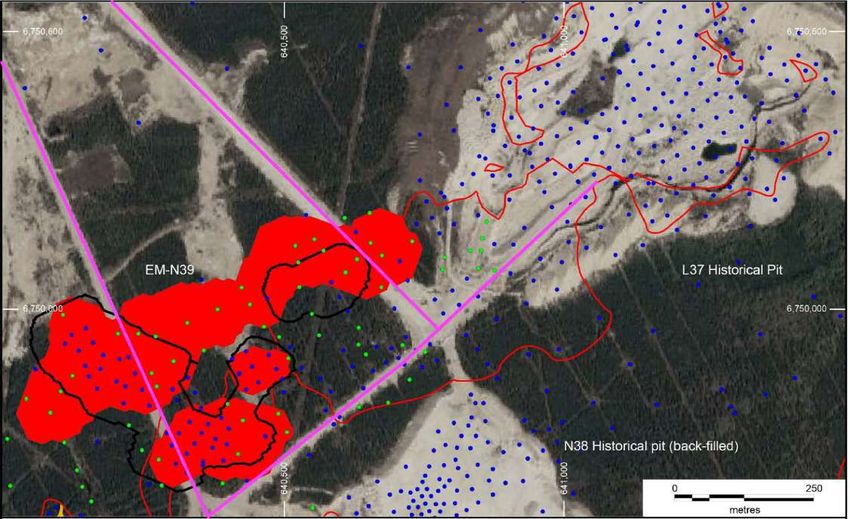
Forward-Looking Statements & Cautionary
   Notes Regarding TechnicalInformation
This presentation (the "Presentation") contains ""forward-looking information" within the meaning of applicable Canadian securities legislation based on expectations, estimates and projections as at
the date of this Presentation. Any statement that involves predictions, expectations, interpretations, beliefs, plans projections, objectives, assumptions, future events or performance (often, but not
always, using phrases such as “expects”, or “does not expect”, “is expected”, “interpreted”, management’s view”, “anticipates” or “does not anticipate”, “plans”, “budget”, “scheduled”, “forecasts”,
“estimates”, “potential”, “feasibility”, “believes” or “intends” or variations of such words and phrases or stating that certain actions, events or results “may” or “could”, “would”, “might” or “will” be taken,
occur or be achieved) are not statements of historical fact and may be forward-looking information and are intended to identify forward-looking information. This Presentation contains forward-
looking information pertaining to, among other things: the Pine Point Project having world-class potential, including the potential to be one of the top ten zinc mines; the results of the PEA, including,
but not limited to, the IRR, NPV and estimated costs, production, production rate and mine life; the expectation that the Pine Point Project will be an robust operation and profitable at a variety of
prices and assumptions; the expected high quality of the Pine Point concentrates; the potential impact of the Pine Point Project in the Northwest Territories, including but not limited to the potential
generation of tax revenue and contribution of jobs; and the Pine Point Project having the potential for mineral resource expansion and new discoveries. Forward-looking information is not a
guarantee of future performance and is based upon a number of estimates and assumptions of management, in light of management’s experience and perception of trends, current conditions and
expected developments, as well as other factors that management believes to be relevant and reasonable in the circumstances, including, without limitation, assumptions about: favourable equity
and debt capital markets; the ability to raise any necessary additional capital on reasonable terms to advance the development of its projects and pursue planned exploration; future prices of zinc
and lead; the timing and results of exploration and drilling programs; the accuracy of mineral resource estimates; production costs; operating conditions being favourable; political and regulatory
stability; the receipt of governmental and third party approvals; licences and permits being received on favourable terms; sustained labour stability; stability in financial and capital markets;
availability of equipment; and positive relations with local groups. Forward-looking information involves risks, uncertainties and other factors that could cause actual events, results, performance,
prospects and opportunities to differ materially from those expressed or implied by such forward-looking information. Factors that could cause actual results to differ materially from such forward-
looking information include, but are not limited to, risks relating to the ability of exploration activities (including drill results) to accurately predict mineralization; errors in management’s geological
modelling; capital and operating costs varying significantly from estimates; the preliminary nature of metallurgical test results; delays in obtaining or failures to obtain required governmental,
environmental or other project approvals; Osisko Metals’ history of losses and negative cash flow; uncertainties relating to the availability and costs of financing needed in the future; changes in
equity markets; inflation; the global economic climate; fluctuations in commodity prices; the ability of Osisko Metals to complete further exploration activities, including drilling; delays in the
development of projects; environmental risks; community and non-governmental actions; other risks involved in the mineral exploration and development industry; the ability of Osisko Metals to
retain its key management employees and skilled and experienced personnel; and those risks set out in the Company’s public documents filed on SEDAR at www.sedar.com. Although the
Company believes that the assumptions and factors used in preparing the forward-looking information in this Presentation are reasonable, undue reliance should not be placed on such information,
which only applies as of the date of this Presentation, and no assurance can be given that such events will occur in the disclosed time frames or at all. The Company disclaims any intention or
obligation to update or revise any forward-looking information, whether as a result of new information, future events or otherwise, other than as required by law.
The information herein is not for distribution and does not constitute an offer to sell or the solicitation of any offer to buy any securities in the United States of America or to or for the benefit of any
US Person as such term is defined under the United States Securities Act of 1933, as amended.
Reference to historical production in the vicinity of Osisko Metals properties in this Presentation does not imply that any future mineral resources or discoveries will be of economic viability, nor does
it imply that additional discoveries will be made.
PRELIMINARY ECONOMIC ASSESSMENT
This PEA was prepared for Osisko by BBA Inc, WSP Canada Inc. and other industry consultants, all Qualitied Persons (“QP”) under National Instrument 43-101. The study was coordinated by the
Company’s Project Manager Annie Beaulieu P.Eng. and in collaboration with the Osisko Gold Royalties Technical Services Group. The QPs have reviewed and approved the content of this press
release. Independent QPs include:
Colin Hardie, P.Eng., Pierre-Luc Richard, P. Geo. (BBA)
Hugo Latulippe, P.Eng., Eric Poirier, P. Eng. (WSP)

QUALIFIED PERSON
The scientific and technical information contained in this Presentation has been reviewed and approved by Robin Adair, P.Geo. VP Exploration of Osisko Metals, a “Qualified Person" within the
meaning of National Instrument 43-101 – Standards for Disclosure of Mineral Projects.
                                                                                                                                                                                                        2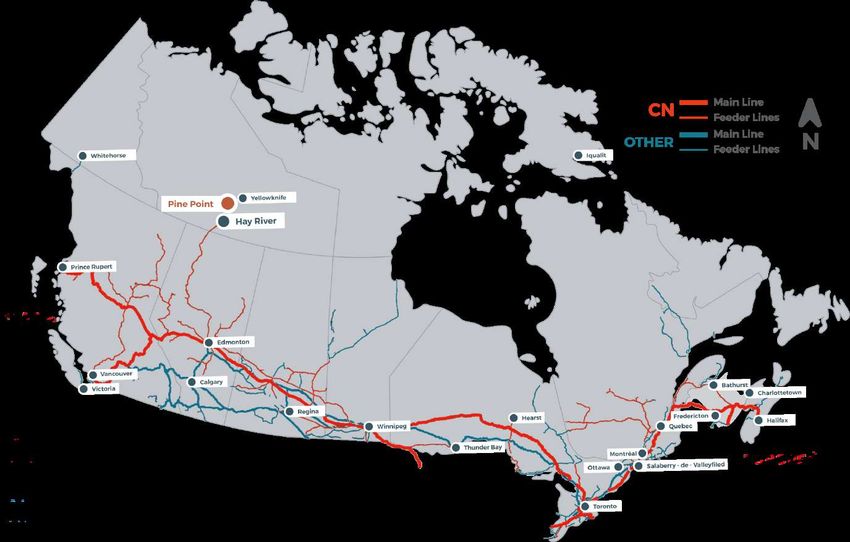
Key Take-Aways

• Decades-long divestment from resource sector is leading
  to global base metal reserve depletion.
• Unsustainable situation that is further constrained by
  COVID-19 supply deficits.
• Shift toward a green, sustainable economy post-COVID
• OM well positioned to develop one of Canada’s largest
  zinc-lead projects – the Pine Point project in NWT.
• Pine Point After-Tax NPV of $500M and IRR of 29.6%
   • Payback of 2.8 years
   • Average annual production of 327Mlb of zinc and
     143Mlb of lead
                                                         3
   • Expected C1 cost of US$0.67/lb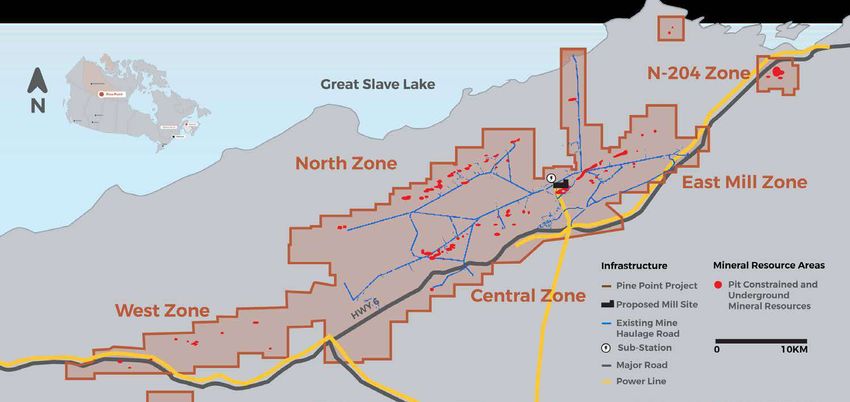
Construction And Infrastructure Will Drive
The Demand For Zinc

                   Constructio
                   n And

                                         Source: Wood Mackenzie   4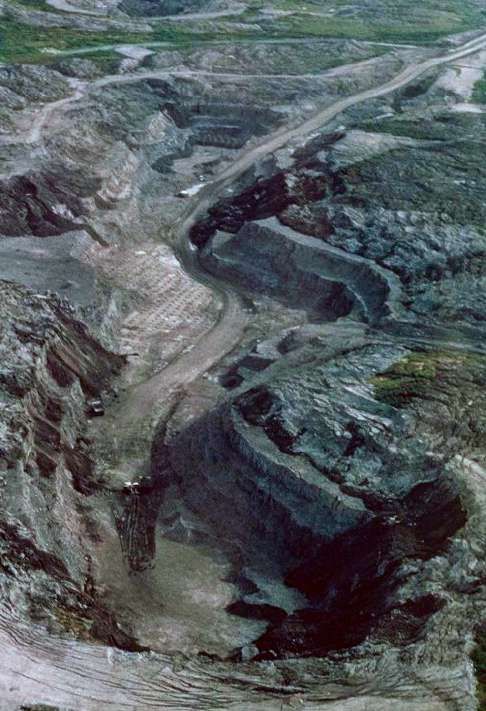
A World Without Galvanization

  Productiontest pickup without galvanization –3 yrsold

                                                          5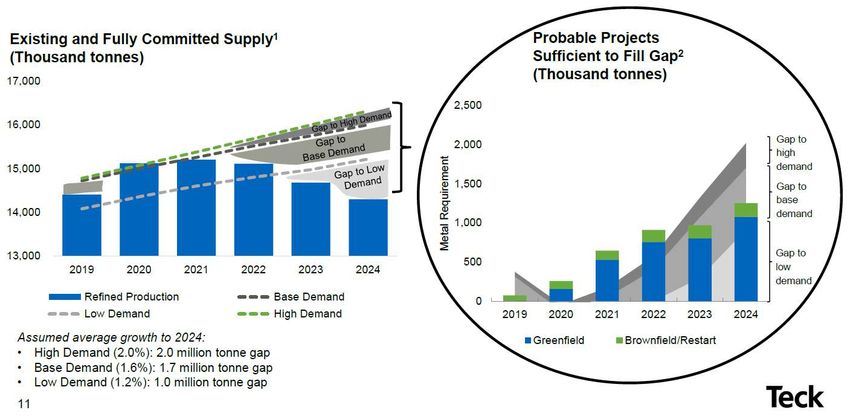
Gap In Global Supply To Reappear

                                   6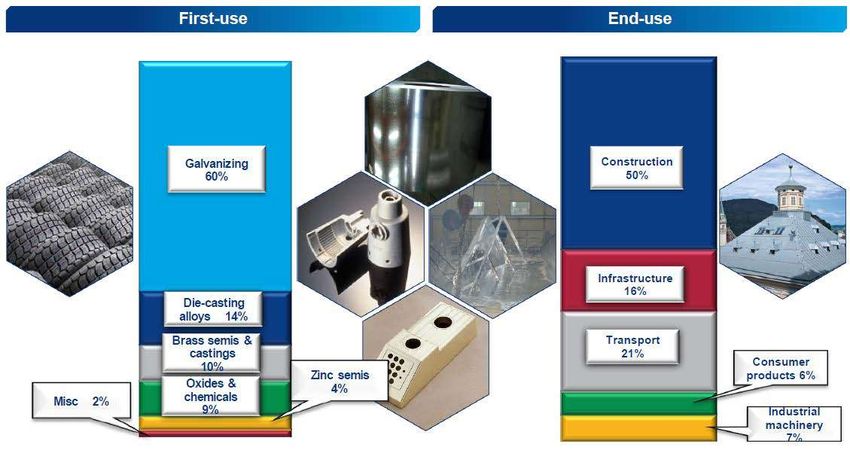
North American Zinc Supply Deficit Is Coming

                          1400
                                                                                                                                  35% Drop in
                          1200                                                                                                      NA Zinc
                                                                                                                                  Production
 Zn in Concentrate (kT)

                          1000

                           800

                           600

                           400

                           200

                             0
                                     2016         2017        2018         2019         2020         2021         2022     2023      2024        2025

                                 Red Dog                 Pend Oreille             Middle Tennessee          Greens Creek      Empire State (Balmat)
                                 East Tennessee          Doe Run                  Bracemac McLeod           Caribou           Kidd Creek
                                 Secondary               Hudbay Manitoba          Langlois

• Supply gap to re-appear within the next 2 years
• North American mine production: 35% drop expected in 4 years.
  This is similar to the global trend.                                                                                                                  7
                                       Source: CRU, Wood Mackenzie and Osisko Metals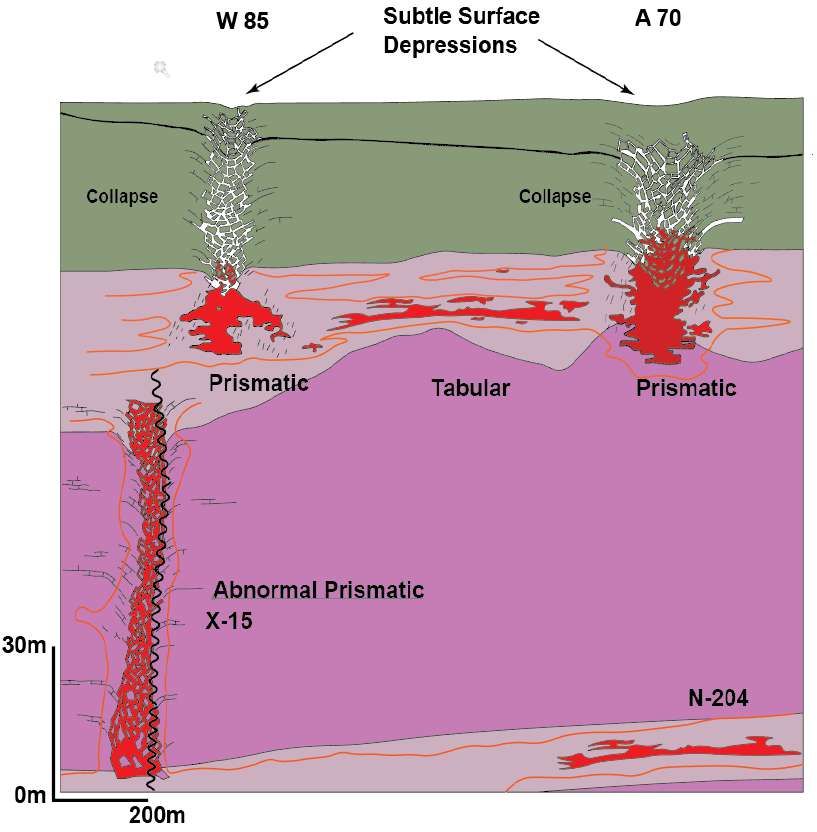
The Pine Point Mining Camp

                             Cominco 1964-1988
                             64 Mt @ 10% Zn+Pb
                                  OPEN PIT

                                            8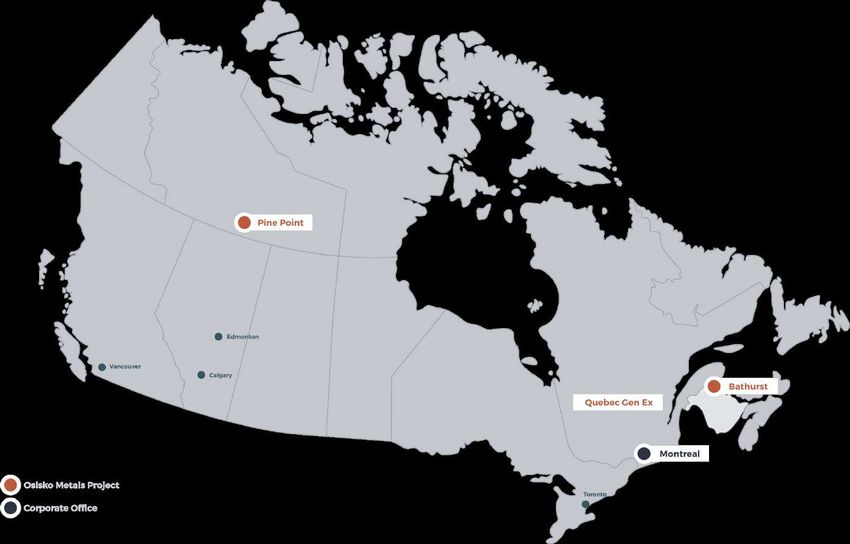
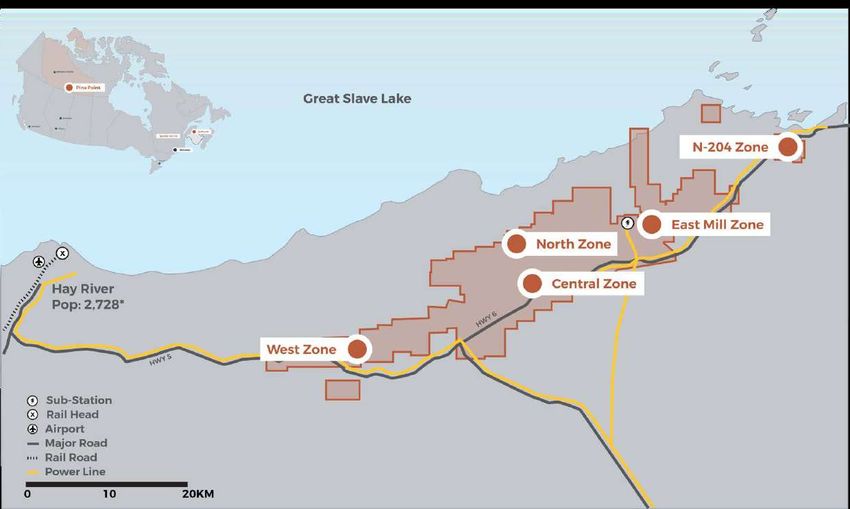
Support Infrastructure Already In Place

  • Within 42 km of Hay River,           • Paved Highway Access.
  • Known as the “Hub of the North”.     • Low-Cost Hydro-Electric Power Available   9
  • CN Rail Head From Edmonton & Airport. On Site From Taltson Dam.
Positive PEA Outlines Potential For Significant
 Zinc and Lead Production at Pine Point
• After-Tax NPV of $500M and IRR of 29.6%
         • Potential To Be Top-10 Global Zinc Mine On Production Basis
         • Rapid Payback Of 2.8 Years
• Infrastructure In Place:
    • Hydroelectric Power Substation Located on Site
    • Rail Access Within 60km
    • Paved Roads to Site and ~100km of 25m Wide Haul Roads on Site
• Premium High-Grade Concentrate: Among the Cleanest and Highest Quality
  Globally
• Opportunities To Enhance PEA:
    • Resource expansion laterally along open pit-constrained boundaries of deposits;
    • Metallurgical testing and material sorting optimization to enhance recoveries and
      increase the sorted coarse material fraction;
    • Hydrogeological studies to quantify and reduce water management costs       10
PEA Financial Overview
Internal Rate of Return ("IRR") After Taxes 29.6%
After-tax Net Present Value ("NPV") (Discount Rate 8%) $500M
After-Tax Payback Period (Years) 2.8
Pre-Production CAPEX (including $71.2M Contingency) $555M
Average Annual LOM Production Zinc 327Mlb
Average Annual LOM Production Lead 143Mlb
Life of Mine ("LOM") 10 Years
Total Mineralized Material Mined 39.1Mt
Average Diluted (12%) ZnEq Grade 6.17%
Gross NSR Revenue After Royalty (LOM) $4,371M
After-tax Operating Cash Flow (LOM) $1,064M
C1 Costs over LOM (ZnEq) US$0.67/lb
Estimated All-In Costs (Total CAPEX plus OPEX, ZnEq) US$0.82/lb
LOM Zinc Price US$1.15/lb
LOM Lead Price US$0.95/lb
FX Rate (CAD:USD) 1.31 11PEA CAPEX Overview
Initial Sustaining Total
Owner’s Cost 17.0 - 17.0
Underground Mine - 220.7 220.7
Surface Mine 14.9 75.7 90.6
Electrical 15.5 15.5
Infrastructure 52.5 11.2 63.7
Processing 249.3 - 249.3
TMF and Water Management 67.1 85.1 152.2
Indirect Costs 68.2 - 68.2
Contingency 71.2 18.2 89.4
Reclamation (net of salvage) - 47.1 47.1
Total 555.7 458.0 1,013.6
12Pine Point on the Global Cost Curve
Over ~15% of the cost curve is unprofitable in this price environment
Pine Point LOM PEA C1 Cost: 67¢/lb
Source: SNL
Pine Point is expected to be within the second cost quartile on a total cash cost basis
Well positioned on the cost curve relative to producers
13Annual Production of Metal In Concentrates
Potential To Be Top-Ten Global Producer)
500
450
Zinc Lead
Annual Production (Mlb)
400
350
300
250
200
150
100
50
0
1 2 3 4 5 6 7 8 9 10
Year
Sourced mainly from small, near-surface open pits with additional
contributions from 8 high grade, shallow deposits mined by underground
methods from the West and Central Zones. 14PEA Mill Overview
Crushing and Pre-Concentration Circuit Throughput 11,250tpd
Coarse Fraction 70% Lower fine fraction could
drive further reduction in
Fine Fraction 30%
mass recovery and mill
XRT Mass Recovery 42% size
Total Mass Recovery (including crusher fines) 59%
Grinding and Flotation Circuit Throughput 6,700tpd Reduction in mill size to
XRT LOM Recoveries positively impact CAPEX
and OPEX
Zinc 93.4%
Lead 99.0%
Flotation LOM Recoveries
To be tested in Q4 2020
Zinc 92.9%
Lead 94.1%
Overall LOM Recoveries
Zinc 86.7%
Lead 92.8%
15Among The Cleanest Concentrates
In The World
18.00% 6,000
P: Above Penalty Level P: Above Penalty Level
Minor Element Penalties (ppm)
16.00%
5,000
Major Element Penalties
P
14.00% P Mn
SiO2
P Hg
12.00% Fe 4,000
P
10.00%
P Cd
Pb
3,000 As
8.00% P Cu
6.00% 2,000 P
P
4.00%
P 1,000
2.00% P P
P P
0.00% 0
Lead & Zinc Concentrates: Premium, High Grade and Clean
• High recoveries for both lead and zinc using conventional flotation processes
• High concentrate grades: Zinc (59%) & Lead (64%)
• Low deleterious elemental content
• No smelter penalties expected
Assumptions: Major Element Penalties is Fe+Cu+Pb+SiO2; Minor Element Penalties is As+Cd+Mn+Hg
16
Source: Wood Mackenzie & NR dated August 7th 2019Access To International Concentrate Markets
Rail Distances:
• Edmonton to Hay River 970km
• Edmonton to Prince Rupert 1,300km
• Edmonton to Vancouver 1,245km 17Project Boundary Location
Large Near Surface
Exploration Upside
Resource Base
18Deposit Styles at Pine Point (MVT)
Watt Mountain Shale
Sulfur Point
(Dolomitized)
Pine point poorly
investigated
Pine Point carbonates
Dolspar “B Spongy” unit
alteration (base of Pine Point)New MRE Confirms Potential for Further
Resource Expansion
• MRE spread across a total of 47 deposits of which 11 remain open along
strike. Key focus of forthcoming 2020 drilling campaign.
• Drilling in the East Mill successfully pushed pit boundaries; demonstrating an
opportunity to connect neighboring pit and reduce strip ratio.
• 25.5% of the total tonnage at Pine Point now in the indicated category.
Possibility to rapidly convert other portions of the MRE with limited drilling.
20MRE Expansion In East Mill Zone
2020 MRE
Modelled Pit Outline
2019 MRE
Modelled Pit Outline
Mineralization
In situ mineralization:
zinc and lead
Drill Hole Locations
2019 New drill holes in
the 2020 MRE
All other drill holes
Infrastructure
Existing mine haulage
roads
21Deposit Boundary Target Areas
Over 11 deposits open
across Pine Point
22High Grade Historical Drilling Not
Included In Current Resource
Lead +
Width Metres Lead Zinc Grade *
Hole Name Trend Zinc
Metres
(m) % % %
1362 Main 4.88 2.49 10.75 13.24 64.6
1883 North 5.27 5.03 16.24 21.27 112.1
2952 North 7.62 2.28 4.42 6.7 51.1
3053 Main 17.07 3.73 6.88 10.62 181.3
3280 North 4.27 2.23 5.75 7.98 34.1
5322 Main 4.57 7.83 5.63 13.47 61.6
6818 North 11.28 1.61 5.13 6.74 76.0
YR81-48-4 South 3.05 0.70 10.30 11.00 33.6
YR77-04-01 Main 12.19 0.44 4.2 4.63 56.5
YR86-02-02 N204 4.88 2.38 8.73 11.11 54.13
2967A Main 11.13 0.31 4.81 5.12 56.98
L-36-632 Main 7.47 0.69 5.18 5.87 43.86 23Pine Point Collaboration Agreements
Show Community Support
• In 2019, Osisko Metals announced two separate Collaboration
Agreements with:
• Deninu Kue First Nation
• Northwest Territory Metis Nation
• Both Indigenous communities are located near the Pine Point Project.
• Collaboration Agreements promote a cooperative relationship related to
exploration and development activities at Pine Point.
• The Agreements support education, training, employment, business
and contracting opportunities.
• Information sharing, site visits and broad outlines of topics for future
agreements are also included.
24Conclusions
• Base Metal markets are at 100-year lows.
• Unsustainable situation that is further constrained by
COVID-19 supply deficits.
• Shift toward a green, sustainable economy post-COVID
• OM well positioned to develop one of Canada’s largest
zinc-lead projects – the Pine Point project in NWT.
• Pine Point PEA indicates after-tax NPV of $500M and IRR of
29.6%.
• 2021 work will focus on resource expansion, brownfield
exploration, water management de-risking and environ-
mental baseline studies.
25Contacts
1100, av. des Canadiens-de-Montréal Investors and General Inquiries:
Suite 300 info@osiskometals.com
Montreal, Qc, H3B 2S2
Tel: 514-940-0670 Fax: 514-861-1333
26You can also read