Unlocking Arctic Potential: Expanding Our Global LNG Footprint to 2030 - Energy Affordability, Security & Sustainability
←
→
Page content transcription
If your browser does not render page correctly, please read the page content below
Unlocking Arctic Potential: Expanding
Our Global LNG Footprint to 2030
Energy Affordability, Security & Sustainability

Investor Meetings

June 2020
1Q 2020 Financial Highlights

                                                                                                                          21%
                                                  2.8                                    REVENUE
                                                                                         (US$ bln)

                                                  1.5                         NORMALIZED EBITDA
                                                                                  (US$ bln)
                                                                                                                          15%

                                                                                                                          19%
                                                  0.8                        NORMALIZED PROFIT*
                                                                                  (US$ bln)

                                                  0.3                            FREE CASH FLOW
                                                                                     (US$ bln)
                                                                                                                          7%

                                                  0.7                                      CAPEX
                                                                                          (US$ bln)
                                                                                                                          15%

                                                                                     NET DEBT
                                             -0.12                                TO NORMALIZED
                                                                                    EBITDA** (x)
                                                                                                                          n/a

                                           *excluding the effect of foreign exchange gains (losses) of subsidiaries and
                                           our proportionate share in foreign exchange gains (losses) of our JVs
                                           ** normalized EBITDA from subsidiaries
                                           y-o-y performance

          ✔ Energy Affordability   ✔ Energy Security                ✔ Energy Sustainability
                                                                                                                                2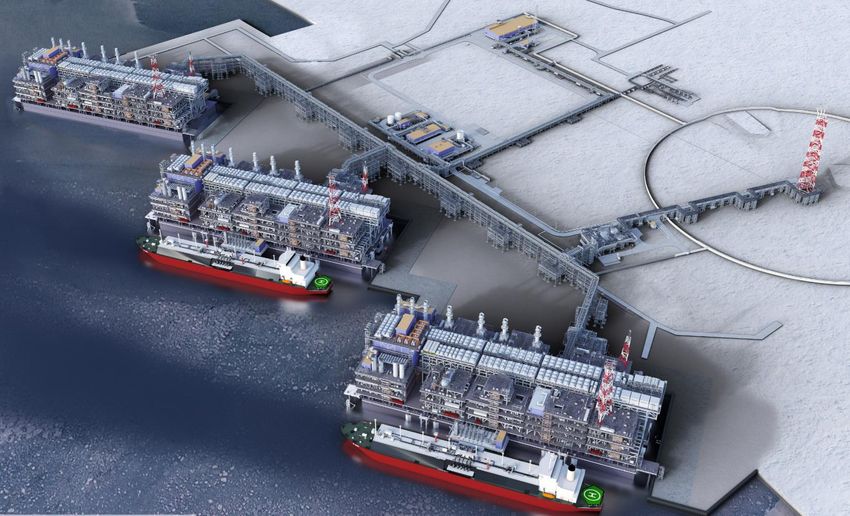
1Q 2020 Operational Highlights
                         SALES VOLUMES

 Natural Gas    LNG          Oil Products   Crude Oil     LPG

 18.2 bcm      2.5 bcm       1.7 mmt        1.2 mmt     0.7 mmt

                                                                  3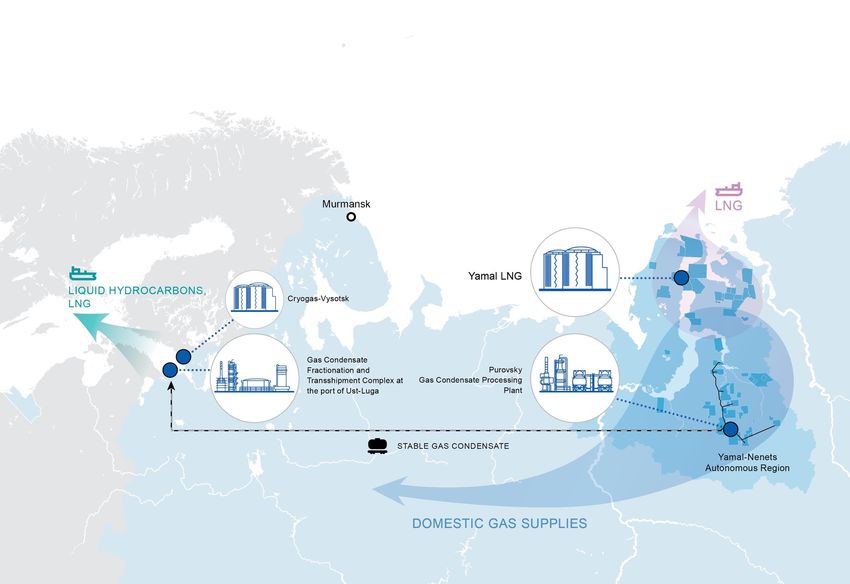
Monetizing Our Resource Base (1Q 2020)
                                                                            Yamal LNG
                                                                            (nameplate capacity
                                                                            – 17,4 mmtpa)
PRODUCING FIELDS
                                            Natural gas                                                     LNG
                                                                                                                             Yamal Trade

                                            Natural gas by pipeline          Cryogas-Vysotsk
                                                                             (nameplate capacity – 660 mtpa)
Separation and
                           Unstable gas                                                                                  NOVATEK Gas & Power
  treatment
                           condensate by                                                                                         Asia
                           pipeline                                                                         LNG

            Crude
             oil by
          pipeline
                                                                  88%                                                       12%
                                                            TO DOMESTIC MARKET                                 TO INTERNATIONAL MARKET BY SEA

                                                                  18.2 bcm                                                       2.5 bcm

                61% / 39%
                                      Purovsky Plant (nameplate capacity - 11 mmtpa)                  Ust-Luga Complex (nameplate capacity - 6 mmtpa)
              TO DOMESTIC/
             INTERNATIONAL                       2.8 mmt
                                                                  Stabilization
                                                                                                                  1.7 mmt
                                                                                                                                           Fractionation
                 MARKET                                           of gas                                                                   of stable gas
                                                                  condensate                                                               condensate
                 1.2 mmt
                                                                      76%

                                                                                            81%         Naphtha       Jet fuel      Fuel oil     Gasoil
                                     24%
                                                                                      Stable gas
                                                                                      condensate      63%          16%           10%           11%
                                                LPG                                 19%

                                         80% / 20%                            90% / 10%                                    ~100%
                                       TO DOMESTIC/                         TO DOMESTIC/                          TO INTERNATIONAL MARKET
                                  INTERNATIONAL MARKET                 INTERNATIONAL MARKET                                BY SEA
                                           0.7 mmt                                0.4 mmt                                   1.7 mmt

                                                                                                                                                           4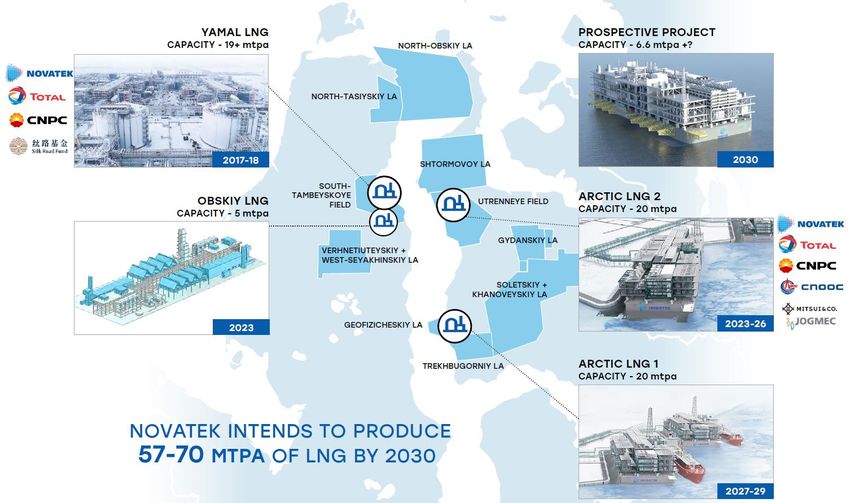
NOVATEK at a Glance 2019

       1.1 BLN BOE                             590 MLN BOE                               65.7 BCM
        Total proved                            Hydrocarbon                            Natural gas sales
    hydrocarbon addition                         production                                in Russia
            (SEC)

      16.3 BLN BOE                               10.1 %                                  12.8 BCM
                                            Share of natural gas                             LNG sales
  Total proved hydrocarbon
                                            production in Russia
        reserves (SEC)

           252%                                  +8.6 %                                  18.4 MMT
      Organic reserve                           Natural gas                          LNG offloaded from
     replacement rate                       production increase                         Yamal LNG

      Fields and license
                                                12.1 MMT                                 16.4 MMT
             areas
                                             Liquids production                          Liquids sales

                   ✔ Energy Affordability   ✔ Energy Security      ✔ Energy Sustainability                 5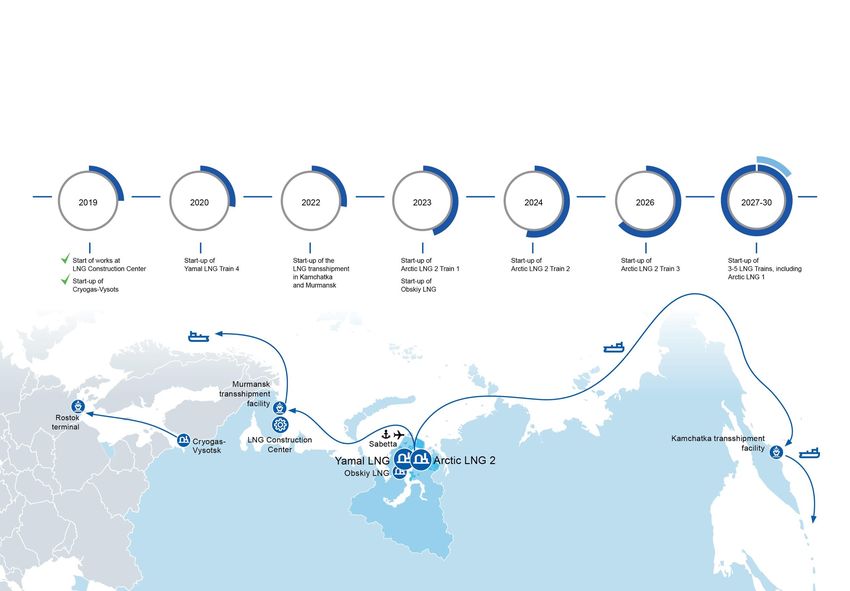
Internally Funded Investment Program
            2 000                                                                                                                                                  20,0

                                                                                                                                     1,724
            1 500                                                                                                                                                  15,0

                                                                                                                                                    1,260
            1 000                                                                                                                                                  10,0
                                                                                 981            1,001
                                                                                                                             932                            889
                                                       830                               846                       842                        841
                     729                       751                                                        769
                                        662                      684

                                                                                                                                                                            Operating CF / CAPEX
              500                                                       595                                                                                        5,0
                              443
US$ mln

                0                                                                                                                                                  0,0

             -500                                                                                                                                                  - 5,0

                     Source: Company data

LNG CAPEX
     -1 000           2       13      20      27      14       95      32      85      70      165      187      305       385      167      234    410      304   - 10,0
          Non-LNG
           CAPEX
                     106      93      71      122     50       68      85      92      117     190      184      279       263      389      322    378      440

            -1 500                                                                                                                                                 - 15,0
                     1Q16    2Q16      3Q16    4Q16   1Q17      2Q17   3Q17     4Q17    1Q18    2Q18      3Q18    4Q18       1Q19    2Q19    3Q19   4Q19    1Q20

                                                           LNG CAPEX          Non-LNG CAPEX             OCF            OCF / CAPEX (rh)

                          Core investments funded primarily through internal cash flows

                                              ✔ Energy Affordability                ✔ Energy Security              ✔ Energy Sustainability
                                                                                                                                                                                                   6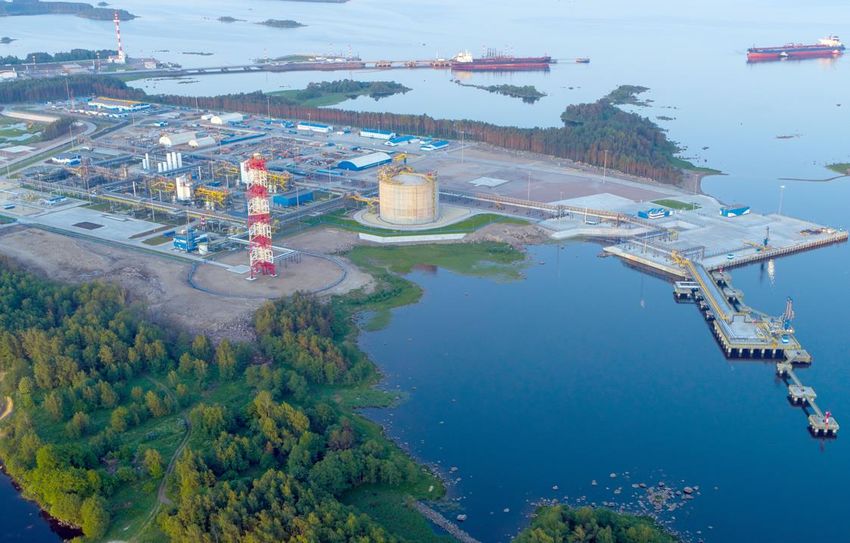
NOVATEK Robust FCF Generation over Shale
Producers (USD mln)
3 000

2 500

2 000

1 500
                                                                                                2 580
                                                                              2 087                                                  2 239
1 000                                                                                                              1 950
                1 386                             1 281      1 350
  500                       1 038       919
         620
    0                                                                                                                                  -62
                                                                                                                    -182
                -501                    -532                                   -505              -519
         -700                                     -773       -737
 -500                       -1 038

-1 000

-1 500
         2010   2011         2012       2013      2014       2015             2016               2017              2018               2019
                                     NOVATEK     34 Shale-Focused O&G average

    Over the decade, US shale-focused O&G companies reported negative
               free cash flows every year, totaling $189 billion
                                                             Source: Company data, IEEFA (Shale Producers Spilled $2.1 Billion in Red Ink Last Year)

                        ✔ Energy Affordability    ✔ Energy Security               ✔ Energy Sustainability                                              7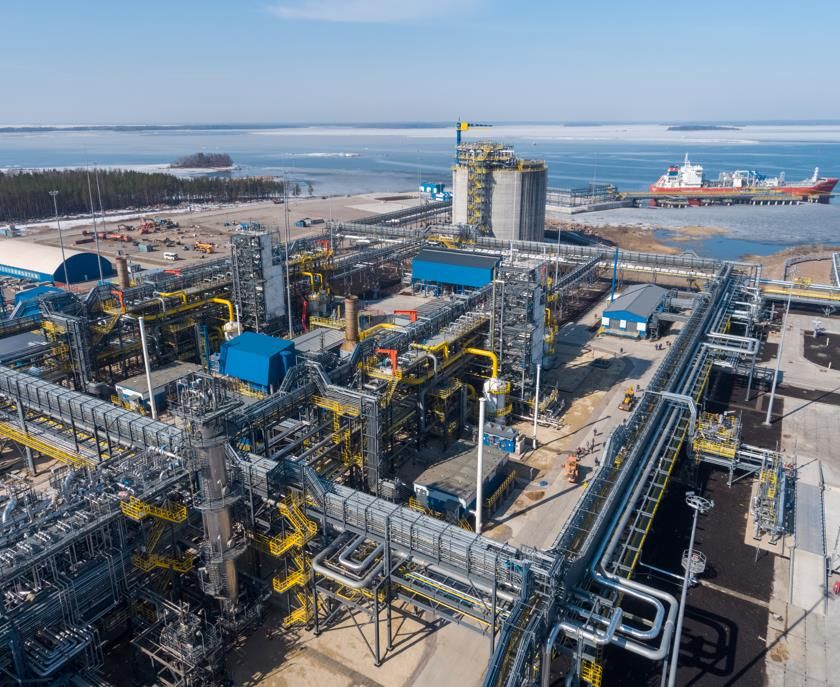
Strategy’s Objectives and Key Events 2018-2020
     Cryogas-Vysotsk
     FID made for Train 1

     Yamal LNG
     Start-up of Train 3                                              ARC7 LNG carriers                         Yamal LNG
                              Cryogas-Vysotsk
                                                                           15 carriers in                       Start-up of Train 4
                              Start-up of Train 1
     Arctic LNG 2                                                             operation
     FEED completion                                                                                            Natural gas liquefaction
                                                                      ARC4 LNG carriers                         complex in
     Kamchatka                                                              7 carriers in                       Magnitogorsk
     Transshipment                                                             operation                        Launch
     Facility
     FEED completion

                                                                                                            2020

                                                                                  East-                         East-Tazovskoye field
     Yaro-Yakhinskoye field                            Arctic LNG 2
                                                                        Urengoyskoye +                          Commissioning
     Commissioning                                        FID made
                                                                                 North-
                                                                       Esetinskoye field                        Dorogovskoye field
                                     South-Khadyryakhinskoye field       Commissioning                          Commissioning
                                                    Commissioning
                                                                        North-Russkoye                          Gas condensate de-
                                                                                  field                         ethanization unit extension
                                               West-Yurkharovskoye       Commissioning                          for Achimov layers
                                                              field
                                                                                                                development at the
                                                     Commissioning       Transshipment                          Samburgskiy LA
                                                                               facility in                      Commissioning
                                                                             Zeebrugge
                                                                         Up to 8 MMTPA

                           ✔ Energy Affordability          ✔ Energy Security                 ✔ Energy Sustainability
                                                                                                                                              8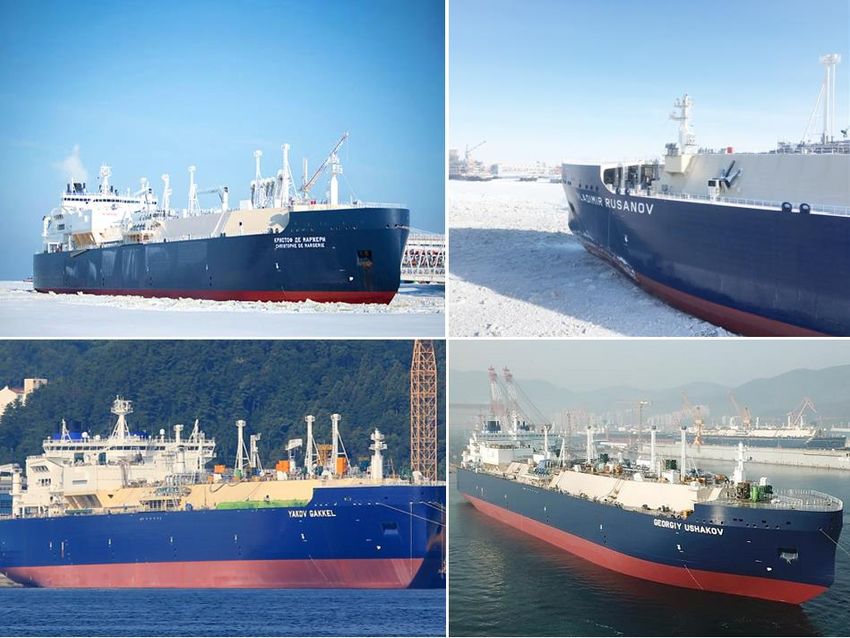
Stable Gas Prices in Russia to Maintain Domestic Business

            5

            4

            3
                                   Henry Hub
  $/MMBtu

            2

            1                 Domestic price
                                in Russia

            0
             Jan-15                  Jan-16            Jan-17            Jan-18            Jan-19             Jan-20

  Source: FTS Russia, NYMEX, IHS

             Russian domestic gas business still a critical part of our revenues and
                                   operating cash flows

                                      ✔ Energy Affordability    ✔ Energy Security   ✔ Energy Sustainability            9
Global LNG Market
✔ Energy Affordability ✔ Energy Security ✔ Energy Sustainability
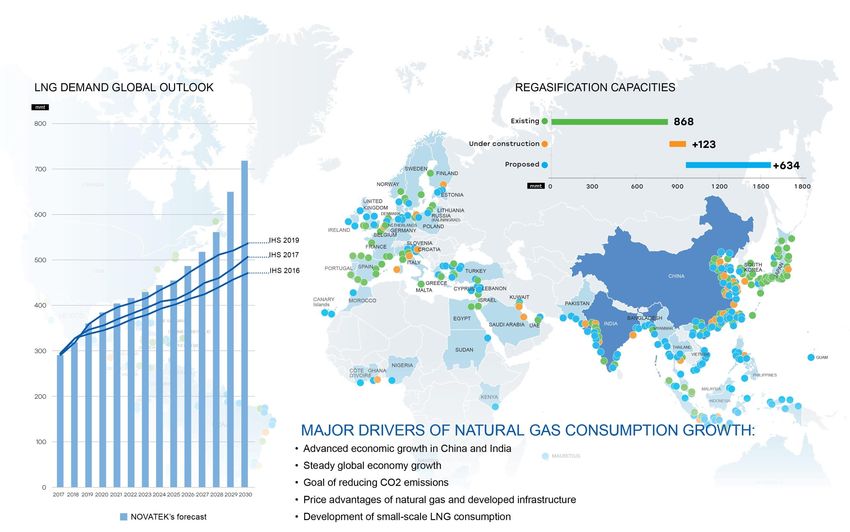
10Significant Potential for Increased Gas
Consumption by Emerging Markets
Size of the circle depends on the population
✔ Energy Affordability ✔ Energy Security ✔ Energy Sustainability
11Global LNG Demand – Stronger than Expected
>740
800
mmtpa
700
600 Europe
500
400 314
300 Asia-
Pacific
200
100
0
2018 2019 2020 2021 2022 2023 2024 2025 2026 2027 2028 2029 2030 2031 2032 2033 2034 2035 2036 2037 2038 2039 2040
Asia Pacific Europe Middle East North America South America Africa
Source: NOVATEK’s interpretation of Wood Mackenzie data
Asia and Europe will account for 88% of incremental LNG demand
✔ Energy Affordability ✔ Energy Security ✔ Energy Sustainability
12Asian Gas Market Prospects
1400 bcm 1274
1200
1000
Gap to be filled mostly
by LNG and pipeline gas
>780 bcm
800
600 740
400 Domestic production?
200
0
2019 2022 2025 2028 2031 2034 2037 2040
Onstream Under Development Probable Development Technical Reserves YTF Demand
Source: NOVATEK’s interpretation of Wood Mackenzie data
✔ Energy Affordability ✔ Energy Security ✔ Energy Sustainability
13European Gas Market Prospects
700 bcm
600
517
500
548
400
Need for global LNG
300
and pipeline gas >430 bcm
200
100
0
2019 2022 2025 2028 2031 2034 2037 2040
Indigenous Production* Contracted - LNG Contracted - North Africa Piped
Contracted - Norway Piped Contracted - Russia Piped Contracted - Southern Corridor Piped
Total requirements†
Source: NOVATEK’s interpretation of Wood Mackenzie data
✔ Energy Affordability ✔ Energy Security ✔ Energy Sustainability
14LNG Demand Increase of around 10% YTD
Import volumes increase/decrease in Jan-May 2020 vs 2019, mmt
0,6 0,5
1,3
1,3
1,4 -1,3
1,4
1,8
1,9
2,3
2,7
161
148 Increase Y-o-Y
Decrease Y-o-Y
Jan-May S. Korea Turkey India UK China Other Spain Belgium Taiwan France Japan Jan-May
2019 2020
Source: NOVATEK’s interpretation of IHS data
Despite pandemic lockdowns the growth of LNG imports to China was 6% YOY
✔ Energy Affordability ✔ Energy Security ✔ Energy Sustainability 15Historical and expected global liquefaction
nominal capacity additions
115 capacity additions 110+ capacity additions
40 39
35 32
28
30 27
23
25 20
17
20
15 13 12
11 11
10 5
5 2
0
-5 -1
-10 -8
2016 2017 2018 2019 2020 2021 2022 2023 2024 2025 2026 2027 2028 2029 2030
Asia Pacific Europe Middle East Africa North/South America
Delay of 200+ mmtpa projects due to lower prices and COVID-19 already in 2020
Source: NOVATEK’s interpretation of Wood Mackenzie data (includes only projects Operational and Under Construction)
✔ Energy Affordability ✔ Energy Security ✔ Energy Sustainability 16NOVATEK’s LNG Production Platform
2024-25
TREKHBUGORNIY LA
BUKHARINSKIY LA
2027-30
✔ Energy Affordability ✔ Energy Security ✔ Energy Sustainability
17NOVATEK’s LNG Production Timeline
18.6 19.6 19.6 26 38 44 57-70
mmt mmt mmt mmt mmt mmt mmt
18Yamal LNG Runs Above Capacity
Yamal LNG ramp-up ahead of
schedule and on budget
Train 1
completed on schedule
5.5 mmtpa
Train 2 completed 6 months
5.5 mmtpa ahead of schedule
Train 3 completed >12 months
5.5 mmtpa ahead of schedule
Train 4 start-up is expected
0.9 mmtpa in 2020
>30 million tons of LNG produced
…an aggregate share of the global More than 400 Earlier launch of Yamal LNG
LNG market LNG cargos have allows to offtake additional
The largest LNG project in Russia been offloaded since LNG volumes
the start-up
✔ Energy Affordability ✔ Energy Security ✔ Energy Sustainability
19New LNG marketing paradigm
New contracts signed by price indexation Average oil indexations in new contracts
50
15%
40 14.4%
Oil-indexation level
14% 14.1% 13.9%
30
ACQ (mmtpa)
13% 13.0%
20 12.0%
12% 12.1%
11.6%
11.7%
10 11.3%
11%
Only SPA’s to end-users
0 10%
2011 2012 2013 2014 2015 2016 2017 2018 2019 2011 2012 2013 2014 2015 2016 2017 2018 2019
Oil European hub Henry Hub Hybrid
Source: NOVATEK’s interpretation of Wood Mackenzie data
✔ Energy Affordability ✔ Energy Security ✔ Energy Sustainability 20Spot LNG market increasing volumes
Share of major spot exporters in 2019, mmt Volume of non long-term LNG trade, mmt
120 35%
30%
100
25%
80
20%
60
>115 MMT
15%
40
10%
20
5%
0 0%
1996
2001
2008
1995
1997
1998
1999
2000
2002
2003
2004
2005
2006
2007
2009
2010
2011
2012
2013
2014
2015
2016
2017
2018
2019
Source: NOVATEK’s interpretation of IHS data
Non long-term trade % of gross trade
✔ Energy Affordability ✔ Energy Security ✔ Energy Sustainability 21Large-Scale LNG Sales
LNG Sales of
NOVATEK Gas & Power Asia
1Q Total (1)
2020 from 2017
Yamal LNG
Number of Norway
cargos 23 200
Volumes, mmt 1.7 14.0 United Kingdom
Netherlands
Belgium
Total dispatched from Yamal LNG
France
Number of Spain
cargos 67 436
China
Volumes, mmt 5.0 31.9 Thailand
India
transshipment
Brazil delivery point
NOVATEK sales
(1) as of 31 March 2020
(2) taking into account all supplies from the Project
(2)
29 countries consumed natural gas molecules from Yamal LNG
✔ Energy Affordability ✔ Energy Security ✔ Energy Sustainability
22Arctic LNG 2
Natural gas production at Utrenneye field, bcm
35
30
25
20
15
10
5
0
2023 2024 2025 2026 2027 2028 2029 2030
Gas condensate production at Utrenneye field, mmt
2,0
1,5
1,0
0,5
0,0
2023 2024 2025 2026 2027 2028 2029 2030
Project Participants
FID made (September 2019)
CAPEX is estimated at US$21.3 bln equivalent
60%
2P reserves under PRMS of the Utrenneye field : 10%
• 1,180 bcm of natural gas
• 62 mmt of liquids
19.8 10%
More than 5,000 people working at the field. Completed the mmtpa
backfilling of the Gas Treatments Unit-1 for the first dome, well
pads 1, 2, and 3 for production drilling 10%
Received official permission on completing Dry Dock #1, 10%
continue with rock blasting at Dry Dock #2
23Cryogas-Vysotsk
Medium-tonnage LNG plant
on the Baltic Sea
LNG production facility and
a transshipment terminal
thousand tons per annum –
660 initial design capacity
designed to handle 30 mcm
capacity LNG carriers
51% Our participation interest
26 shipments by tankers and 195 by
trucks in 1Q2020 = 112 thousand tons
Medium-scale LNG target niche markets and customer segments
✔ Energy Affordability ✔ Energy Security ✔ Energy Sustainability
24All 15 ARC7 Ice-Class LNG Tankers in Operation
Speed in open Speed in ice 1.5 m
water thick
LNG tanker Vessel power
capacity
✔ Energy Affordability ✔ Energy Security ✔ Energy Sustainability
25LNG Logistics to Asia
12
days
85
36
days 29
2019 2040
160
110
79
6 35
days
2019 2040 2019 2040
145 26
days
46 14 7
days
days 4
2019 2040 days
15 86
days
76
2019 2040
Source: NOVATEK’s interpretation of IHS data
✔ Energy Affordability ✔ Energy Security ✔ Energy Sustainability
26Sustainable Development – Integral Part of Strategy*
Sustainable
reporting with
GRI
recommendations
from 2005
* Corporate Strategy 2018-2030
✔ Energy Affordability ✔ Energy Security ✔ Energy Sustainability
27Sustainability Reports Since 2005
Longest history of sustainability reporting in the Russian O&G
✔ Energy Affordability ✔ Energy Security ✔ Energy Sustainability
28Commitment to Developing Sustainable Value
NOVATEK is ranked among top ESG companies FTSE Russell Ratings confirms that NOVATEK
by Thomson Reuters ESG Scores in Russia remains a constituent of the
across all industries FTSE4Good Emerging Index in 2019
Rating
3.4/5
NOVATEK maintained Average Performer NOVATEK is assigned BBB rating
by Sustainalytics in 2019 by MSCI in 2019 - 6 consecutive years
Average Rating
Performer
BBB
64
NOVATEK is among top contributors consistently included in the
MSCI Emerging Markets ESG Leaders Index since inception in 2013*
*MSCI ESG Research, Feb 2020
✔ Energy Affordability ✔ Energy Security ✔ Energy Sustainability
29Dividends: Sharing Our Success
DIVIDEND PAYOUT(1), (RR per ordinary share)
Absolute growth: 36x 32.33
CAGR: 29%
26.06 18.10
2H
14.95
13.90 14.23
13.50
1H
10.30
7.89
6.86
6.00
4.00
1.65 2.35 2.52 2.75
0.9
2005 2006 2007 2008 2009 2010 2011 2012 2013 2014 2015 2016 2017 2018 2019
Committed to increasing shareholder returns
(1) Dividend payout is adjusted for non-recurring items and items not related to core activities
✔ Energy Affordability ✔ Energy Security ✔ Energy Sustainability 30Disclaimer – Forward Looking Statement
Matters discussed in this presentation may constitute forward-looking statements. Forward-looking statements include statements concerning plans, objectives, goals, strategies, future
events or performance, and underlying assumptions and other statements, which are other than statements of historical facts. The words "believe," "expect," "anticipate," "intends,"
"estimate," "forecast," "project," "will," "may," "should" and similar expressions identify forward-looking statements. Forward-looking statements include statements regarding: strategies,
outlook and growth prospects; future plans and potential for future growth; liquidity, capital resources and capital expenditures; growth in demand for our products; economic outlook and
industry trends; developments of our markets; the impact of regulatory initiatives; and the strength of our competitors.
The forward-looking statements in this presentation are based upon various assumptions, many of which are based, in turn, upon further assumptions, including without limitation,
management's examination of historical operating trends, data contained in our records and other data available from third parties. Although we believe that these assumptions were
reasonable when made, these assumptions are inherently subject to significant uncertainties and contingencies which are difficult or impossible to predict and are beyond our control and
we may not achieve or accomplish these expectations, beliefs or projections. In addition, important factors that, in our view, could cause actual results to differ materially from those
discussed in the forward-looking statements include:
changes in the balance of oil and gas supply and demand in Russia, Europe, and Asia;
the effects of domestic and international oil and gas price volatility and changes in regulatory conditions, including prices and taxes;
the effects of competition in the domestic and export oil and gas markets;
our ability to successfully implement any of our business strategies;
the impact of our expansion on our revenue potential, cost basis and margins;
our ability to produce target volumes in the event, among other factors, of restrictions on the Company access to transportation infrastructure;
the effects of changes to our capital expenditure projections on the growth of our production;
inherent uncertainties in interpreting geophysical data;
commercial negotiations regarding oil and gas sales contracts;
changes to project schedules and estimated completion dates;
potentially lower production levels in the future than currently estimated by our management and/or independent petroleum reservoir engineers;
our ability to service our existing indebtedness;
our ability to fund our future operations and capital needs through borrowing or otherwise;
our success in identifying and managing risks to our businesses;
our ability to obtain necessary regulatory approvals for our businesses;
the effects of changes to the Russian legal framework concerning currently held and any newly acquired oil and gas production licenses;
changes in political, social, legal or economic conditions in Russia and the CIS;
the effects of, and changes in, the policies of the government of the Russian Federation, including the President and his administration, the Prime Minister, the Cabinet and the
Prosecutor General and his office;
the effects of international political events, including changes in the foreign countries’ and their governments’ policy towards the Russian Federation and Russian companies;
the effects of technological changes;
the effects of changes in accounting standards or practices; and
inflation, interest rate and exchange rate fluctuations.
This list of important factors is not exhaustive. When relying on forward-looking statements, you should carefully consider the foregoing factors and other uncertainties and events,
especially in light of the political, economic, social and legal environment in which we operate. Such forward-looking statements speak only as of the date on which they are made.
Accordingly, we do not undertake any obligation to update or revise any of them, whether as a result of new information, future events or otherwise.
We do not make any representation, warranty or prediction that the results anticipated by such forward-looking statements will be achieved, and such forward-looking statements represent,
in each case, only one of many possible scenarios and should not be viewed as the most likely or standard scenario.
The information and opinions contained in this document are provided as at the date of this review and are subject to change without notice. In order to avoid inconsistency, any person who
made themselves acquainted with any information provided in this presentation shall rely on their own analysis of factors and figures that may be related to or may be linked with the facts,
phenomena or events described, and shall be guided by their own conclusions when making any decisions, including whether any investments are justified or not. By participating in this
presentation or by accepting any copy of this document, you agree to be bound by the foregoing limitations.You can also read