CO2 Monitoring and Capnometry - Clinical examples - Application guide - gehealthcare.com - Clinical View
←
→
Page content transcription
If your browser does not render page correctly, please read the page content below
Application guide

                    CO2 Monitoring
                   and Capnometry
                         Clinical examples

gehealthcare.com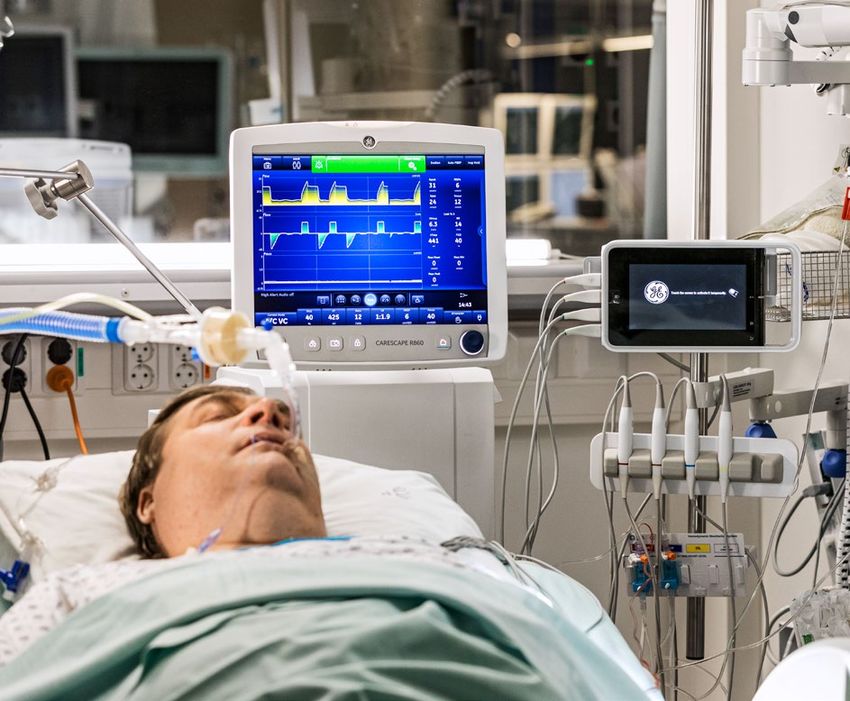
Table of contents
                                               Response time of various
                                                                                     CO2 Production, Transport
 1   Capnometry                            2   parameters to respiration-       3    and Elimination
                                               related mishaps

                                                                                     Normal Ventilation-/
 4   Using ETCO2 to Control Ventilation    5   Differences in ventilation        6   Perfusion Ratio

 7   Ventilation-Perfusion Mismatch        8   Normal capnogram                 9    Definitions

10   Benefits of normoventilation         11   Hypocapnia/Hyperventilation      12   Hypercapnia/Hypoventilation

                                                                                     Cardiac arrest and resuscitation,
13   Rebreathing                          14   Esophageal intubation            15   sudden fall to zero

     Vasopressors, bicarbonate,
16   tourniquet                           17   Efforts of spontaneous breaths   18   Partially obstructed airway

     Sudden disappearance
19   of CO2 waveform                      20   Sudden decrease of ETCO2         21   Cardiogenic Oscillations

22   Sample flow rate effect              23   Clinical benefits                24   Suggested reading

                                                            2
Capnometry
    Easy way to follow ventilation, circulation and metabolism

Systemic circulation

    Metabolism
                                                                                                                         Ventilator settings

Pulmonary circulation
                                                                                                                           Fresh gas flow

  Lung mechanics

   Gas exchange

    Some specific benefits of CO2 monitoring:
     • Continuous                            • Rapid verification of endotracheal intubation   • May help reduce the need for frequent
     • Non-invasive                          • Quick detection of problems in the airway or      blood gas analyses, since EtCO2 trends
     • Easy                                    malfunction of the ventilator or gas supply       approximate the changes in PaCO2
     • May help prevent ventilator related   • Objective, continuous and non-invasive
       mishaps                                 indicator of adequacy of ventilation
     • Follow-up of optimized ventilation    • Disturbances in gas exchange, circulation
                                               and metabolism may be easily recognized

                                                                      1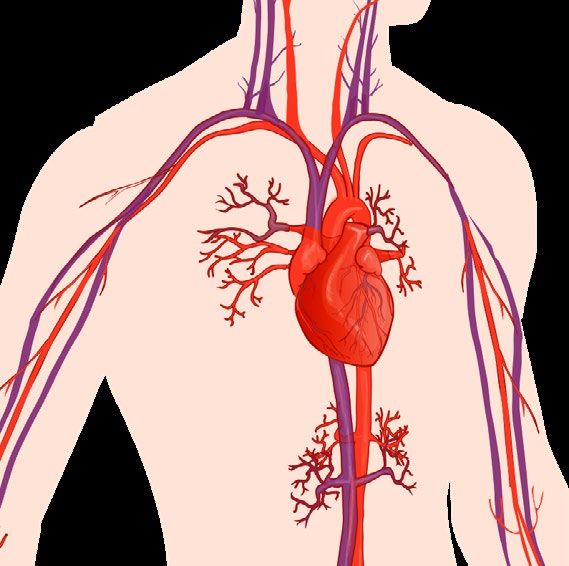
Response time of various parameters to
respiration-related mishaps
That table* shows how fast detector both EtCO2 and Fi-EtO2 are in several critical situations. Even SpO2 is widely used, its response
time is much slower than airway gases. SpO2 is measured on the peripheral site and EtCO2 represents the alveolar values.

                       Esophageal                                      Sudden               Sudden cirquit                                     Malignant
                                             Disconnection                                                             Embolism
                       intubation                                  hyperventilation            hypoxia                                       hyperthermia

 FiO2

 EtO2

 Fi-EtO2

 EtCO2

 SpO2

Response time:                     Fast
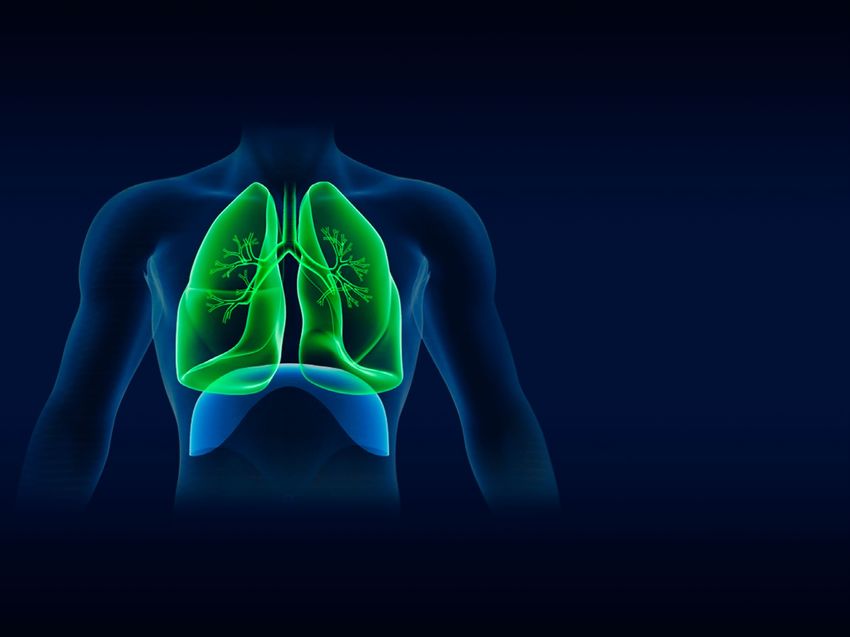
CO2 production, transport and elimination
              Oxidation of Glucose is an essential part of the energy metabolism and CO2 is a waste product
              which must be continually removed. From the cells carbon dioxide diffuses into the capillary
              blood and subsequently to the venous circulation returning blood from the periphery to the
              right side of the heart. When the heart contracts, the mixed venous blood is pumped through
              the pulmonary circulation to the lungs for gas exchange. The exhalation phase of breathing
              eliminates CO2 from the body. Although the lungs are by no means emptied, the final part of the
              exhaled gas is almost pure alveolar gas.
                                                                                                                Ventilation eliminates CO2

                              CO2 is a by product
                                                                                                      Sample to
                              of cell metabolism
                                                                                                     CO2 monitor

                         Oxygen into        Carbon dioxide
                       red blood cells      into alveolus
From pulmonary arter                                         monary vein
                       y                                  pul
                                                       To
                                     O2   CO2

                                CO2 diffuses into                          Circulation transports                     CO2 diffuses
                                 capillary blood                              CO2 to the lungs                       into the alveoli

                                                                                     3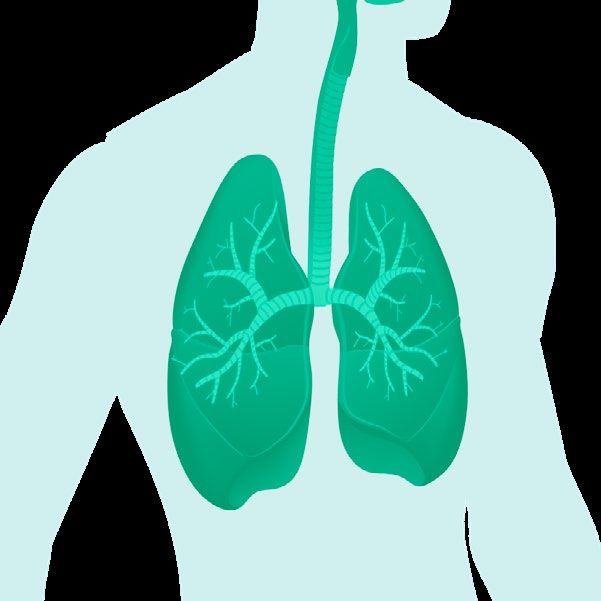
Using EtCO2 to Control Ventilation
During spontaneous breathing, our respiratory center located in the brain, automatically regulates PaCO2
being close to 40 mmHg by increasing or decreasing the minute ventilation according to the metabolism.
During mechanical ventilation, the use of sedatives can negatively affect respiratory drive. In that case,
normoventilation cannot be adequately maintained without monitoring. In the presence of neuromuscular
blocking agents, spontaneous respiration ceases further illustrating the need for continuous monitoring of
ventilation.

      Spontaneous breathing                                                              Mechanical ventilation

                                           PaCO2                        ETCO2

         Respiratory drive                                                            Continuous ETCO2 monitoring
       maintains normocarbia                                                         reflects the adequacy of minute
                                                                                     ventilation proportional to CO2
                                                                                                production

                                                                    4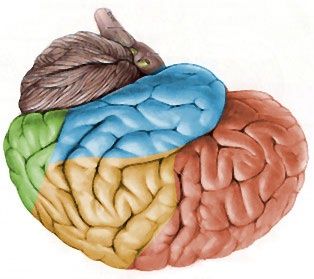
Differences in ventilation

Perioperative care                                       Intensive care

 •   Mostly planned operations                            •   Very complex & started at sub-opportune times
 •   Patient generally has healthy lungs                  •   Many different pathologies & traumas
 •   Patients are anesthetized and often paralyzed        •   Try to maintain spontaneous ventilation
 •   No work of breathing concerns                        •   Try to keep the work of breathing to a minimum
 •   Short-term monitoring

                                                     5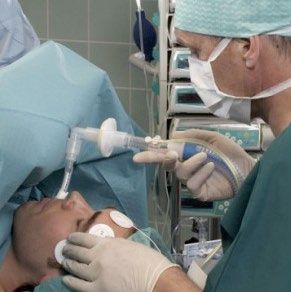
Normal ventilation/perfusion ratio
 No significant aACO2 difference
 In a healthy person with optimal ventilation-perfusion ratio aACO2 difference is 1-4 mmHg. The
 arterial-to-alveolar difference is due to a mismatch of ventilation and perfusion of the alveoli in
 the lungs. Even in healthy patients, there are some parts of the lungs which are not perfused as
 well as they are ventilated or vice versa.

                      Exhlaled CO2
                         32-36                           MIXED VENOUS BLOOD
                                                         from heart
                                                                                                                     SHUNT IS PRESENT
Mix-Venous mvCO2

                                                                                                       No O2 or CO 2 ex
       44

                                                               ALVEOLAR                O2                                                    O2                           ALVEOLAR
                                                                   UNIT 1                   CO2                                                      O2                   UNIT 2
                                                          + GAS EXCHANGE                                                                                                  ø GAS EXCHANGE

                                                                                                               ha       c
                                                                                                                    ng
                                                                                                                            f ro

                                                                                                                            e
                                                                                                                                   m
                                                                                                                                       alv                           ry
                                                                                                                                             e o l u s t o c a p illa
         Alveoli                        Alveoli
           38                             38
                                                                                                                                                                                to heart
                                                           CHANGE FROM NORMAL
                                                            PaO2          PaCO2
                                                            EtO2          EtCO2

                       Arterial CO2 (or PaCO2)              FiO2 — EtO2 gradient
                                 38

 a=arterial
 A=Alveolar

                                                                           6
Ventilation-perfusion mismatch
Increased aACO2 difference
Capnography provides continuous information on EtCO2, and when you compare the changes
to PaCO2 (BGA) you will follow the degree of ventilation-perfusion mismach and possibly reduce
frequency of blood gas analyses.

                  MIXED VENOUS BLOOD
                  from heart                                                                                                          Deadspace = area with
                                                                                 SHUNT IS PRESENT                                     ventilation but no perfusion
                                                                                                                                      Shunt = area with perfusion
                                                                                                                                      but no ventilation

                                                                   No O2 or CO 2 ex
                       ALVEOLAR                  O2                                                      O2                           ALVEOLAR
                           UNIT 1                     CO2                                                        O2                   UNIT 2
                   + GAS EXCHANGE                                                                                                     ø GAS EXCHANGE

                                                                           ha       c
                                                                                ng
                                                                                        f ro

                                                                                        e
                                                                                               m
                                                                                                   alv                           ry
                                                                                                         e o l u s t o c a p illa

                                                                                                                                              to heart
                    CHANGE FROM NORMAL
                    PaO2          PaCO2
                    EtO2          EtCO2
                    FiO2 — EtO2 gradient

Parts of the lungs may also be well-perfused but poorly                                     Main reasons for dead space ventilation are:
ventilated. Main reasons for shunt perfusion:                                               • Pulmonary thromboembolism
• Obstructed bronchi (mucus, foreign bodies, infection)                                     • Patient position (side lying)
• Unilateral endobronchial intubation                                                       • Pulmonary hypoperfusion
• Increased closing volume (diaphragm pushing against the lungs)

                                                                   7
Normal capnogram
A B C D ETCO2 5.2%, 40 mmHg or 5.2 kPa
5 A Gas coming from the dead space contains no CO2
B Mixture of gas from the dead space and alveoli is exhaled
% C Plateau indicates that all exhaled gas is from alveoli
D End-expiratory CO2 (ETCO2) reflects the CO2
0 concentration diffused by pressure gradient from
arterial blood to the alveoli
Inspiration Expiration Inspiration
The CO2 waveform is referred to as the capnogram and it reflects the different stages in breathing.
The capnogram is an important diagnostic tool because its shape is virtually identical in all basically healthy patients.
Any change in shape should be investigated.
EtCO2 represents the CO2 value at the end of expiration and this is typically displayed on the monitor screen.
8Definitions
5
%
time
0
Normocapnia EtCO2 4.0-6.0 vol % 35-45 mmHg
Hypocapnia EtCO2 less than 4.0 vol % 35 mmHg
Hypercapnia EtCO2 more than 6.0 vol % 45 mmHg
Common terms in CO2 monitoring: Units for measurement
• ”capno” means CO2 level in breath • vol % volume percentage
• ”hyper” means too much • mmHg partial pressure
• ”hypo” means too little • kPa kilopascal (partial pressure)
• ”carbia” refers to CO2 level in the blood 100 kPa=750 mmHg
1 vol % = 1 kPa
1 kPa = 7.5 mmHg
1 mmHg = 0.13 vol% (or kPa)
Alveolar minute ventilation is usually adjusted to achieve normocapnia, where EtCO2 is in the range 4.0-6. 0% (35-45 mmHg)
9Benefits of normoventilation
• Maintains normal physiology
• Maintains normal cerebral perfusion1
• Spontaneous breathing reappears easily
6 short uneventful recovery
With normoventilation, disturbances in ventilation, circulation and metabolism can be more easily recognized
and monitoring enables to maintain the physiologically optimal minute ventilation. Spontaneous breathing
can be instituted more easily by allowing the EtCO2 rise at the end of the anesthesia and patient usually
experiences a more rapid recovery.
During lengthy anesthesia, there is typically a very gradual decrease in EtCO2 due to the depressant effect of
anesthetic agents and the effect of hypothermia slowing the patient’s metabolism.
1 Z. Kalenda, Mastering Infrared Capnography, p48, 1989
10Hypocapnia/Hyperventilation2
CO2
40
mmHg
ET 34 RR
0
FI 0.0 12 /min
time
An ETCO2 level lower than normal, less than 4.0 % (34 mmHg), is called hypocapnia.
Possible reasons: In anesthesia the common cause of hypocapnia is too high alveolar ventilation
• Hyperventilation (hyperventilation)
• Decreased cardiac output In recovery or ICU hypocapnia in the spontaneously breathing patient may be result of
• Decreased metabolism hyperventilation due to fear, pain, failed weaning attempt or shock (circulatory failure)
• Hypothermia Disadvantages of prolonged hyperventilation:
• Vasoconstriction leading to decreased coronary and cerebral blood flow
• Unnecessary respiratory alkalosis
• Depression of respiratory center
In specific cases there is an advantage in hyperventilating the patient. For example, in neuroanesthesia hypocarbia is used
to deliberately reduce cerebral perfusion and intraacranial pressure.
2 https://www.jems.com/2017/08/01/how-to-read-and-interpret-end-tidal-capnography-waveforms/
https://www.capnography.com/
11Hypercapnia/Hypoventilation2
5
%
time
0
An ETCO2 level higher than normal, more than 6.0 % (45 mmHg), is called hypercapnia.
Possible reasons:
Hypoventilation
A. Spontaneous respiration • Ventilator dysfunction
• Depression of respiratory center • Mismanagement of artificial ventilation
• Mechanical disturbances (muscle paresis, hemo/ • Rebreathing
pneumothorax, airway obstruction • Permissive hypercapnia
B. Artificial ventilation • Circulatory insufficiency
• Altered V/Q ratio
• Airway obstruction
• Increased metabolism (e.g. burn patients)
• Pneumothorax
• Bicarbonate infusion
• Leak
• Compensated metabolic alkalosis depression of
• Disconnection respiratory center
• Over-feeding (excess calorie intake)
2 https://www.jems.com/2017/08/01/how-to-read-and-interpret-end-tidal-capnography-waveforms/
https://www.capnography.com/
12Rebreathing2
37
mmHg
time
0
Failure of the capnogram to return to the baseline may indicate rebreathing of the exhaled CO2. This can be an
inherent feature of the anesthesia delivery system (for example with Mapleson type of breathing systems) or it may
be due to an exhausted CO2 absorber in a circle system. Finally, it may also be due to inadequate fresh gas flow given
to the patient as set in the ventilator.
Monitoring FiO2 is the best method to determine the optimal fresh gas flow. Ref. Text book:
Understanding Anesthesia equipment. 5th edition. 2008 by Lippincott Williams & Wilkins
If expiratory time is too short for CO2 curve to represent the EtCO2 value, the next inspiration will
contain CO2 which can be seen as a rise in the baseline.
2 https://www.jems.com/2017/08/01/how-to-read-and-interpret-end-tidal-capnography-waveforms/
https://www.capnography.com/
13Esophageal intubation2
5
%
time
0
If intubation is difficult i.e. vocal cords are not visible, it may happen that the ET-tube is inserted accidentally into the
esophagus. If this is not detected immediately the patient will die. The best indicator for early detection is capnometry.
Some CO2 may be detected due to gas entering the stomach during manual ventilation. After removal of the endotracheal
tube and successful re-intubation, high EtCO2 values are recorded because of CO2 accumulation during apnea.
American Heart Association (AHA) recommends to use capnography to confirm the correct positioning of the ET-tube as
well as in confirmation of the effectiveness of chest compressions during CPR.
2 https://www.jems.com/2017/08/01/how-to-read-and-interpret-end-tidal-capnography-waveforms/
https://www.capnography.com/
14Cardiac arrest and resuscitation, sudden fall to zero2
5
%
time
0
EtCO2 monitoring provides a continuous information in detecting return of spontaneous circulation during
cardiac resuscitation.
American Heart Association (AHA) recommends to use capnography to confirm the correct positioning of the
ET-tube as well as in confirmation of the effectiveness of chest compressions during CPR.
2 https://www.jems.com/2017/08/01/how-to-read-and-interpret-end-tidal-capnography-waveforms/
https://www.capnography.com/
15Vasopressors, bicarbonate, tourniquet2
5
%
time
0
Sudden but transient rise in ETCO2 while inspired CO2 remains zero may be due to the release of a
tourniquet or infusion of bicarbonate.
Some orthopedic operations are performed using tourniquet in order to get the surgical field bloodless.
The use of tourniquet will lead to ischemic reaction in the limb and after the release of tourniquet the
acidotic substance will be released into the circulation. This effect can be seen as transient rise in ETCO2.
2 https://www.jems.com/2017/08/01/how-to-read-and-interpret-end-tidal-capnography-waveforms/
https://www.capnography.com/
16Efforts of spontaneous breaths2
5
%
time
0
Efforts of spontaneous breaths can be seen as a “camel” capnogram
Insufficient muscular relaxation and/or inadequate depth of anesthesia are allowing the patient ”fight” against the
mechanical ventilation. These shallow, efforts of spontaneous breaths can be seen as clefts on the capnogram plateau.
2 https://www.jems.com/2017/08/01/how-to-read-and-interpret-end-tidal-capnography-waveforms/
https://www.capnography.com/
17Partially obstructed airway2
5
%
time
0
A deformed capnogram, with a slowly rising leading edge, may indicate a partial obstruction of the airway.
Possible causes:
• Secretions
• Bronchospasm
• Kink of ET-tube
2 https://www.jems.com/2017/08/01/how-to-read-and-interpret-end-tidal-capnography-waveforms/
https://www.capnography.com/
18Sudden disappearance of CO2 waveform2
5
%
time
0
If the CO2 waveform is normal but then drops to zero from one breath to the next.
Possible reasons:
• Ventilator disconnection
• Totally obstructed ET-tube
• Gas sampling line disconnected
• Cardiac arrest
2 https://www.jems.com/2017/08/01/how-to-read-and-interpret-end-tidal-capnography-waveforms/
https://www.capnography.com/
19Sudden decrease of ETCO2*
5
%
time
0
5
%
time
0
A rapid fall in ETCO2 over a period of several breaths may indicate:
• Pulmonary embolism
• Cardiac arrest
• Severe hypotension (massive bleeding)
• Leak in sampling system
* https://www.jems.com/2017/08/01/how-to-read-and-interpret-end-tidal-capnography-waveforms/
https://www.capnography.com/
20Cardiogenic oscillations*
5
%
time
0
Cardiogenic oscillations in the expiratory CO2 wave are caused by thoracic gas movements
resulting from cardiac contractions during side stream gas sampling.
Possible reasons:
• Continuous gas flow fed directly into the inspiratory limb
• Side stream gas sampling taken at the Y-peace
• Slow respiration rate
• Long expiration time
* https://www.jems.com/2017/08/01/how-to-read-and-interpret-end-tidal-capnography-waveforms/
https://www.capnography.com/
21Sample flow rate effect Note: You can change the sample
flow/min and I:E ratio values
• Table presents different sampling volumes depending on respiration rate to see how the sampled gas is
• The I:E ratio is assumed to be 1:2 distributed per breathing cycle.
Gas volumes sampled during inspiration and expiration phases of a single breath depends on respiratory rate and I:E ratio.
Input the values of sample flow (V mL/min), inspiratory and expiratory ratio (I:E) to see sample flow rate effect.
Sample flow V (ml/min) = 120
I:E Ratio I= 1 E= 2
Respiration Rate Duration of inspiration Duration of expiration Gas sampled during Gas sampled during
[breath/min] [second] [second] inspiration [ml] expiration [ml]
10 2.0 4.0 4.0 8.0
20 1.0 2.0 2.0 4.0
30 0.7 1.3 1.3 2.7
40 0.5 1.0 1.0 2.0
50 0.4 0.8 0.8 1.6
60 0.3 0.7 0.7 1.3
70 0.3 0.6 0.6 1.1
80 0.3 0.5 0.5 1.0
90 0.2 0.4 0.4 0.9
100 0.2 0.4 0.4 0.8
110 0.2 0.4 0.4 0.7
120 0.2 0.3 0.3 0.7
The effect of the sample flow rate by the side stream analyzer is seen in the table. The amount of gas drawn by the
monitor is dependent on the respiratory rate. When the respiratory rate increases the sample gas will decrease by breath.
Also the total volume sampled is devided between the inspiration and expiration.
Example: with a respiration of 30, which may be common for small babies, the total volume sampled is 4 ml only,
where 1,3 ml is drawn during the inspiration. This makes the 120 ml flow rate suitable for small babies as well.
22Clinical benefits
Patient safety
• Confirms the correct place of ET-tube
• Continuous measurement to detect hyperventilation or
hypoventilation quickly
• Estimation of increased/decreased shunt
• ETCO2 trend vs PaCO2
Optimal minute ventilation=normoventilation
23Suggested reading
J. S. Gravenstein, M. B. Jaffe, N. Gravenstein, D. A. Paulus: Capnography. Text book
www.capnography.com
Capnography, Second Edition, Anesthesiology 3 2012, Vol.116, 744-745.
Rationales and Applications for Capnography, Monitoring During Sedation, Devin Carr, MSN, MS, RN,
RRT, ACNS-BC, NEA-BC, CPPS and Anna Cartwright, BSN; RNClinicalfoundations.org
End-Tidal Capnography
Updated: Jan 17, 2020.
Author: Robert Thomas Arrigo, MD, MS; Chief Editor: Zab Mosenifar, MD, FACP, FCCP
How to Read and Interpret End-Tidal Capnography Waveforms
For additional clinical resources, please visit clinicalview.gehealthcare.com
© 1981 - 2021 General Electric Company - All rights reserved.
GE and the GE monogram are trademarks of General Electric Company.
JB35961XX_JB16327XX 7/2021
24You can also read