Abraxas Petroleum Corporation January 2019 - Abraxas Caprito 98 #201H; Ward Cty., TX
←
→
Page content transcription
If your browser does not render page correctly, please read the page content below
Abraxas Caprito 98 #201H; Ward Cty., TX

                                          Abraxas Petroleum Corporation
                                                           January 2019
Forward‐Looking Statements

The information presented herein may contain predictions, estimates and other forward‐looking statements within the meaning of Section 27A of the
Securities Act of 1933 and Section 21E of the Securities Exchange Act of 1934. Although the Company believes that its expectations are based on
reasonable assumptions, it can give no assurance that its goals will be achieved.

Important factors that could cause actual results to differ materially from those included in the forward‐looking statements include the timing and
extent of changes in commodity prices for oil and gas, availability of capital, the need to develop and replace reserves, environmental risks, competition,
government regulation and the ability of the Company to meet its stated business goals.

Oil and Gas Reserves. The SEC permits oil and natural gas companies, in their SEC filings, to disclose only reserves anticipated to be economically
producible, as of a given date, by application of development projects to known accumulations. We use certain terms in this presentation, such as total
potential, de‐risked, and EUR (expected ultimate recovery), that the SEC’s guidelines strictly prohibit us from using in our SEC filings. These terms
represent our internal estimates of volumes of oil and natural gas that are not proved reserves but are potentially recoverable through exploratory
drilling or additional drilling or recovery techniques and are not intended to correspond to probable or possible reserves as defined by SEC regulations.
By their nature these estimates are more speculative than proved, probable or possible reserves and subject to greater risk they will not be realized.

Non‐GAAP Measures. Included in this presentation are certain non‐GAAP financial measures as defined under SEC Regulation G. Investors are urged to
consider closely the disclosure in the Company’s Annual Report on Form 10‐K for the fiscal year ended December 31, 2017 and its subsequently filed
Quarterly Reports on Form 10‐Q and Current Reports on Form 8‐K and the reconciliation to GAAP measures provided in this presentation.

Initial production, or IP, rates, for both our wells and for those wells that are located near our properties, are limited data points in each well’s
productive history. These rates are sometimes actual rates and sometimes extrapolated or normalized rates. As such, the rates for a particular well may
change as additional data becomes available. Peak production rates are not necessarily indicative or predictive of future production rates, expected
ultimate recovery, or EUR, or economic rates of return from such wells and should not be relied upon for such purpose. Equally, the way we calculate
and report peak IP rates and the methodologies employed by others may not be consistent, and thus the values reported may not be directly and
meaningfully comparable. Lateral lengths described are indicative only. Actual completed lateral lengths depend on various considerations such as lease‐
line offsets. Standard length laterals, sometimes referred to as 5,000 foot laterals, are laterals with completed length generally between 4,000 feet and
5,500 feet. Mid‐length laterals, sometimes referred to as 7,500 foot laterals, are laterals with completed length generally between 6,500 feet and 8,000
feet. Long laterals, sometimes referred to as 10,000 foot laterals, are laterals with completed length generally longer than 8,000 feet.

                                                                                                                                                              2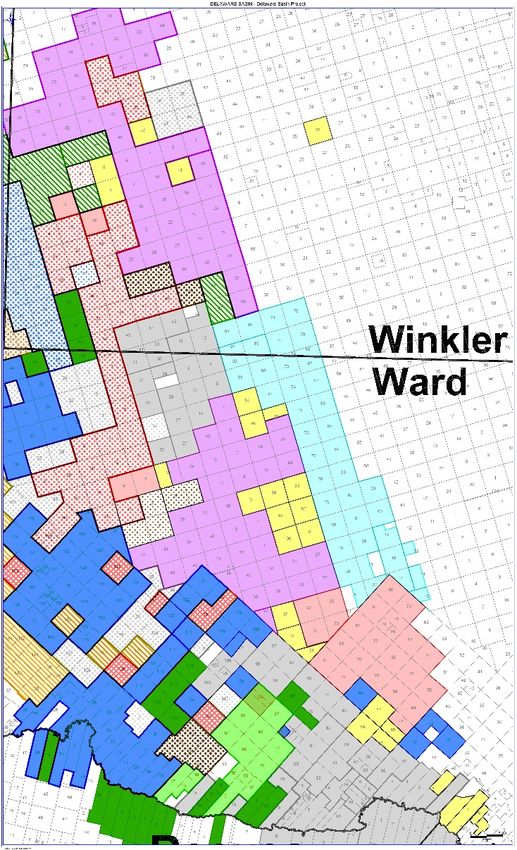
Corporate Profile

       NASDAQ: AXAS

       Headquarters.......................... San Antonio                                                                                         EV/BOE(1,3)…..……………………….                                                                                  $8.15

       Shares outstanding(1)…….........                                                         166.6 mm                                          Proved Reserves(4)………………..                                                                61.6 mmboe

       Market cap(1) ……………………....                                                                $200 mm                                          NBV Non‐Oil & Gas Assets(5)…                                                                    $20.8 mm

       Net debt(2)…………………………….                                                                   $146 mm                                          Production(6).……………………….. 11,427 boepd

       2019E CAPEX………………………..                                                                       $95 mm                                        PV‐10(7)………………………………….                                                                                    $557.6

 (1)   Shares outstanding as of October 31, 2018. Market cap using share price as of January 24, 2019.
 (2)   Total net debt including RBL facility and building mortgage less estimated cash as of September 30, 2018.
 (3)   Enterprise value includes working capital deficit (excluding current hedging assets and liabilities) as of October 31, 2018, but does not include building mortgage. Includes RBL facility and building mortgage less cash as of October 31, 2018.
 (4)   Internally estimated Proved reserves as of June 30, 2018.
 (5)   Net book value of other assets as of October 31, 2018.
 (6)   December 2018 average daily net sales.
 (7)   PV‐10 calculated using SEC pricing of $57.50/bbl of oil and $2.90/mcf of natural gas.
                                                                                                                                                                                                                                                                     3
2019 Operating and Financial Guidance

                     2019 Capex Budget Allocation                                                                                            2019 Operating Guidance
                                              Capital         % of           Gross          Net                                                                            Low                High
 Area                                                                                                                         Operating Costs
                                              ($MM)           Total          Wells          Wells                                                                          Case               Case
 Permian ‐ Delaware                           $46.2          48.8%            7.0               6.7                           LOE ($/BOE)                                 $4.00           $6.00
 Bakken/Three Forks                            38.3          40.5%           10.0               5.2
                                                                                                                              Production Tax (% Rev)                       8.0%           9.0%
 Acquisitions/Facilities/Other                 10.1          10.6%            0.0               0.0
                                                                                                                              Cash G&A ($mm)                               $8.5           $12.5
 Total                                        $94.5          100%            17.0               11.9
                                                                                                                              Production (boepd)                          10,500          11,500

                            Daily Production vs Yearly CAPEX (1)                                                                                         2019 Expected Production Mix
12,000                                                                                     $180,000
                                                                                                                                                   14%
                                                                                           $160,000
10,000
                                                                                           $140,000
 8,000                                                                                     $120,000
                                                                                           $100,000
 6,000
                                                                                           $80,000                                           17%
 4,000                                                                                     $60,000
                                                                                                                                                                                        69%
                                                                                           $40,000
 2,000
                                                                                           $20,000
       0                                                                                   $‐
                                                                               2019E (2)
                   2015A

                                  2016A

                                                 2017A

                                                                2018A

                                                                                                                                                              Oil   Gas   NGL

 (1)       Yearly CAPEX for each year ending December 31, 2015, 2016, 2015, 2017 and 2018. 2019 based on midpoint of management guidance.
 (2)       Average estimated production for 2019 based on the midpoint of management guidance.
                                                                                                                                                                                                     4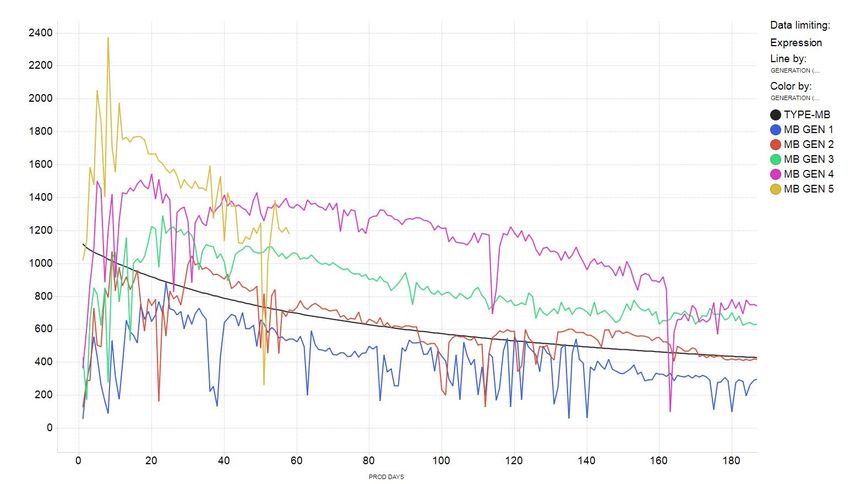
The Abraxas Advantage
Capital Structure Benefit
▫ RBL represents only meaningful form of leverage, no other balance sheet dilutives
▫ Recently increased to $200MM
▫ Provides ample liquidity to carry out current development plan and operate within cash flow
Basin / Geologic Benefit
▫ Core acreage positions in the Bakken and WTX (Delaware Basin)
▫ Growing footprint of ~ 11,000 net mineral acres in WTX (95% Operated, predominately HBP)
▫ ~68% of current volumes not exposed to WTX oil differentials
▫ Deep inventory of high quality locations in WTX providing 15 years of development with 2 rigs (1)
Royalty / Leasehold Benefit
▫ Legacy high value acreage with favorable NRI’s
▫ Recent Permian and Bakken precedent M&A transactions carry a 25% royalty burden (75% Effective NRI)
▫ AXAS Bakken Effective NRI’s average ~82.5%, WTX ~80% providing meaningful minerals optionality
Commodity Benefit
▫ 67% of production from black oil, 81% from liquids
▫ Imbedded hedge against current and forecasted depressed natural gas prices
Infrastructure Benefit
▫ Expanding network of in‐field SWD’s, frac‐ponds, gathering and other infrastructure in place
▫ Company owned & operated Ravin #1 Drilling Rig well suited and targeted for future WTX development
▫ Provides significant infrastructure optionality
(1) Assumes 1,320’ spacing per 640 acre DSU
5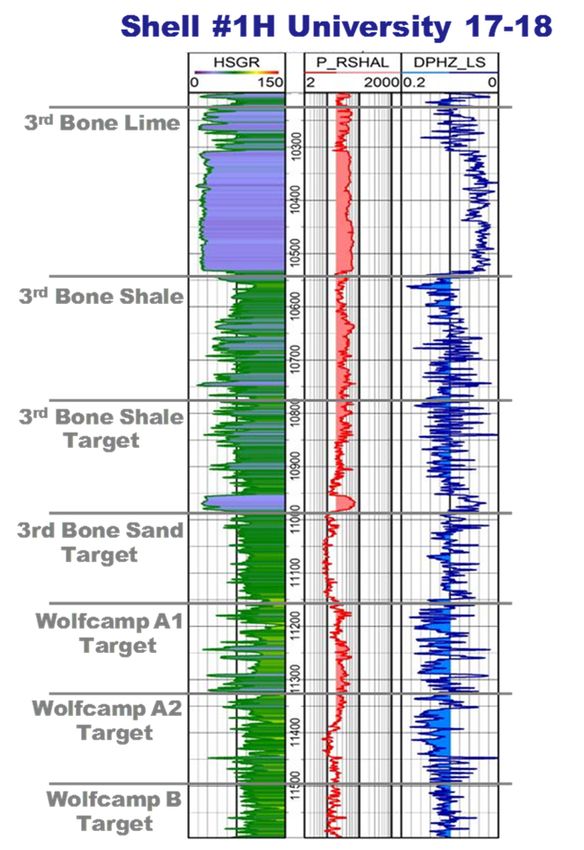
Asset Base Overview

                      6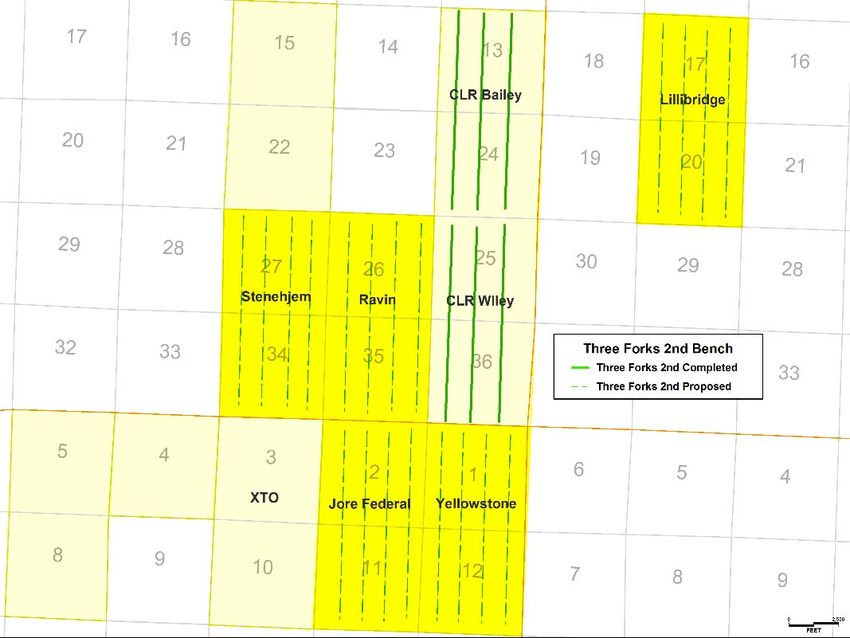
Delaware Basin
Permian Basin – Wolfcamp & Bone Spring

  Map Source: Investor presentations, Drilling Info and management estimates.

                                                                                7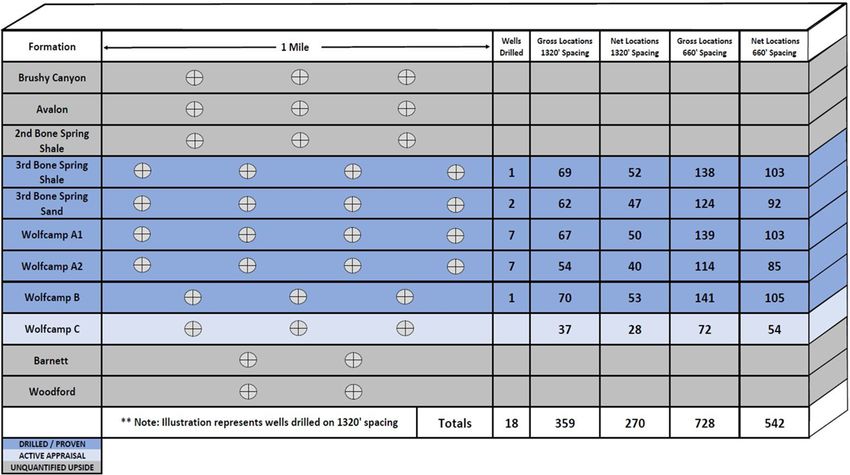
Delaware Basin Inventory
Abraxas has identified 270 net potential drilling locations assuming 1,320’ (160‐acre spacing), and 542 net potential locations
assuming 660’ (80‐acre) spacing per 1 mile DSU across our leasehold (1)
Approximately 32% of these locations could be combined in the future for long lateral development should conditions warrant
Abraxas believes this location count is conservative as no locations have been assigned to benches that AXAS has not
commercially proven
(1) Totals include 33 non‐operated locations on 1,320’ (160‐acre) spacing, and 68 non‐operated locations on 660’ (80‐acre) spacing
8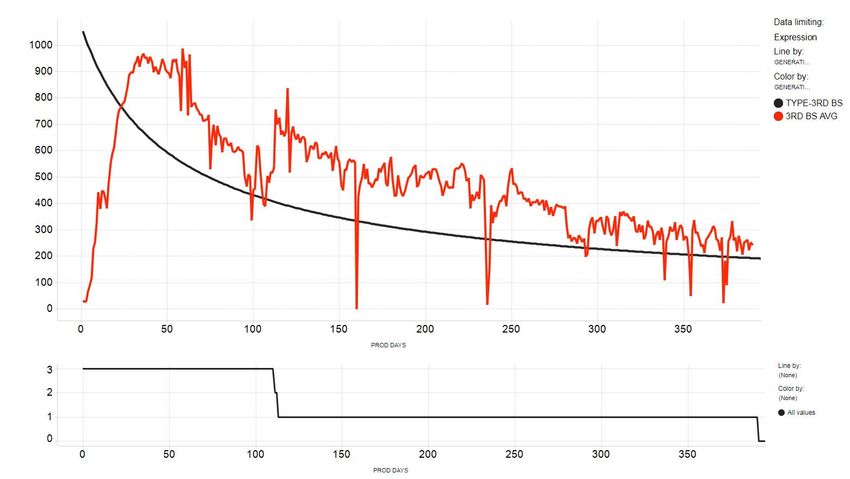
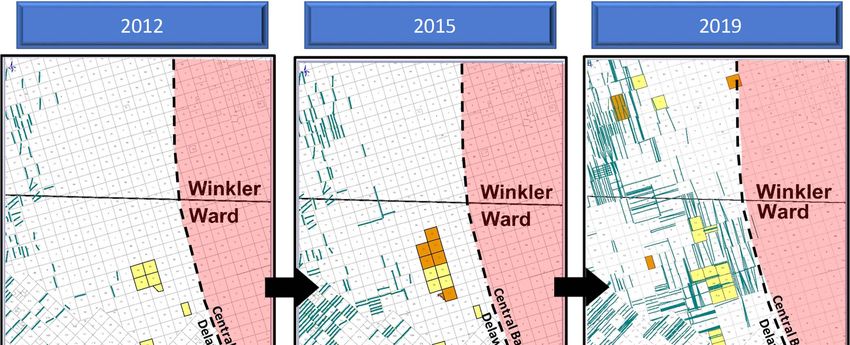
Evolution in the Delaware Basin

                                  9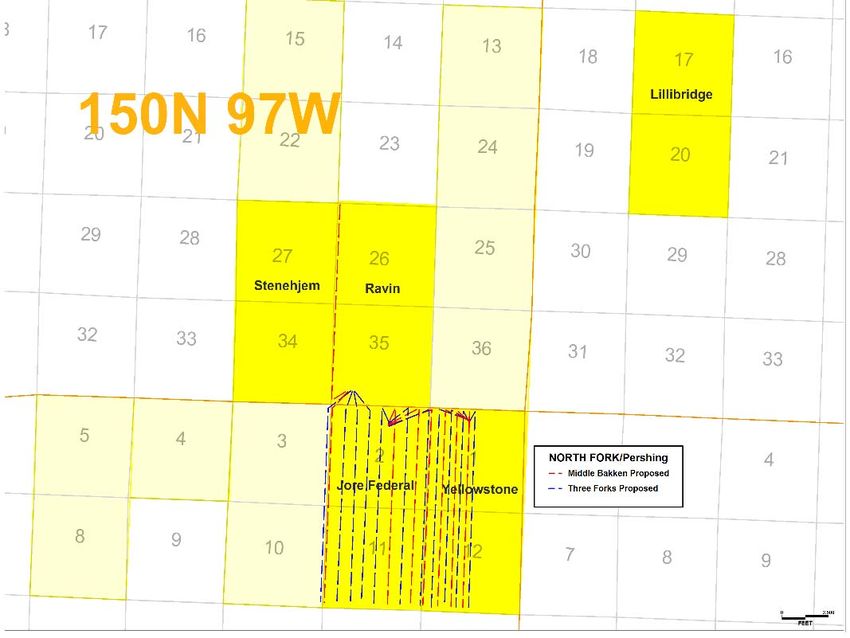
Recent WTX M&A relative to AXAS leasehold
A&D Market Update | Delaware A&D Transactions Heat Map (1)
Chaves
Chaves Gaines
Gaines Dawson
Dawson
Eddy
Eddy Lea
Lea CONCHO / RSP
$103K / Acre
$1.7MM / Location
Andrews
Andrews Martin
Martin
Otero
Otero
Delaware Basin OAS / FORGE
$46K / Acre
$1.6MM / Location
BP / BHP
$35K / Acre Ector
Ector Midland
Midland
Loving
Loving Winkler
Winkler
$1.3MM / Location
CIMAREX / RESOLUTE
$25K / Acre
$1.2MM / Location
Ward
Ward
Culberson
Culberson Crane
Crane
FANG / ENERGEN
HudspethFANG / ENERGEN
Hudspeth Upton
Upton
$51K / Acre HALCON / BTA
$1.5MM / Location Reeves
Reeves $23K / Acre
$2.3MM / Location
$K/Acre
LTM
Crockett
Crockett
$50
1. Source: Detring Energy Advisors and PLS M&A database. Acreage metrics exclude estimated PDP value.
10Delaware Basin
Caprito Development
1 mile
= Original 15 wells @ 1320’ spacing
= Additional 15 wells @ 660’ down spacing
11Delaware Basin – 3rd Bone Spring
3rd Bone Spring Average vs. Type
BOE/D
WELL COUNT
DAYS
12Delaware Basin – Wolfcamp A1
Wolfcamp A1 Average vs. Type
BOE/D
WELL COUNT
DAYS
13Delaware Basin – Wolfcamp A2
Wolfcamp A2 Average vs. Type
BOE/D
WELL COUNT
DAYS
14Delaware Basin – Wolfcamp B
Wolfcamp B Average vs. Type
BOE/D
WELL COUNT
DAYS
15Delaware Basin
Economics by Zone ‐ EOY17 Model
Third Bone Spring Wolfcamp A1 Wolfcamp A2 Wolfcamp B
Abraxas EOY17 Assumptions Abraxas EOY17 Assumptions Abraxas EOY17 Assumptions Abraxas EOY17 Assumptions
630 MBOE gross type curve 650 MBOE gross type curve 620 MBOE gross type curve 535 MBOE gross type curve
▫ 84% Oil ▫ 82% Oil ▫ 77% Oil ▫ 85% Oil
▫ Initial rate: 1,100 boepd ▫ Initial rate: 690 boepd ▫ Initial rate: 650 boepd ▫ Initial rate: 580 boepd
▫ di: 99.9% ▫ di: 95.0% ▫ di: 95.0% ▫ di: 95.0%
▫ dm: 6.0% ▫ dm: 7.0% ▫ dm: 7.0% ▫ dm: 7.0%
▫ b‐factor: 1.4 ▫ b‐factor: 1.4 ▫ b‐factor: 1.4 ▫ b‐factor: 1.4
Assumed CWC: $7.3 million Assumed CWC: $7.3 million Assumed CWC: $7.3 million Assumed CWC: $7.3 million
ROR vs. WTI ROR vs. WTI ROR vs. WTI ROR vs. WTI
16Bakken/Three Forks
Bakken / Three Forks (McKenzie Cty., ND)
Asset Highlights:
~ 4,000 net acres in the heart of McKenzie Cty. LILLIBRIDGE
63 wells drilled by Abraxas (34MB / 29TF1)
59 completions, 4 DUC’s (Lillibridge DSU)
Cum Production ~ 10.5 MMbo / 14.9 MMboe
Current Net Production ~ 7,000 boepd
STENEHJEM RAVIN
Remaining Locations:
39 (8MB / 11TF1 / 20TF2)
Refrac Candidates ~ 20
JORE FEDERAL YELLOWSTONE
17Bakken/Three Forks
Remaining Inventory
Remaining Locations Three Forks 2nd Bench
(19 Total ‐ 8 MB, 11 TF1) (20 TF2 PUD’s booked)
• Jore Federal WI ~ 75% (3MB, 7TF1) • AXAS book type curve = 555 MBOE
• Yellowstone WI ~ 51.5% (4MB, 4TF1) • CLR results > 1,000 MBOE
• Ravin WI ~ 48.6% (1 MB) • AXAS spacing = 1,320’; CLR spacing = 990’
18Bakken Completion Evolution: 2010 ‐ 2019
Highlights –
Increase in prop mass and fluid volume
Increase in stages and adding diverters to drive cluster efficiency
Using thinner fluids to promote complexity
SPE #184851 “Re‐designing from Scratch and Defending Offset Wells: Case Study of a Six‐Well Bakken Zipper Project”
World Oil, June 2017 “From Scratch Redesign Yields Uplift in Legacy Bakken Field” 19Generational Uplift – Middle Bakken
North Fork Field
Middle Bakken Completion Generations vs. Type
BOEPD
DAYS
20Generational Uplift – Three Forks
North Fork Field
Three Forks Completion Generations vs. Type
BOEPD
DAYS
21Bakken System Economics
Economics by Zone ‐ EOY17 Model
Middle Bakken Three Forks
Abraxas EOY17 Assumptions Abraxas EOY17 Assumptions
880 MBOE gross type curve 785 MBOE gross type curve
▫ 76% Oil ▫ 73% Oil
▫ Initial rate: 1,120 boepd ▫ Initial rate: 1,050 boepd
▫ di: 98.5% ▫ di: 98.5%
▫ dm: 8.0% ▫ dm: 8.0%
▫ b‐factor: 1.5 ▫ b‐factor: 1.5
Assumed CWC: $7.0 million Assumed CWC: $7.0 million
ROR vs. WTI ROR vs. WTI
22Oil and Gas Marketing & Takeaway
Delaware Basin Bakken/Three Forks
Oil Marketing and Takeaway Caprito Area: North Fork/Pershing Area:
• Caprito oil production on pipe in May/June 2018 • All oil production on pipe
• Agreement with third party on long term contract • Agreement with third parties on long term contract
• Rate of $0.65/bbl to Wink • Locked discount (including all tariff) of $4.70‐$5.10 off NYMEX
• Wink trades at a slight discount to Midland through February 2019
• Abraxas will likely add other units to the third party system • Do not anticipate any issues with takeaway
as development progresses across the Company’s Ward and
Winkler County assets
Gas Marketing and Takeaway Delaware Basin: North Fork/Pershing Area:
• Majority of acreage dedicated on long term contract • Dedicated to third party on long term contract
• Contract pays 100% of residue gas and 100% of NGLs with • $2.50+ operating cost minimum margin per Mcfe (Abraxas
deductions for compression, gathering and processing cannot receive a negative price)
• Majority sells/prices at Waha • Additional takeaway issues likely until third party completes a
• Third party controls numerous processing facilities with an plant expansion in late 2019
additional facility online in 4Q2018 • Additional midstream options expanding into the area
• Third party has adequate capacity from Waha to Katy • Abraxas actively pursuing alternative gas marketing options
• Multiple sales outlets with ample capacity expected
• Operational downtime improving
Hedging Actively hedging basis as and when advantageous from a cost Difficult from a liquidity and contract standpoint to hedge basis in
perspective the area
23Abraxas Hedging Profile
2019 2020 2021
Oil Swaps (bbls/day) 2,941 2,204 1,815
(2)
Swap Price ($/Bbl) $ 56.20 $ 54.35 $ 60.32
Mid‐Cush Basis Swaps (bbls/day) 4,000 4,000 ‐
(3)
Swap Price ($/Bbl) $ (3.00) $ (3.00) $ ‐
(1) WTI ‐ straight line average price. Includes 3,993 Bopd and 1,941 Bopd of WTI swaps in 2018 and 2019, respectively. Includes 500 Bopd and 1,000 Bopd of LLS swaps in 2018 and 2019, respectively.
(2) Argus Midland – NYM WTI CMA Differential
24Appendix
25Adjusted EBITDA Reconciliation
Adjusted EBITDA is defined as net income plus interest expense, depreciation, depletion and amortization expenses, deferred income taxes and other non‐cash
items. The following table provides a reconciliation of Adjusted EBITDA to net income for the periods presented.
(In thousands) Year End
2016 2017
Net (loss) income ($96,378) $16,006
Net interest expense $3,827 $2,496
Depreciation, depletion and amortization $24,431 $26,226
Amortization of deferred financing fees $1,019 $423
Stock-based compensation $3,194 $3,238
Impairment $67,626 $0
Unrealized (gain) loss on derivative contracts $19,818 $4,299
Realized (gain) loss on monetized derivative contracts $14,370 $0
Expenses incurred with offerings and execution of loan agreement $1,747 $4,856
Other non-cash items $494 $451
Bank EBITDA $40,149 $57,994
Credit facility borrowings $93,250 $84,250
Debt/Bank EBITDA 2.32x 1.45x
26TTM Adjusted EBITDA Reconciliation
Adjusted EBITDA is defined as net income plus interest expense, depreciation, depletion and amortization expenses, deferred income taxes and other non‐cash
items. The following table provides a reconciliation of Adjusted EBITDA to net income for the periods presented.
(In thousands)
31‐Dec‐17 31‐Mar‐18 30‐Jun‐18 30‐Sep‐18 TTM
Net (loss) income ($4,109) $10,779 ($10,554) $1,777 ($2,107)
Net interest expense 959 1,198 1,493 1,952 5,602
Depreciation, depletion and amortization 8,560 10,130 8,705 11,011 38,406
Amortization of deferred financing fees 69 96 111 113 389
Stock‐based compensation 739 586 879 428 2,633
Impairment 0 0 0 0 0
Unrealized (gain) loss on derivative contracts 11,258 4,094 13,705 6,840 35,897
Realized (gain) loss on monetized derivative contracts 0 0 0 0 0
Expenses incurred with offerings and execution of loan agreement 164 202 10 105 481
Other non‐cash items 113 130 134 131 508
Bank EBITDA $17,753 $27,216 $14,483 $22,357 $81,810
Credit facility borrowings $146,000
Debt/Bank EBITDA 1.78x
27Standardized Measure Reconciliation
PV‐10 is the estimated present value of the future net revenues from our proved oil and gas reserves before income taxes discounted using a 10% discount
rate. PV‐10 is considered a non‐GAAP financial measure under SEC regulations because it does not include the effects of future income taxes, as is required in
computing the standardized measure of discounted future net cash flows. We believe that PV‐10 is an important measure that can be used to evaluate the
relative significance of our oil and gas properties and that PV‐10 is widely used by securities analysts and investors when evaluating oil and gas companies.
Because many factors that are unique to each individual company impact the amount of future income taxes to be paid, the use of a pre‐tax measure provides
greater comparability of assets when evaluating companies. We believe that most other companies in the oil and gas industry calculate PV‐10 on the same
basis. PV‐10 is computed on the same basis as the standardized measure of discounted future net cash flows but without deducting income taxes.
The following table provides a reconciliation of PV‐10 to the standardized measure of discounted future net cash flows at December 31, 2017:
Total Proved 31-Dec-17
($000)
Future cash inflows $2,035,619
Future production costs (609,921)
Future development costs (461,619)
Future income tax expense (83,915)
Present Worth at 10 Percent $880,164
Discount (474,423)
Standardized measure of discounted future net cash flows $405,741
28You can also read