Macquarie Australia Conference - 7 MAY 2020 - Beach Energy
←
→
Page content transcription
If your browser does not render page correctly, please read the page content below

7 M AY 2 0 2 0

Macquarie
Australia
Conference
Compliance statements

Disclaimer                                                                                                     Assumptions
This presentation contains forward looking statements that are subject to risk factors associated with oil,    FY20 guidance is uncertain and subject to change. FY20 guidance has been estimated on the basis of: 1.
gas and related businesses. It is believed that the expectations reflected in these statements are             actual results achieved in H1 FY20 and actual data to end February 2020, US$30/bbl Brent oil price and 0.60
reasonable but they may be affected by a variety of variables and changes in underlying assumptions            AUDUSD for March to June 2020; 2. various other economic and corporate assumptions; 3. assumptions
which could cause actual results or trends to differ materially, including, but not limited to: price          regarding drilling results; and 4. expected future development, appraisal and exploration projects being
fluctuations, actual demand, currency fluctuations, drilling and production results, reserve estimates, loss   delivered in accordance with their current expected project schedules.
of market, industry competition, environmental risks, physical risks, legislative, fiscal and regulatory       These future development, appraisal and exploration projects are subject to approvals such as government
developments, economic and financial market conditions in various countries and regions, political risks,      approvals, joint venture approvals and board approvals. Beach expresses no view as to whether all required
project delays or advancements, approvals and cost estimates.                                                  approvals will be obtained in accordance with current project schedules.

Underlying EBITDAX (earnings before interest, tax, depreciation, amortisation, evaluation, exploration
expenses and impairment adjustments), underlying EBITDA (earnings before interest, tax, depreciation,          Authorisation
amortisation, evaluation and impairment adjustments), underlying EBIT (earnings before interest, tax, and
impairment adjustments) and underlying profit are non-IFRS financial information provided to assist            This release has been authorised for release by Matt Kay, Managing Director and CEO of Beach Energy.
readers to better understand the financial performance of the underlying operating business. They have
not been subject to audit or review by Beach’s external auditors. The information has been extracted
from the reviewed financial statements.

All references to dollars, cents or $ in this presentation are to Australian currency, unless otherwise
stated. References to “Beach” may be references to Beach Energy Limited or its applicable subsidiaries.
Unless otherwise noted, all references to reserves and resources figures are as at 30 June 2019 and
represent Beach’s share.

References to planned activities in FY20 and beyond FY20 may be subject to finalisation of work
programs, government approvals, joint venture approvals and board approvals.

Due to rounding, figures and ratios may not reconcile to totals throughout the presentation.

2
Beach Response to COVID-19
     The Journey
                                                      Initiated                                                                                        Activated
     Activated                                                                                                                                        20th March
                                                    28th February                                   Commenced
   20th February
                                                                                                     19th March                                   o COVID-19 Plans in
                                                o Early engagement                                                                                  place at all
o Crisis Management
                                                  with key contractors                           o Infrared forehead                                operational sites
  Team activated in
                                                  and suppliers                                    temperature checks
  response to
  potential pandemic                                                                               prior to departure                             o Plans include:
                                                o Logistics/supply chain                                                                            Hygiene, social
                                                  management review                              o Temperature checks                               distancing, case
o Instituted travel
  restrictions                                                                                     at all Airports and                              management,
                                                o Contractor COVID-19                              Heliports prior to                               isolation,
                                                  preparedness                                     travelling to Beach                              evacuation and
o Company wide
                                                  verification                                     sites                                            assurance protocols
  comms via HSE&R
                                                                                                                                 Office Staff                                    Emergency
            Crisis                                                                                                                                       COVID-19 Site
                             Health Response            Contractor                Buisness              Temperature            Transitioned to                                    Response
         Management                                                                                                                                         Specific
                                  Team                 Engagement              Continuity Team            Testing                Work from                                      Exercises and
            Team                                                                                                                                          Procedures
                                                                                                                                   Home                                          Assurance

                             Activated                                        Activated                                       Commenced                                       Commenced
                           24th February                                      12th March                                       20th March                                      29th March

                       o Health Response                                 o Full time, multi-                             o All office based                               o 60+ assurance
                         Team activated to                                 discipline team                                 personnel                                        activities completed
                         implement Pandemic                                                                                transitioned to work                             to date
                         Health Plan                                     o 20+ Team Members                                from home
                                                                                                                                                                          o COVID-19
                       o COVID-19 awareness                              o 8 Work Streams                                o Wellbeing and                                    emergency
                         for all staff                                     (Health, HR,                                    psychosocial support                             response exercises
                                                                           Operations,                                     available via EAP                                completed at all
                       o Electronic COVID-19                               Communications,                                 provider (videos,                                sites
                         self-assessment form                              Worst Case Scenario                             podcasts and
                         available via mobile                              Planning)                                       webinars)
                         phone
     3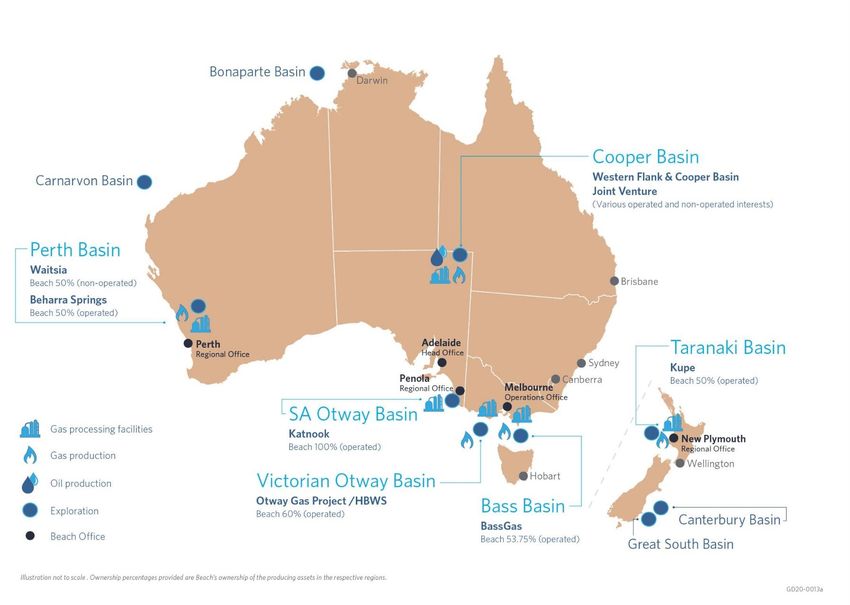
Financial strength a priority
Well positioned for the downturn

Balance Sheet
✓ Conservative approach to balance sheet management                                         NET CASH AT 31 MARCH 2020
    ▪        Rapidly paid down drawn debt post $1.6 billion Lattice acquisition to be net

                                                                                            $80 MILLION
             cash within 18 months
    ▪        $450 million revolving credit facility in place; maturity November 2022; no
             breach of covenants under US$10/bbl oil price scenario
                                                                                            LIQUIDITY AT 31 MARCH 2020
Robust and stable revenue base
✓ Fixed price contracts provide revenue certainty                                           $530 MILLION
✓ 33% of revenue supported by fixed price or downside protection
                                                                                            FY21 FCF BREAK EVEN OIL PRICE
Low cost operator with flexible growth strategy
✓ Direct controllable operating costs reduced by >15% since 2018
✓ Committed growth investment is currently low, providing a high degree of
                                                                                            $0/BBL1
  flexibility in executing our growth strategy

4
        1. Pre-growth investment - assumes zero oil production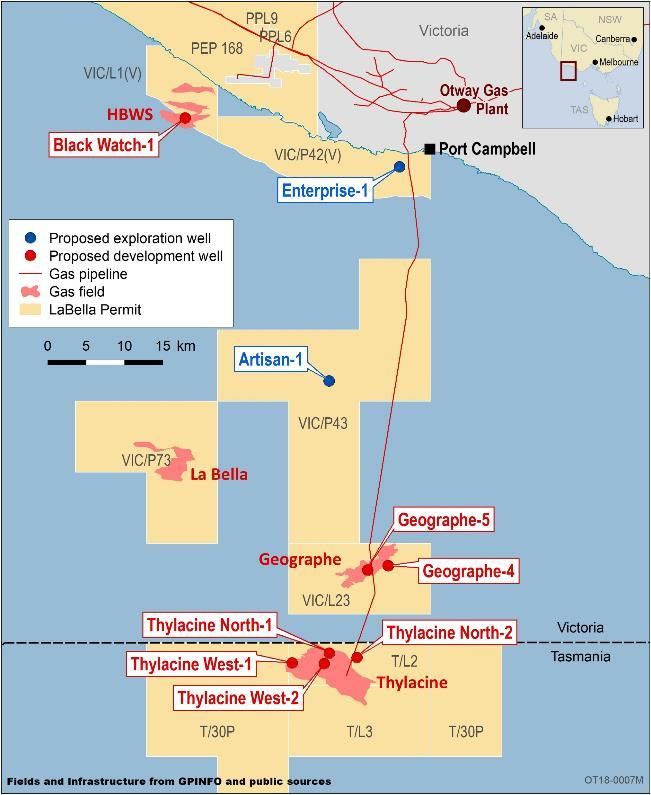
Diverse production mix
Stable contracted gas revenues, oil production economic above US$10/bbl Brent

                                                                                     Gas
         FY20 Estimated Product Mix
                                                                                     ▪     Diversified gas sales into three distinct markets (East Coast, West Coast and NZ)

                                                                                     ▪     Over 97% of forecast FY21 East Coast gas production sold into term contracts

                                                                                     ▪     Gas contracts are fixed price or have downside protection

                                                                                     ▪     Revenue from gas sales covers all group operating costs and stay in business costs 1
          Oil                                                                        Gas liquids
         33%
                                                                                     ▪     Supplements revenues derived from gas and ethane production
                                                              Gas
                                                              55%                    ▪     Products sold into local markets, priced off oil and Saudi CP benchmark

                                                                                     Oil

    Gas Liquids                                                                      ▪     Sold to major international energy traders from Port Bonython
       12%                                                                           ▪     Realised prices over past 3 years at premium to Brent
                                                                                     ▪     Low Western Flank field operating costs (
Beach portfolio not exposed to spot gas prices
Historic and forecast east coast gas sales Recent gas market dynamics
• Low LNG spot prices impacting East Coast Gas Market spot prices
(% of volume)
• Beach has minimal spot gas price exposure: More than 97% of East Coast
100%
gas sales expected to be sold under contract in FY21
80% • Beach gas customer nominations have averaged 102% of take or pay levels
over the past 6 months vs 107% forecast
60%
• Origin GSA gas price review has been referred to arbitration
40%
Mid-long term gas market dynamics
20% • Non-CSG East Coast gas supply is expected to decline in the medium-term
in the absence of material new developments1
0%
• There are physical (pipeline) constraints on how much QLD gas can flow to
H1 FY20 H2 FY20E H1 FY21E H2 FY21E
southern demand centres, no matter how much is made available long-term
Legacy Pricing New Market Pricing Spot Market Pricing
• LNG imports to the East Coast would require domestic prices of >$9/GJ if
long-term LNG prices were as low as US$6 / MMBtu2
> 97% of Beach’s east coast gas sales in FY21 to be sold under term contracts
6 1. Source: 2019 Gas Statement of Opportunities, AEMO – March 2019..
2. Beach estimates: 1 MMBtu = 1.055 GJ, AUD/USD = 0.70, regasification of A$1.00/GJ.Investment focused on keeping infrastructure hubs full
Infrastructure advantage
✓ Investment targeted close to existing
infrastructure, enhances returns and reduces time
from investment to cash flow
✓ Spare capacity in gas infrastructure minimises
cost of new surface investment requirements
Gas investment targeting existing contracts
✓ Majority of FY21 gas investment is expected to
target gas for supply into existing contracts
✓ Beach sees gas production growth potential
across all 7 gas production hubs
Unlocking the Perth Basin potential
✓ Beharra Springs Deep result confirms high quality
Kingia play extension
✓ Tangible progress being made on Waitsia Stage 2,
targeting FID in September 2020 quarter
7Western Flank horizontal drilling success
Gross operated oil production averaging over 22,000 BOPD
✓ Application of horizontal drilling has significantly 25
Operated Western Flank Gross Average Oil Production Rate
enhanced development economics at ~1.5x cost of
a vertical well and deliver ~8x productive potential
20
✓ Field operating costs less than A$5/bbl
15
✓ Surface infrastructure has been optimised and
kbbls/d
expanded to export higher fluid rates
10
✓ Recent success means Beach has an inventory of
connected wells with capacity to maintain
5
production levels
✓ Assessing optionality to temporarily pause drilling 0
and maintain flat oil output
Apr-19
Oct-18
Jan-19
Jan-20
Jul-18
Jul-19
Oct-19
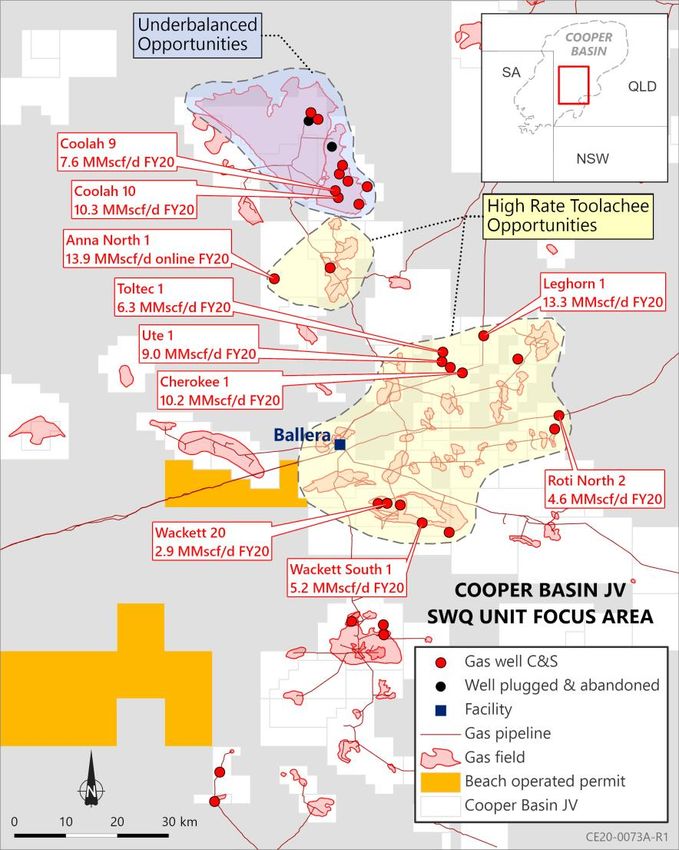
8 March 2020 quarter was the highest operated oil production on record for BeachCooper Basin JV high quality drilling results in South West Queensland
Flow rates from recent wells indication of basin potential
SWQ Toolachee wells deliver outstanding results
✓ Four recent drilling campaigns in SWQ have targeted Toolachee formation
✓ High rate potential of the formation demonstrated across 8 wells
✓ Production rates exceeded pre-drill expectations, flowing with a 30 day
average IP rate of 3 – 14 MMscf/d
✓ Operator is high grading follow up drilling candidates
Underbalanced drilling techniques unlock potential
✓ Coolah 9 and 10 drilled using underbalanced drilling techniques
✓ Wells had 30 day average IP rates of 7.6 and 10.3 MMscf/d respectively
✓ JV assessing follow up underbalanced drilling candidates
Targeting high rate wells quickens payback
period, shortens investment cycle
9Victorian Otway Basin
Update on events
Black Watch-1 success
▪ Well successfully drilled 7,200 metres from onshore location (longest in
Australia), to be tied into OGP in the June 2020 quarter.
▪ Well designed to support an initial production rate of 50 - 60 MMscfd
Offshore Wells
▪ 20 April - Beach issued a termination notice to Diamond Offshore Drilling
Inc. due to late delivery of Ocean Onyx rig
▪ Preliminary assessment that drilling unlikely to commence until FY21
▪ 26 April - Diamond files for Chapter 11 in Texas, USA
▪ Contemporaneously, Diamond lodges complaint against Beach seeking a
determination that the termination of the contract by Beach is invalid and
that the contract remains in effect, and alternatively seeking damages.
Beach denies claim.
▪ Parties continue engage in commercial discussions with regard to the future
10 operations of the Ocean Onyx rigBeach response to the oil price downturn Immediate response to enhance robust business ✓ Targeting a deferral of up to 30% of FY21 capital expenditure from prior expectations ✓ Anticipate capital reductions across all basins ✓ FY21 work program and budget process is currently underway ✓ FY21 investment to be targeted on highest quality investment opportunities with fastest payback ✓ Further operating cost reductions progressing and being targeted 11
Key takeaways

 ▪ Beach is well positioned, with a strong balance sheet and robust revenue stream

 ▪ Excellent Cooper Basin drilling results support delivery of FY20 production in-line with original guidance

 ▪ Portfolio of growth opportunities available close to all 7 production hubs

 ▪ Forward investment program to be right-sized to prioritise highest returning opportunities

 ▪ Primarily the same plan at a prudent pace to manage market and pandemic issues

 ▪ Confident in long term oil and gas market fundamentals

12
     1. Pre-growth investment - assumes zero oil production
MACQUARIE AUSTRALIA CONFERENCE Q&A
Beach Energy Limited
Level 8, 80 Flinders Street
Adelaide SA 5000 Australia
T: +61 8 8338 2833
F: +61 8 8338 2336
beachenergy.com.au

Investor Relations
Nik Burns, Investor Relations Manager
Mark Hollis, Investor Relations Advisor
T: +61 8 8338 2833
You can also read