Profitability of Indoor Production of Pacific White Shrimp (Litopenaeus vannamei): A Case Study of the Indiana Industry
←
→
Page content transcription
If your browser does not render page correctly, please read the page content below
EC-797-W
IISG-15-005
Profitability of Indoor Production of Pacific White Shrimp
(Litopenaeus vannamei): A Case Study of the Indiana Industry
Kwamena Quagrainie • Aquaculture Economics & Marketing Specialist • Purdue University
Structural changes in Midwest smaller sizes. This publication
agriculture over the past two decades compares the profitability of
have resulted in a number of empty and producing different shrimp sizes,
unused farm buildings. Farmers therefore i.e., “21/25,” “26/30,” and “31/35”
have been exploring alternative uses of in an indoor farm facility.
livestock farm buildings for the production
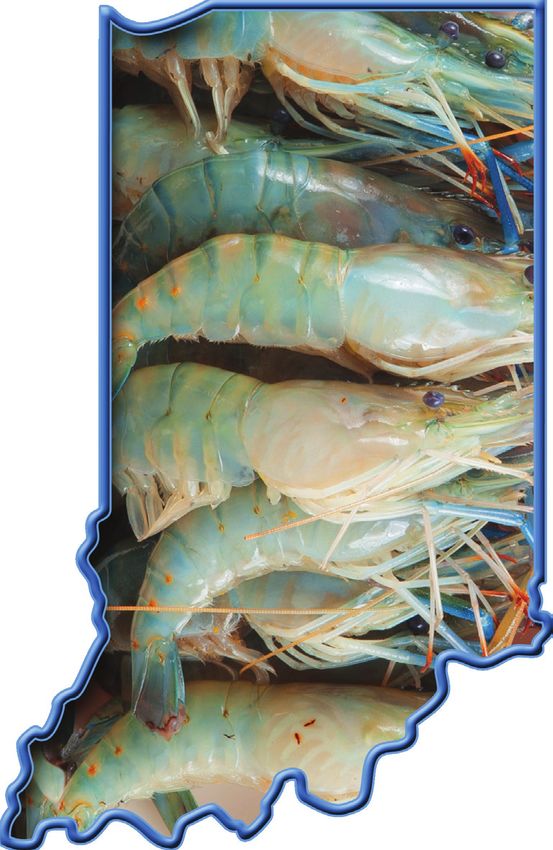
of other cash crops, including aquaculture Indoor Shrimp
products. In Indiana, Pacific White shrimp Production
(Litopenaeus vannamei) production has Production Process
attracted interest, and a number of small The shrimp-production process
producers are investing in shrimp produc- generally involves a hatchery,
tion in their farm buildings and other nursery, and grow-out phases.
farm facilities. The producers are There are no hatcheries in Indiana
motivated by the fact that they could at the moment, and post larvae
produce and market fresh (never frozen) (PL) are imported from out of
high-quality shrimp products in these state, particularly from Florida and
systems to compete with imported Texas. A few Indiana producers have
frozen shrimp. a nursery phase to grow shrimp from about
The industry-wide standard for 0.35g to greater than 1.0g before stocking in
selling fresh or frozen shrimp in grow-out tanks/pools. The nursery phase helps
the shell without the head on is by to evaluate shrimp quality through grading to
quantitative unit, i.e., count per pound. There are ensure that quality PL are stocked for grow-out. Some
several standardized sizes, which range from “U/10” producers have experienced significant PL mortality or
(under 10 count), representing shrimp that are large low survival when PL are stocked in small sizes, particu-
enough that fewer than 10 weigh about a pound, to larly directly from the hatchery without the nursery
“61/70” shrimp (61-70 count), which are relatively very phase. Indiana farmers are operating mostly at the
small in size. Data and information gathered from the grow-out phase with PL that are at least 1.3g.
Indiana shrimp industry suggests that producers are The grow-out phase is intensive and produces market-
producing and selling shrimp counts in the range of able shrimp of various size counts. Tanks or pools are
“21/25,” “26/30,” “31/35,” and “36/40.” Some produc- stocked at high densities and fed commercially formu-
ers have indicated that, on certain occasions, the lated feed that supplies all the nutrition needed by the
increased demand does not allow them to grow the shrimp. The intensive operations require good water
shrimp to bigger sizes and that they are forced to sell at quality in the production process to maintain optimum
Funding for the study was provided by Indiana State Department of Agriculture under the Livestock Promotion Grant Program with supplemental funding from Purdue Extension,
Illinois-Indiana Seat Grant, and the Indiana Soybean Alliance, and conducted in cooperation with the Indiana Aquaculture Association Inc.
Profitability of Indoor Production of Pacific White Shrimp (Litopenaeus vannamei): A Case Study of the Indiana Industry
growth conditions for the shrimp. The shrimp grow-out                   capacity of 4,200 gallons. These systems are sold as
systems in Indiana are mainly biofloc systems that                      a complete package with pumps, aeration system,
remove metabolic wastes during the production process.                  biofloc settling system, etc.
The biofloc are cultured colonies of bacteria in the                3. A significant amount of support equipment and
grow-out tanks that convert ammonia into nitrate. The                   materials are needed, which includes water heater,
bacteria can also become supplemental feed for the shrimp.              water storage, emergency generator, purge tank,
Economics of Production                                                 agitators, blowers, monitoring equipment, water
   In spite of the increased interest in Pacific White                  quality test kits, and miscellaneous equipment (nets,
shrimp production in Indiana, there are no studies of                   scale, buckets, etc).
the economics of shrimp production in indoor systems.                 Production parameters used in the study reported here
This study therefore examines the industry in Indiana              are presented in Table 1. A 4,200 gallon capacity pool is
by developing estimates of production costs using actual           equivalent to 15.9m3, and the literature suggests
field data. The study should help to inform investment             stocking rates from 300-500/m3. The focus of the study
decisions on Pacific White shrimp aquaculture in the               is the grow-out phase; therefore a stocking size of 1.3g is
Midwest region. It also provides information on invest-            stocked at 450/m3, i.e., 7,200 PL per tank/pool. The
ment requirements, inputs, and costs necessary to                  production period varies by marketable size as “21/25”
undertake shrimp production in pools, which are common             count requires a relatively longer period to market size
equipment used in Indiana. The estimated profit margins            compared to the other counts (Table 1). It is therefore
provided allows a prospective producer/investor to                 assumed that “21/25” and “26/30” count shrimp will
compare the profit margins with alternative enterprises.           have a slightly higher feed conversion than the produc-
   A detailed spreadsheet for Pacific White shrimp                 tion process for “31/35” count shrimp.
enterprise budgeting process as well as for other fish                The production schedule assumes that shrimp will be
species is available at Purdue University’s Department of          harvested every other week, resulting in an average of
Agricultural Economics Web page https://ag.purdue.                 28 pools harvested every year for “21/25” count, 32
edu/agecon/Pages/Aquaculture-Budget.aspx. The                      pools for “26/30” count, and 34 pools for “31/35”
spreadsheet can be used for various sensitivity analysis to        count. The “21/25” count shrimp are harvested at 20g
assess budget variables that have significant impact on            after 14 weeks of grow-out, “26/30” count shrimp is
profitability. It can also be used to assess the changes           harvest at 16g after 12 weeks, and “31/35” shrimp is
needed for specific budget variables to enhance profit-            harvested at 14g after 11 weeks.
ability. However, it should be noted that some variables              Some economic models on indoor recirculating
such as prices may be beyond the control of a prospec-             biofloc shrimp production system have suggested
tive farmer/investor, while other variables such as                stocking PL of at least 3g. The last column in Table 1
survival or mortality and feed conversion are dependent            provides the parameters used to examine a budget for a
on management skills. Thus, the spreadsheet can be                 “21/25” count shrimp that is stocked at 3g and reared
used as a tool to determine management issues as well as           for 12 weeks to obtain a harvest weight of 22g. The
determine production targets, capital requirements, cost           price of a 3g PL is taken to be twice that of 1.3g PL.
structure, and profit potential.
                                                                   Profitability Analysis
   The production and marketing assumptions made for
                                                                     The study develops enterprise budgets for the various
this study are as follows.
                                                                   shrimp counts; however, only an enterprise budget for a
 1. A prospective producer will renovate an existing               “21/25” count shrimp stocked at 1.3g (Table 1, column
     farm building with a concrete floor or may decide to          2) is reported in Table 2. The enterprise budget provides
     construct a new pole barn with concrete floor. The            a summary and detailed estimates of all costs and
     building should be large enough to accommodate                resources associated with raising Pacific White shrimp
     the number of tanks/pools and targeted production             in an 8-pool system over a year. The rest of the study
     levels. Making room for potential expansion is                focuses on profit margins and compares profitability
     recommended.                                                  using a range of survival and market prices for all the
 2. The system comprises an 8-pool system, each with a             profiles presented in Table 1.

                                                               2
Profitability of Indoor Production of Pacific White Shrimp (Litopenaeus vannamei): A Case Study of the Indiana Industry
Table 1: Growth Parameters for Shrimp Grown in Indoor Biofloc Systems
                  Parameters                    “21/25” count           “26/30” count         “31/35” count          “21/25” count
  Rearing period (weeks)                                 14                   12                   11                     12
  Frequency of harvest (pools/yr)                        28                   32                   34                     32
  Stocking rate (PL//m  3
                                                         450                 450                  450                    450
  Stocking size (g)                                      1.3                 1.3                   1.3                    3.0
  Feed conversion                                        1.4                 1.4                   1.3                    1.4
  Final weight (g)                                       20                   16                   14                     22

Table 2: Revenue, Operating and Total Costs for “21/25” Count Shrimp in an 8-Pool System
                                                 Unit          Cost / Unit ($)     Quantity         Cost ($)         % of Total cost
               Sales Receipts                      lb              16.00            6,222          99,557.31
    VARIABLE INPUTS:
    PL                                          Number                     0.10         201,600          20,160.00                24%
    Feed Price                                     lb.                     1.20           7,904           9,484.87                11%
    Electricity                                  kw-hr.                    0.06           9,333            560.01                  1%
    Hired Labor                                  Hour                    10.00            1095           10,950.00                13%
    Heating                                       year                     8.00          560.64           4,485.12                 5%
    Chemicals                                      $                    100.00                8            800.00                  1%
    Insurance                                      %                    148.51              12            1,782.10                 2%
    Loan + Interest                                %                                                      7,794.97                 9%
    Total Variable Costs (TVC)                     $                                                 56,017.07                  65.42%
                            Cost/lb                                                                          9.00
    FIXED INPUTS:
    Building                                       $                   4,500.00            0.03            150.00                  0%
    Complete Tank System                           $                  46,800.00            0.10           4,680.00                 5%
    Water Heater                                   $                   4,230.00            0.10            423.00                  0%
    Water Storage                                  $                   2,340.00            0.10            234.00                  0%
    Emergency Generator                            $                   4,050.00            0.07            270.00                  0%
    Purge Tank                                     $                    405.00             0.10             40.50                  0%
    Agitators                                      $                   4,320.00            0.20            864.00                  1%
    Blower                                         $                   3,060.00            0.20            612.00                  1%
    Monitoring Equipment                           $                    675.00             0.20            135.00                  0%
    Water Quality Equipment                        $                   4,636.80            0.20            927.36                  1%
    Fish Handling Equipment                        $                    900.00             0.50            450.00                  1%
    Feed Storage                                   $                    450.00             0.20             90.00                  0%
    System Set-up labor                            $                   5,120.00            1.00           5,120.00                 6%
    Miscellaneous equipment                        $                   4,500.00            0.20            900.00                  1%
    Maintenance                                    $                    297.02            12.00           3,564.21                 4%
    Management                                     $                    928.80              12           11,145.60                13%
                            Total Fixed Costs                                                        29,605.67                  34.58%
                             Total Costs (TC)      $                                                 85,622.74              100.00%
                   Break-even price (BEP)         $/lb                                                      13.76
                         Profit Above TVC         $/lb                                                       4.76                 35%
                             Profit Above TC      $/lb                                                       2.24                 16%

                                                                  3
Profitability of Indoor Production of Pacific White Shrimp (Litopenaeus vannamei): A Case Study of the Indiana Industry
Sales Revenue                                                         assumed that the farmer already has land for either the
  Most of Indiana’s shrimp farmers market shrimp                      construction of a new pole barn with concrete floor or
direct to consumers from the farm; therefore, marketing               that there is an existing farm building with concrete
cost is minimal. In Table 2, the yearly average of                    floor that will be renovated. The building and all the
harvesting 28 pools of shrimp requires stocking 28                    equipment listed in Table 2 are assumed to have a
pools at 7,200 PL/pool with 1.3g PLs. Assuming a 70%                  salvage value of 10% of initial cost. A straight line
survival (or 30% mortality) and harvest weight of 20g                 depreciation is used to determine the annual cost. For
yields 141,120 shrimp or 6,222lb of shrimp at harvest.                the study, an existing building is renovated at a cost of
At a selling price of $16.00/lb, the revenue generated                $5,000 and will have a useful life of 30 years, which
from sales is $99,557 for a “21/25” shrimp count.                     amounts to an annual cost of $150. (Note that
                                                                      construction of an entirely new building will cost
Variable Costs                                                        more.) The 8-pool system cost $6,500 per tank for a
  These are operational costs incurred within the                     total of $52,000 for the complete set. The tank system
production period, and they vary with the level of                    is assumed to have a 10 year useful life and an estimated
production. The major variable costs include the cost of              annual cost of $4,680. These systems are sold as a
PL, feed cost, hired labor, and loan payments with                    complete package with pumps, aeration system, biofloc
interest (Table 2). The cost of the PLs includes transpor-            setting system, etc. It is estimated that 32 hours are
tation, and, at $0.10 each, it accounts for 24% of total              required to set up a pool with all the plumbing work,
cost. (Note that the budget for the profile presented in              which suggests 256 hours are required to set-up an
the last column of Table 1 assumed that a 3g PL cost                  8-pool system. This amounts to $5,120. This is a
$0.20). The amount of feed used is based on the differ-               one-time initial cost.
ence between ending biomass and beginning biomass
                                                                         There is other equipment needed, including water
multiplied by the feed conversion ratio. About 7,904lb
                                                                      heater, water storage, emergency generator, purge tank,
of feed is required, and, at $1.20/lb, it accounts for 11%
                                                                      agitators, blowers, monitoring equipment, water quality
of total cost. With labor, about 3 hours a day are
                                                                      test kits, and miscellaneous equipment (nets, scale,
required for various activities on the farm, including
                                                                      buckets, etc). The cost of a water heater is about
water quality testing, feeding, etc. At a rate of $10.00/hr
                                                                      $4,700, and, with an operational life of 10 years, the
and 365 days in a year, $10,950 labor cost will be
                                                                      annual cost is $423. The water storage tank costs
incurred, which accounts for 13% of total cost. The
                                                                      $2,600, with a useful life of 10 years as well. The annual
analysis assumes that a commercial loan is secured for
                                                                      cost is $234. The emergency generator is estimated to
the capital costs with a 20% down payment and interest
                                                                      have an operational life of 15 years and to cost $4,500,
rate of 8%. The loan with interest amounts to about
                                                                      meaning an annual cost of $270. The water quality
$7,795, which is 9% of total cost.
                                                                      equipment cost $6,624 and has an annual cost of $927.
  Electricity is required to operate pumps and agitators,             The water quality equipment set comprises of all
and it is estimated that 9,333kwh will be required. The               required meters, reagents, mini-lab instruments, etc.
price from Duke Energy, Indiana is about $0.06/kwh                    This cost can be significantly lower if a farmer knows
for a total cost of $560 per year. This cost is different             exactly what is needed and can purchase items individu-
from the heating cost, which is estimated by million                  ally. Other expenses are estimated for storage and other
BTU/tank. The price from Duke Energy, Indiana for                     miscellaneous equipment. A 2% charge on the annual
million BTU from electricity is $8.00. The costs for                  capital investment is allocated to maintenance, and a
BTU from natural gas and propane gas are higher. It is                2% charge on total operating costs is allocated for
estimated that each pool/tank uses about 8,000 BTU                    management services.
per hour, and, for the year, the total cost is about
$4,485. Insurance is estimated to be 1% of annual                     Profitability
capital cost.                                                           Table 2 indicates a breakeven price of about $13.76/
                                                                      lb. The break-even price is the price point where the sale
Fixed Costs                                                           price covers total cost (both fixed and variable). In Table
 These costs are mainly the capital investment costs.                 2, it is calculated as the total cost $85,623 divided by
This budget does not include the purchase of land. It is              the pounds of shrimp obtained, 6,222lb. It implies that

                                                                  4
Profitability of Indoor Production of Pacific White Shrimp (Litopenaeus vannamei): A Case Study of the Indiana Industry
the minimum a farmer can sell shrimp to recover all $18.00/lb. If the survival realized is 70% (or 30%
costs is $13.76 with no profit. Profit is obtained when mortality), farmers can only obtain a profit margin of
the selling price is higher than $13.76. At a selling price 16% if they sell the shrimp at a minimum of $16.00/lb.
of $16.00/lb, the profit margin after covering all cost is With 60% survival (or 40% mortality), shrimp has to
$2.24 or 16% (Table 2). Aquaculture in general is be sold at $18.00/lb to obtain a 15% profit margin. A
considered a high-risk industry, so obtaining at least a farmer will incur losses with a 50% survival (or 50%
15% profit margin is considered a good margin. mortality) irrespective of the selling price within the
To assess the variables that significantly affect profit- selected range.
ability, the enterprise budgets were subjected to a In Figure 2, farmers producing a “26/30” count
sensitivity analysis for various shrimp size counts. The shrimp will obtain at least 16% profit with 80% surviv-
results suggest that survival rate (or mortality) and al (or 20% mortality) when the shrimp is sold at a
selling price were the most significant variables. There- minimum of $16.00/lb. With 70% survival (or 30%
fore, the profit margin was analyzed using a range of mortality), and a selling price of $18.00/lb, a 17%
selling prices and survival rates. Figures 1 and 2 show profit margin will be obtained, but a 10% profit margin
the estimated percentage profit with survival rates of will be obtained if the selling price is $17.00/lb. In this
50% – 80% and selling price from $14.00 – $18.00 for scenario also, a farmer will incur losses with a 50%
“21/25” count and “26/30” count shrimp, respectively. survival (or 50% mortality) irrespective of the selling
Figure 3 shows the estimated percentage profit with price within the selected range.
survival rates of 60 – 80% and selling price from $12.00 Figure 3 generally does not show any profitability
– $15.00 for “31/35” count. Figure 4 presents estimated except for a marginal 8% profit with 80% survival (or
percentage profit for a “21/25” count where 3g PL were 20% mortality) and a selling price of $16.00/lb and a
stocked at the beginning of production. The selected 2% profit at $15.00/lb.
ranges reflect what pertains in the Indiana shrimp
The profitability outcomes observed in Figure 4 are
industry.
similar to what is observed in Figure 2. The results
In Figure 1, farmers producing a “21/25” count suggest that with a minimum target of 15% profit
shrimp will obtain at least 14% profit margin in the $14 margin, a farmer can achieve that target with a survival
- $18/lb price range with a high survival of 80% (or of 80% (or 20% mortality) and at least $16 selling
20% mortality). The percentage profit increases with price, and with a 70% survival (30% mortality) and a
the sales price and can be as much as 46% profit at selling price of $18.00/lb.
Figure 1: Percentage Profit with Different Survival and Selling prices for “21/25” Count
50% 46%
Survival
38%
40%
50% 60% 70% 80% 30% 31%
% Returns Above Total Cost
30%
24%
22%
20% 16% 15%
14%
9% 8%
10%
2% 2%
0%
-2%
-4%
-10% -8%
-11%
-13%
-20% -18%
-24%
-30%
$14.00 $15.00 $16.00 $17.00 $18.00
Selling Price
5Profitability of Indoor Production of Pacific White Shrimp (Litopenaeus vannamei): A Case Study of the Indiana Industry
Figure 2: Percentage Profit with Different Survival and Selling prices for “26/30” Count
40%
Survival 31%
30%
50% 60% 70% 23%
% Returns Above Total Cost
20% 16% 17%
9% 10%
10%
4%
2% 2%
0%
-3% -4%
-10%
-9% -9%
-13%
-15%
-20% -18%
-21%
-23%
-30% -28%
-33%
-40%
$14.00 $15.00 $16.00 $17.00 $18.00
Selling Price
Figure 3: Percentage Profit with Different Survival and Selling Prices for “31/35” Count
15%
Survival
10% 8%
60% 70% 80%
5% 2%
% Returns Above Total Cost
0%
-5% -3%
-5%
-10% -9%
-15% -12%
-16% -16%
-20% -19%
-22% -21%
-25%
-26%
-30% -28%
-35% -32%
-40% -37%
$12.00 $13.00 $14.00 $15.00 $16.00
Selling Price
Figure 4: Percentage Profit with Different Survival and Selling Price for “21/25” Count (3g PL Stocked)
40%
Survival 32%
30% 25%
50% 60% 70% 80%
% Returns Above Total Cost
18%
20% 17%
10% 11%
10% 5%
3% 3%
0%
-2% -2%
-10% -8% -8%
-12%
-14%
-20% -17%
-20%
-22%
-30% -27%
-32%
-40%
$14.00 $15.00 $16.00 $17.00 $18.00
Selling Price
6Profitability of Indoor Production of Pacific White Shrimp (Litopenaeus vannamei): A Case Study of the Indiana Industry
Conclusions High survival (low mortality) during the shrimp
Indoor production of Pacific White shrimp is profit- production process is very crucial to the profitability of
able if they are grown to bigger sizes of at least “26/30” the shrimp business. Good and efficient farm manage-
count. In spite of pressures on farmers to sell smaller ment practices are needed to minimize mortality.
size count due to demand, farmers will be better off Due to the relatively high cost of indoor production
allowing the shrimp to grow into bigger sizes before of Pacific White shrimp, marketing strategies are essen-
selling. This is because given the range of current tial to obtain premiums to assure profitability.
industry selling prices, the additional value of weight
gain for large shrimp is more than the additional cost
Suggested Additional Materials
incurred in producing it. The returns on growing Aquaculture Economics and Marketing Resources,
shrimp to larger sizes far outweigh the cost of producing Purdue University. https://ag.purdue.edu/agecon/Pages/
them. Aquaculture-Budget.aspx
If farmers want to sell shrimp due to high demand, Hanson, T. (2014). Economic Overview of Biofloc-
they can consider stocking larger PL of about 3g – 4g to Dominated, Super-Intensive Litopenaeus vannamei
obtain larger shrimp within a shorter rearing period. A Grow-out Raceway. Paper present at Aquaculture
3g – 4g PL will cost about twice that of 1.3g but the America 2014, Seattle, WA. February 10, 2014.
returns will be more than the additional cost. Hanson, T., A. Braga, V. Magalhes, T.C. Morris, B.
Though small size shrimp takes relatively less time to Advent, and T.M. Samocha. (2012). Economic Analysis
reach market size and thus have a high turnover, the of Two Feeds in Biocloc-Dominated Supper-Intensive
relative value of a unit weight at harvest is generally less Shrimp Production Systems for the Pacific White
than the cost of production. Note that the major Shrimp, 2012. Paper present at Aquaculture America
operational costs as shown in Table 2 are the cost of PL, 2012, Nashville, TN. February 25, 2012.
feed, hired labor and loan repayment. The high turn- Rode, R. (2014). Marine Shrimp Biofloc Systems:
over involves more production and requires more Basic Management Practices. Purdue University Extension
resources, and therefore higher cost. publication FNR-495-W. Available at: https://extension.
purdue.edu/extmedia/FNR/FNR-495-W.pdf
May 2015
It is the policy of the Purdue University Cooperative Extension Service that all persons have equal opportunity and access to its educational programs, services, activities, and facilities
without regard to race, religion, color, sex, age, national origin or ancestry, marital status, parental status, sexual orientation, disability or status as a veteran.
Purdue University is an Affirmative Action institution. This material may be available in alternative formats.
Order or download materials from
Purdue Extension • The Education Store
www.edustore.purdue.edu
1-888-EXT-INFO • www.extension.purdue.edu
7You can also read