Interim Results 2017 Prepared for next generation offshore windturbines - 24 August 2017
←
→
Page content transcription
If your browser does not render page correctly, please read the page content below
Interim Results 2017
Prepared for next generation offshore
windturbines

24 August 2017
Representing Sif today
       Jan Bruggenthijs
       Chief Executive Officer
       38 years’ industry experience on the management boards of:
       - GTI (currently part of Engy)
       - Stork Industry Services
       - Hertel Middle East
       - Eriks Continental Europe west

       Leon Verweij
       Chief Financial Officer
       30 years’ industry experience as CFO of:
       - Royal IBC
       - Royal Volker Wessels
       - Smulders (interim)
       - Ballast Nedam (interim)

                                                                    2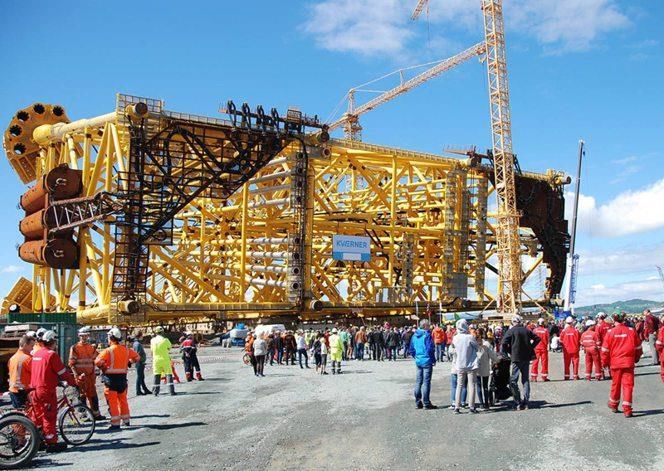
Infographic on Sif’s Strategic Phases
       Transformational history
       Start-up phase Rapid growth phase (1972-2000) Redefine the business phase                          Accelerated growth phase (2014-present)
                                                           (2000-2014)
                                                                                                                                  Completion of second
                                                                                                                              production line at Maasvlakte
                                                                                                         Listing at           2 Rotterdam and renewal and
                                                                                                      Euronext and             realignment of production
                                                                                                        successful                 lines at Roermond
                                                                                                      placement of
                                                                                Facility upgraded         shares
                                                      Egeria Capital            to 13 halls with 3
                                 Focus on           acquires 82.5% in               expanded
                               foundations                  Sif                  production lines                                    2017
                                                                                                                                Ongoing
                           (sleeves, piles and
                            legs) for oil & gas                                                                        2016
   Open Helden             and large pressure                                                             2014
 production facility              vessels
    for vessels                                                                           2010
                                                                         2005
                                                       2000
                                          1972-
                           1972           2000
            1961                                                                                                Completion of
1948
                                                                                       Completion of            Maasvlakte 2
                                                      Change of strategy to             second wind           facility Rotterdam
                                                     focus on offshore wind:          production line           and first MPs
Silemetal founded by Jan                                  first mover in
Jacob Schmeitz as metal            Transfer to                                        totaling 11 halls         produced and
                                  new facility in     monopiles/transition           and 3 production              delivered
   working company in                                   piece fabrication
         Sittard                   Roermond                                                 lines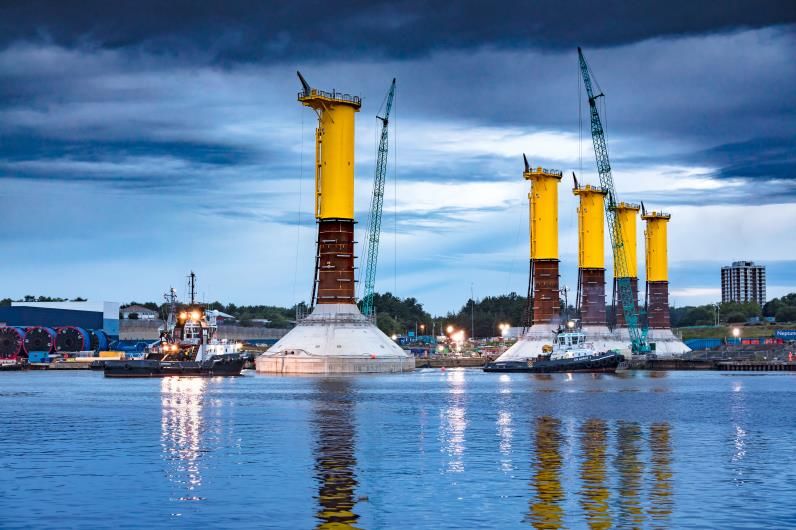
Sif at a glance
Leading provider of mission-critical steel foundations to offshore wind and oil & gas markets
Key business description Key facts
A leading manufacturer of customized tubular components up to 11 meters in Upon completion of the Rotterdam facility, there will be a
diameter for offshore foundations total annual delivery capacity of 300 Kton including a
Highly automated and flexible production facilities located along key capacity for XL monopiles of 150 Kton
waterways in the Netherlands (Roermond and Rotterdam main port) EBITDA: € 33.7 (HY 2016 € 36.9)
Technology leadership in rolling and welding of heavy steel plates up to 15 cm
Tonnage: 108 Kton (HY 2016 97 Kton)
wall thickness, based on more than 65 years of experience and innovative
processes developed in house Free float: >44% (11.2 m shares)
Trusted supplier to longstanding, entrenched customer base
Key products Some of our blue chip clients
Monopiles Jackets
Offshore Wind Platform Large monopiles (“MPs”) and Direct Indirect
Steel tube TP
Ladder primary steel sections of
transition pieces (“TPs”) for
91%1) J-tube offshore wind turbines
MP
Steel tube Produced by Sif
Jackets
Legs Legs, pile sleeves, bracings Direct Indirect
Offshore Oil & Gas
and piles for oil & gas rigs
Bracings
9% 1) Pile sleeves
Piles Produced by Sif
1) Based on HY 2017 production in kton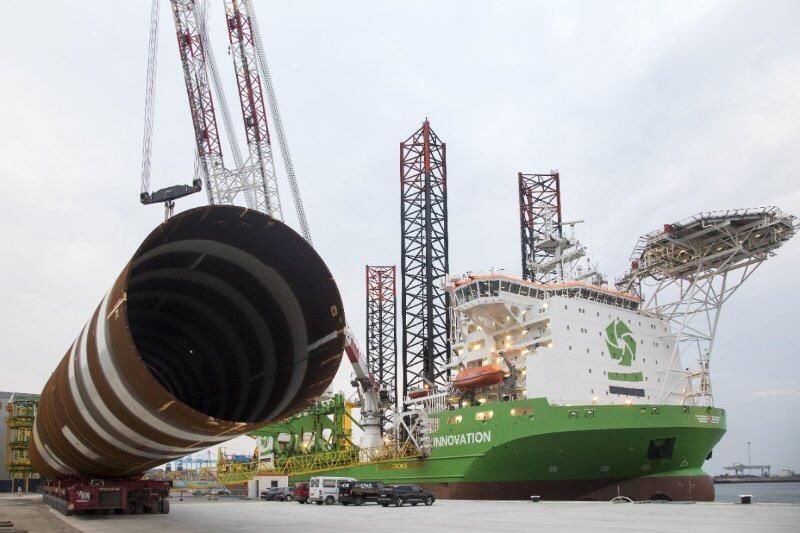
Operational and financial highlights in the first half of 2017

1. Healthy business environment (CEO Jan Bruggenthijs)
• Business environment for European offshore wind has further improved:
   • According to Make consultants present Lower Levelized Cost of Energy
     may lead to shift from onshore to offshore
   • Unsubsidized contract wins for 3 recent German projects
• Operational results in first half of 2017 satisfactory, but lower than HY 2016
   • Successful deliveries for Blyth, Galloper and Rentel
   • Successful deliveries for Sverdrup and Beatrice
   • Commissioning of second production line in new plant on track
   • Renewal and realignment of production facilities in Roermond are on
     schedule

                                                                                   5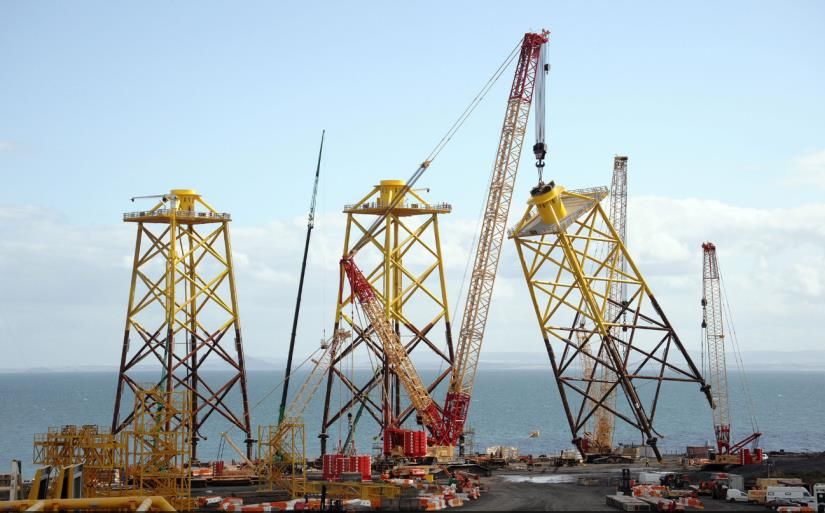
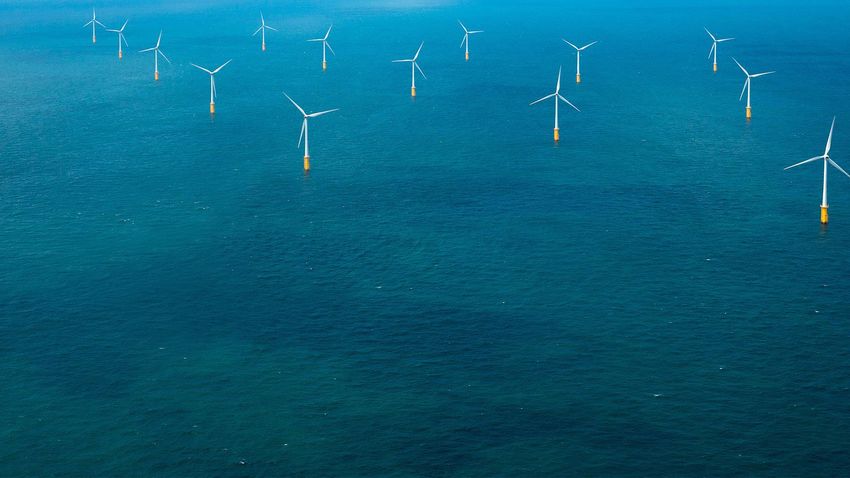
Business environment has improved for offshore wind
Capacity addition offshore 2017-
2026 for top 20 markets₂
• First projects with zero subsidies (He Dreiht, OWP West and
Borkum Riffgrund West II)₂
Offshore Wind 2017 • LCOE for Germany, UK, Netherlands below € 100/MWh in
65.82 GW 29
34 IN TOTAL - 2017; expected to drop below € 60/MWh by 2022₂
2026 Turbines get larger (13-15 MW under development), stable at
2 water depths of 30- 50 meters
More offshore wind initiatives in Far East and US
Installed offshore capacity of 24.6 GW by 20201
Far East
USA & Canada
Europe
Offshore Oil & Gas
Activities for oil & gas Average UK Brent oil price in first half 2017 above USD 50 per barrel
demand higher pricing Though improved on 2016, still low for offshore exploration and development
levels of new fields
Organization
Pull production system introduced (process to project orientation)
Reinforce organization
Further optimize and innovate key processes (rolling, welding)
and cost-leadership
Implement ERP system
(internal)
Appoint new CFO
₁ Source: WindEurope; key trends and statistics 2016
₂ Source: MAKE Consultants 6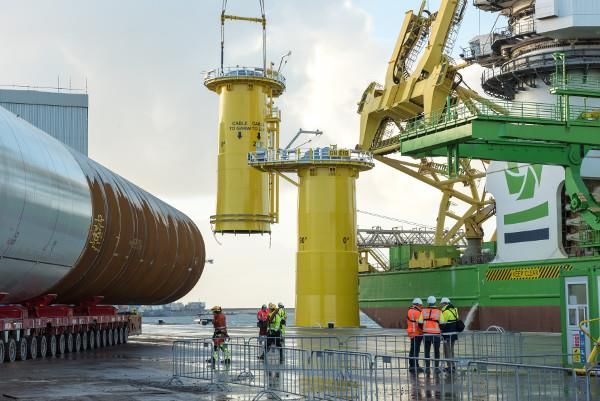
Sif operational highlights in first half of 2017

   Key offshore
  wind projects
  Blyth (gravity-
based) and Rentel
Sif operational highlights in the first half of 2017

Key offshore wind
 project Galloper
Sif operational highlights in the first half of 2017

 Components for
  Aegir jacket for
      Sverdrup
   (offshore oil &
 gas) and piles for
  Beatrice jackets
  (offshore wind)
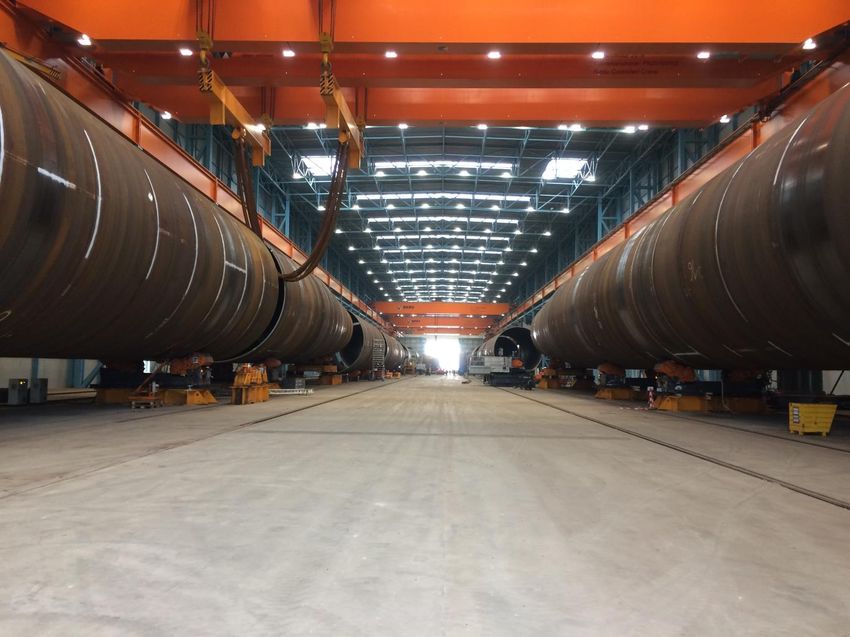
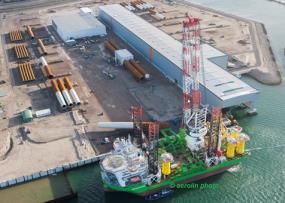
Maasvlakte 2 facility: commissioning of second production line nears
completion
Commencement of Completion of steel Commencement of Transportation of Full production
steel construction for construction and floor coating of MPs assembly line 2 from capacity in both
the foundations of the of assembly and Roermond to Roermond and
Completion and
assembly and coating coating hall Maasvlakte 2 Rotterdam
delivery of first MPs
hall at Maasvlakte 2
Installation of overhead Arrival of innovation Rearrangement Full capacity of
facility
cranes jackup vessel Roermond 300,000 ton p.a.
First production MPs Change to full-scale
can/ cone production
Q1 2016 Q3 2016 Q4 2016 Q3 2017 HY2 2017
First load in of sections in August 2016
First production in September 2016
First coating in October 2016
First delivery of monopiles in December 2016
First arrival of jackup vessel in January 2017
Commissioning of second production line in
August 2017Operational and financial highlights in the first half of 2017
2. Financial results on track (CFO Leon Verweij)
• Total production in Kton 11% higher at 108 Kton compared to the first half of
2016
• Results HY 2017 lower than HY 2016, due to:
• Exceptional project results in the first half of 2016
• Higher than anticipated recurring and non- recurring costs relating to set
up costs Rotterdam facility and start- up expenses
Contribution + 14.1% to € 74.4 million on production of 108 Kton (97 Kton 2016)
Financial Contribution per Kton increased by 2.5% from € 671 to € 688
Normalized EBITDA – 8.7% to € 33.7 million (€ 36.9 million HY 2016)
performance on
Revenue € 156.2 million (€ 205.3 million HY 2016)
schedule to meet Working capital at HYE € 18.1 million (€ 8.3 million YE 2016)
forecast Net debt at HYE € 47.7 million (€ 42.0 million YE 2016)
Orderbook 2018 109 Kton
11Development of contribution
Contribution by segment FY 2013-2016 (€m) Contribution by segment HY 2015-2017 (€m)
400
130 130 130
321 23.7
110 110
336 263
101
90 18.9 90
85 84
70 36.1
24.8 70 6.8 74.4
7.9
50 105.4 65.2
50
80.8
11.2 66.7
30 58.4 30 42.1 57.3
48.3
10 30.9
10
-10 FY 2013 FY 2014 FY 2015 FY 2016 -10 HY 2015 HY 2016 HY 2017
Offshore Wind Oil & Gas Other Revenue Offshore Wind Oil & Gas Other
Contribution is leading financial indicator because it excludes:
Steel price fluctuations
Raw materials supplied by customers
Level of sub-contracting
12Development of EBITDA
EBITDA FY 2013-2016 (€m) EBITDA HY 2015-2017 (€m)
70 65,4
57.8 70
60 6,8
2,5 60
45,7
50 44,0
50
36.9 33.7
40
40
24.2
30 4.8 1.4
30
20
20
10
10
0
FY 2013 FY 2014 FY 2015 FY 2016 0
HY 2015 HY 2016 HY 2017
EBITDA EBITDA normalized
EBITDA EBITDA normalized
The change in EBITDA was mainly due to:
A slow start to 2017 with set-up costs, training and maintenance
Longer-than-expected production line adjustments to facilitate larger products (including Hohe See)
Relatively low production efficiency due to factors including the required fine-tuning of transfers
from Roermond to Rotterdam
Normalized for IPO-related costs, € 1.4 million in HY 2017 versus € 4.8 million in HY 2016
13Stable operating working capital requirement
Operating working capital (€m) Comments
(€m)
200 Healthy working capital dynamics
Current operating assets Current operating liabilities Maintenance CAPEX approx. € 4-6 million per annum and € 6-8
Operating working capital million per annum following completion of Maasvlakte 2 plant
Expansion program Maasvlakte 2 and Roermond (€ 90 million)
150
completed Q3 2017
Total CAPEX in 2017 approx. € 25 million
100
50
19.3 2.5 18.1
8.3
0
(50)
(100)
(150)
31-Dec-15 30-Jun-16 31-Dec-16 30-Jun-17Operational and financial highlights in the first half of 2017
3. Offshore wind market continues to show momentum (CEO Jan Bruggenthijs)
• Realized production in first half of 2017 and order book for 2017 basis for
approximately 230 Kton of production in full-year 2017
• Full Year 2017 outlook: EBITDA shortfall in second HY 2017 compared to
second HY 2016 roughly half of EBITDA shortfall in first HY 2017 compared to
first HY 2016
• Projects planned for grid connection in 2020 shift to 2021; production of
foundations planned for 2018 consequently shift to 2019
• Monopiles remain the foundation of preference, with an 80% market share
of all offshore wind foundations
15Offshore wind market continues to show strong momentum
Growth in offshore wind
Expected annual global and European offshore wind
installations (in GW) (by grid The governments of Germany, Denmark and
connection/commissioning date)₁ Belgium backed a pledge to install 60 GW of new
11.2
offshore wind power next decade, more than five
global times the existing capacity.
10.1 Date: 8 June 2017 – Source: Bloomberg; Jess Shankleman
Europe
9.0 The world could see as much as 237MW of floating
offshore wind capacity installed by 2020.
Date: 26 March 2017 – Source: Bloomberg New Energy Finance
(BNEF)
6.8 Offshore wind now at the heart of UK economy
6.6
growth.
Date: 23 January 2017 – Source: Rechargenews
5.3
5.0
4.7 Consortium builds Borssele 3 and 4 for historically
3.9 3.9 low price.
3.8 3.8
3.5 Date: 12 December 2016 – Source: AD
3.3
3.0
2.8
2.3 2.3 First U.S. offshore wind farm begins operation.
1.9 2.0 Date: 21 December 2016 - Source: Offshore Wind Industry
Europe's offshore wind industry booming as costs
fall.
Date: 20 October 2016 – Source: The Guardian
2017E 2020E 2021E 2024E
! Foundation components sold to customer 1-2 years on average prior to grid connection date
₁MAKE consultants Q2/2017 global wind power market outlook update 7 June 2017…and there is a strong outlook for the longer term
Formulated government ambitions post-2020 1)
Target of 41GW by 2030; OW at heart of UK growth
Goal of 6.5GW of grid-connected offshore wind power by
2020 and target of 11GW by 2025; 4 projects tendered in
new tender system (January 2017)
Target of 4.5GW by 2023
Borssele I and II awarded to DONG, Borssele III and IV awarded
to consortium of Shell, Van Oord, MHI and Eneco
Aim to limit global warming by 2° Celsius
Target of 100% renewable energy future by 2050
Target of 40% electricity from renewable sources by 2030
3,000MW of offshore wind to be realized by 2025 and
decided that nuclear power will be phased out by 2025
1) Source: Public announcements.Updated market demand with latest grid connection estimates
Expected total monopile capacity2) and demand1) (kt) Expected XL monopile capacity2) and demand1) (kt)
375 440 440 265 370 370
390
340
300 380
280
260
2017 2018 2019 2017 2018 2019
Market demand Sif Sif Maasvlakte 2 addition EEW Steelwind Ambau Bladt
1) MP demand shifted 1.5 years from grid connection planning. Sif expects 88-90% of MPs to be XL
2) New EEW facility added
Source: Sif (capacity, XL %, % MP foundations); Europe Wind (total GW connected); MAKE (turbine ratings, MP weight, % MPs, all partly
extrapolated.)
18Order book for 2018 a priority
Order book (Kton) Comments
300
Order book for 2017 filled with 230 Kton contracted
Galloper, Rentel, Beatrice, Hohe See and Norther in production
200 in 2017
109 Kton contracted for 2018
Demonstrates volatile character of the project-driven industry
230
100 191 with few large projects shifting to 2021 grid connection (France,
The Netherlands)
109
0
FY 2016 FY 2017 FY 2018
Total production capacity
Order book - exclusive negotiations
Order book - contractedCommissioning of 2nd production line
20Appendices
Comparison price for offshore wind to other
  competitive energy sources
2016 LCOE – Global ranges and baselines

Source: MAKE Consultants presentation 25
January 2017

Based on the most recent offshore wind strike prices in the Netherlands and Denmark,
LCOE levels of around 55-80 EUR/MWh are expected for final investment decisions
taken in 2017.
Offshore wind industry cost reduction pathways
Offshore wind LCOE structure in 2016 Key drivers for LCOE reduction
Blades Project
Tower
1% 3% 1% Reducing cost of capital (44%)
Foundation Higher efficiency in maintenance and service (16%)
4%
Higher efficiency in transmission of energy (15%)
Turbine
Array Electrical 7% Using larger turbines (14%)
1%
Transmission Sif is nevertheless focusing on reducing costs through:
4% Faster and more flexible production with the twin line
Installation
4% Finance production facilities at Maasvlakte 2
41% Reducing welding gap
Research into integrated foundation/tower designs
OMS Integrated cost-savings with installation company
22%
T-Opex
12%
Transmission OPEX All operational, inspection
and service costs of the transmission assets of
the wind farm for its lifetime, plus any grid “A reduction in WACC from 10% to 5% would drop LCOE by over
charges
30% and the LCOE share of finance cost to below a third.”
Based on a typical 500 MW wind farm in 25m water depth
with MPs and 8 MW turbines and a 40km HVAC connection - Giles Hundleby, CEO at BVG Associates in Offshore Wind (no. 03 2016)
distance and WACC of 8.9% and FID in 2016
Source: BVG Associates | October 2016> Disclaimer
Some of the statements contained in this release that are not historical facts are statements of future projections and other forward-looking statements based on
management’s current views and assumptions and involve known and unknown risks and uncertainties that could cause actual results, performance, or events to
differ materially from those in such statements. Historical results are no guarantee for future performance. Forward-looking statements are subject to various risks
and uncertainties, which may cause actual results and performance of Sif’s business to differ materially and adversely from the forward-looking statements. Certain
forward-looking statements can be identified by the use of forward-looking terminology such
as “believes”, “may”, “will”, “should”, “would be”, “expects” or “anticipates” or similar expressions, or the negative thereof, or other variations thereof,
or comparable terminology, or by discussions of strategy, plans, or intentions. Should one or more of these risks or uncertainties materialize, or should underlying
assumptions prove incorrect, actual results may vary materially from those described in this release as anticipated, believed, or expected.
Sif does not intend, and does not assume any obligation, to update any industry information or forward-looking statements set forth in this release to reflect
subsequent events or circumstances. The content of this trading update is for information purposes only and not intended as investment advice,
or offer or solicitations for the purchase or sale in any financial instrument. Sif does not warrant or guarantee the completeness, accuracy, or fitness for any
particular purposes in respect of the information included in this release.
> www.sif-group.com
24You can also read