Aviation - 9_ - Infrastructure Report Card
←
→
Page content transcription
If your browser does not render page correctly, please read the page content below
Aviation

                   9
                ________

2021 INFRASTRUCTURE REPORT CARD
     www.infrastructurereportcard.org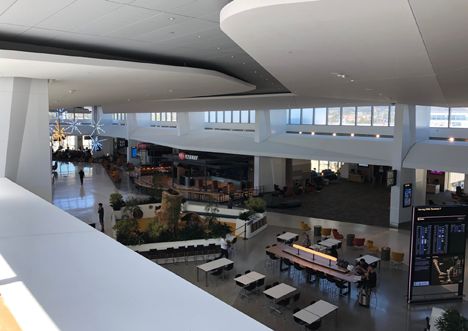
EXECUTIVE SUMMARY
                Prior to the onset of the COVID-19 pandemic, the nation’s airports were
                facing growing capacity challenges. Over a two-year period, passenger travel
                steadily increased from 964.7 million to 1.2 billion per year, yet flight service
                only increased from 9.7 to 10.2 million flights per year — contributing in
                part to a total of nearly 96 million delay minutes for airline passengers in
                2019. Terminal, gate, and ramp availability was not meeting the needs of
                a growing passenger base. Under pre-COVID-19 projections, our aviation
                system was set to have a 10-year, $111 billion funding shortfall, and that
                gap has likely grown significantly as passenger volumes dropped in March
                2020 and have yet to recover. However, funding from Congress has risen
                from $11 billion annually to approximately $15 billion from 2017 to 2020.1
                These additional investments are driving some early results as measured by
                improved economic performance.

CONDITION & CAPACITY
The National Plan of Integrated Airport Systems                         rebounded to 32% of October 2019. While passenger
(NPIAS) identifies 3,304 public-use airports in the U.S.,               volumes have endured significant and potentially
which includes approximately 520 commercial service                     sustained impacts during the pandemic, cargo volumes
airports. More than 2,500 of these NPIAS airports are                   have increased with the expansion of “e-commerce.”5
categorized as general aviation supporting flight training
                                                                        From 2017 to 2019, as passenger travel outpaced
and emergency services.2
                                                                        available flights, delays in the aviation sector grew, and
From 2017 to 2019, passenger travel steadily rose from                  the percentage of flights with “on-time” performance
964.7 million to 1.2 billion passengers per year, while                 decreased slightly from 80.1% to 79.2%.6 The total time
commercial service flights increased from 9.7 million to                passengers were delayed increased from 65.8 million
10.2 million flights per year.3 4 However, since the onset              minutes in 2017 to 95.8 million minutes in 2019. Delays
of the COVID-19 pandemic in early 2020, the aviation                    in 2019 were caused by a variety of reasons, including
sector has been dramatically impacted. In April 2020,                   aircraft arriving late, national aviation system delays, air
passenger travel was 5% of the level seen in April 2019,                carrier delays, weather-related issues, and more.7
and by October 2020, passenger volumes had only

                                                               10
                                                             ________

                                           2021 INFRASTRUCTURE REPORT CARD
                                                www.infrastructurereportcard.org
Flight Delays Over Time
 100M

                       Flight Delay Minutes
  80M

  60M

  40M

  20M

       0
                                 2017                                      2018                              2019
Source: Bureau of Transportation Statistics8

                                                 Causes of Flight Delays in 2019

                                                                            Cancelled                       Diverted
                                                                              9%                               1%

                                               Air Carrier Delay
                                                     25%

                                                                                  Aircraft Arriving Late
   Weather Delay                                                                           33%
        3%

                                         National Aviation System Delay
                                                      29%

                                                                                                           Security Delay
While several factors influence air travel delays, airport the next few years, all categories of airports will require
infrastructure continues to grapple with capacity needs investments in terminal buildings, access to terminals,
to serve the growing passenger base. The Airports Council airfield capacity, and airfield reconstruction.10
International–North America (ACI-NA) shows that over
Top Four Investment Needs as a Portion of Total Needs
for Large, Medium and Small Airports
50%
Terminal Buildings Capacity Needs
Access to Terminals Reconstruction Needs
40%
30%
46%
20%
36%
33%
10% 21%
16.7% 16.9% 14.8%
9.4% 10% 9.5% 8%
6.6%
0%
Large Hub Airports Medium Hub Airports Small Hub Airports
Source: Airports Council International–North America
11
The largest portion of the investment need at large, NPIAS airports are maintained in excellent, good, or
medium, and small airports is for terminal buildings and fair condition. In fiscal year (FY) 2019, data indicates
ranges from 30% to nearly 50% of total needs. Similarly, that 97.9% of runways at NPIAS airports are rated as
the FAA routinely publishes National Plan of Integrated excellent, good, or fair, including 97.8% of commercial
Airport Systems (NPIAS) reports of anticipated service airport runways. While the portion of NPIAS
development activities determined by surveying nationwide airports rated as excellent, good, or fair saw a slight
capital improvement plans. The NPIAS reports show that increase from 97.8% in FY 2017, commercial service
the needs for various types of airport development projects airport runways decreased from 98.2% during the
continue to increase. Since 2019, forecasts for airport same timeframe. However, both categories remained
needs to expand or rehabilitate terminal buildings ballooned unchanged from FY 2015 to FY 2017.13 14 15
by 62%, pavement reconstruction needs increased by
The COVID-19 pandemic has caused a severe decline
28%, and capacity-related development needs rose by
in flights and passenger boardings, reducing the current
31%. Specifically, capital needs for terminal buildings
capacity demand. Air carriers expect that it will take
grew from nearly $4.1 billion to more than $6.6 billion,
years to recover from this reduction in operations. The
capacity projects rose from $3.1 billion to around $4.1
long-term impacts of COVID-19 on air travel remain
billion, and reconstruction projects increased from
unclear. It is important to note that there have been
around $13.1 billion to nearly $16.9 billion.12
similar boarding declines in the past due to traumatic
Fortunately, the condition of runways continues to be events such as September 11th, but passenger travel has
consistent. The FAA sets system performance goals always ultimately rebounded and continued an upward
to ensure that a minimum of 93% of paved runways at trajectory.
12
________
2021 INFRASTRUCTURE REPORT CARD
www.infrastructurereportcard.orgPassenger Boarding Totals After Historic Events
100M
90M
80M
70M
60M
50M
40M
30M September 11th Terrorist Attacks
COVID-19 Pandemic
20M
10M
0
1/2001
9/2001
5/2002
1/2003
9/2003
5/2004
1/2005
9/2005
5/2006
1/2007
5/2008
1/2009
9/2009
5/2010
1/2011
9/2011
5/2012
1/2013
9/2013
5/2014
1/2015
9/2015
5/2016
1/2017
9/2017
5/2018
1/2019
9/2019
5/2020
Sources: Bureau of Transportation Statistics16 17
FUNDING & FUTURE NEED
Our nation’s airports have diverse revenue and funding AIP or the PFC. The AIP has had the same annual
streams, but total financial resources fall short of the sector’s authorization level of $3.35 billion for over 10 years,
estimated needs. These resources include federal, state, and and the PFC cap has remained unchanged since 2000.
local grants; revenue from general obligation bonds; airport Despite an unchanged authorization level, Congress
cash flow through concession fees and other revenue has provided recent supplemental funding for the AIP
mechanisms; and public–private partnerships (P3s). The program, including $1 billion in FY 2018, $500 million
two primary federal sources of airport revenue come from in FY 2019, and $400 million in FY 2020. The PFC
the Airport Improvement Program (AIP), which is funded has continued to collect revenue to help make capital
generally through aviation fuel and airline ticket taxes, and improvements to our nation’s airports, with the most
the Passenger Facility Charge (PFC), which is funded recent figures indicating that $3.6 billion in fees was
through a federally mandated $4.50 capped user fee. collected in 2019. While the PFC is not the sole
source of airport capital project funding, it can help
In 2018, a five-year FAA reauthorization was signed
alleviate the pre-COVID-19 pandemic, 10-year total
into law; however, the legislation failed to increase the
investment need of $237 billion.18 19 20
Photo courtesy of WSP USA
LAGUARDIA AIRPORT TERMINAL B ARRIVALS HALL
13
________
2021 INFRASTRUCTURE REPORT CARD
www.infrastructurereportcard.orgThe long-term impacts of COVID-19 are still unfolding including $100 million for general aviation. As the
for airport revenue collection. However, in the last two pandemic continues, the complex revenue streams that
COVID-19 relief packages (the CARES Act and the airports depend on for infrastructure improvements are
Consolidated Appropriations Act of 2021), Congress likely to remain in flux.
provided a total of $12 billion in direct aid to airports,
OPERATIONS, MAINTENANCE, & INNOVATION
Airport operations and maintenance activities are based to satellite-based system, NextGen replaces radio
influenced by many factors, including the age of the communications with data exchange and automation.
facilities, aircraft use patterns, and weather exposure, This ultimately reduces the amount of information
to name a few. Preventive maintenance such as seal needed to be processed by an air crew and will increase
coat surface treatment, patching, and crack-sealing routing efficiency (shorten routes), save time and fuel,
must be regularly performed to protect and preserve minimize traffic delays, increase capacity, and permit
airfield pavement, while also serving to keep long-term controllers to monitor and manage aircraft, leading to
rehabilitation costs down. Airfield pavement maintenance greater safety.22 During NextGen implementation, the
occurs on a four- to seven-year cycle, while more FAA has reported more than 15,000 hours of delay
significant repairs take place on a 15- to 25-year cycle.21 avoided through improved reroutes, more than 25,000
hours of communication time saved, and average
Technological advancements are playing a critical role
delays less than 17 minutes per flight, despite increased
in improving airport service flexibility and efficiency.
reports of severe weather and traffic. Currently,
Halfway through its multi-year investment and
NextGen capabilities are being implemented at 30 of
implementation plan, the FAA has been rolling out
the largest airports in the nation. Despite some positive
its Next Generation Air Transportation System
momentum, NextGen investments are taking about 4
(NextGen) that improves air travel safety, efficiency,
years longer than expected to translate into foundational
and predictability. While transitioning from a radar-
infrastructure that supports the new technology.23 24
Airport operations and maintenance activities are influenced by many
factors, including the age of the facilities, aircraft use patterns, and
weather exposure, to name a few. Preventive maintenance such as seal coat
surface treatment, patching, and crack-sealing must be regularly
performed to protect and preserve airfield pavement, while also serving
to keep long-term rehabilitation costs down.
14
________
2021 INFRASTRUCTURE REPORT CARD
www.infrastructurereportcard.orgPhoto courtesy of WSP USA
SAN FRANCISCO INTERNATIONAL AIRPORT HARVEY MILK TERMINAL 1
PUBLIC SAFETY & RESILIENCE
The people and commerce using the nation’s air commuter carriers, on-demand air taxis, and general
transportation system are protected by the Transportation aviation operations.27 Maintaining safe conditions
Security Administration (TSA).25 While TSA’s primary through establishing runway safety areas, practicing
focus is placed on screening areas and eliminating airplane runway incursion mitigation, and implementing wildlife
hijackings, safety goes beyond screening points. For hazard mitigation improves public safety by minimizing
instance, the COVID-19 pandemic has played a major the risk of serious accidents.28 29
role in airport safety protocols. In February 2021, TSA
The nation’s aviation system continues to be tested
implemented an executive order requiring individuals to
by natural and man-made disasters. Specifically,
wear a mask at TSA screening checkpoints and throughout
cybersecurity issues have the potential to cause harm
the commercial and public transportation systems until at
to all aspects of air travel. Aviation communication and
least May 2021.26 To support airport security, $4.9 million
passenger services, like ticketing, are highly dependent
of federal funds were spent on airport security in FY
on a strong cybersecurity network, so ensuring
2020 — consistent with federal spending since FY 2017.
safeguards to this system ensures traveler safety and
However, the NPIAS has identified that from 2021 to
system resilience. Furthermore, during and after
2025, anticipated needs for safety and security projects
natural disasters and other emergencies, airports play a
account for $1.6 billion, or nearly 4% of overall airport
major role as a gateway for urgent relief and access to
funding needs.
critical supplies. Therefore, it is important that airports
In 2018, the FAA reported 395 deaths caused by U.S. develop and exercise rapid facilities assessments and
airplanes — an increase from 347 the previous year. recovery strategies that can be efficiently and effectively
The death total includes incidents on U.S. air carriers, implemented after these types of events.
15
________
2021 INFRASTRUCTURE REPORT CARD
www.infrastructurereportcard.orgRECOMMENDATIONS
TO RAISE THE GRADE
Aviation
· Airport authorities should develop plans to improve resilience to potential
catastrophic events, whether it be seismic incidents, weather-related disasters,
cybersecurity threats, or global pandemics. Strong revenue mechanisms must be
developed that can withstand changes in passenger travel and provide long-term
revenue certainty.
· Airports should continue to invest in capacity enhancements that will accommodate
projected capacity needs based on pre-COVID-19 pandemic trends.
· Raise or eliminate the cap on the Passenger Facility Charge (PFC) to allow airports
the needed revenue to invest in their infrastructure.
· Support efforts to increase federal funding for the Airport Improvement Program
(AIP) and continue to support user fee mechanisms that fund the Airport and
Airway Trust Fund and maintain budgetary firewalls.
· Explore the use of public-private partnerships (P3s) to support existing funding efforts.
· Support innovative technology, like NextGen, that offers the ability to reduce
congestion and improve capacity.
· Continue to recognize that there needs to be a strategic balance between
infrastructure investment, enhanced safety measures, and technology
improvements, both in investment and long-term planning.
SOURCES
1. American Society of Civil Engineers, “Failure to Act: Economic Impacts of Status
Quo Investment Across Infrastructure Systems,” 2021.
2. U.S. Department of Transportation, Federal Aviation Administration, “National
Plan of Integrated Airport Systems (NPIAS): 2021-2025.”
3. U.S. Department of Transportation, Bureau of Transportation Statistics,
“Passengers: All Carriers – All Airports.”
4. U.S. Department of Transportation, Bureau of Transportation Statistics, “Flights:
All Carriers – All Airports.”
5. American Society of Civil Engineers, “Failure to Act: Economic Impacts of Status
Quo Investment Across Infrastructure Systems,” 2021.
6. U.S. Department of Transportation, Bureau of Transportation Statistics, “Annual
Airline On-Time Rankings 2003-2019.”
7. U.S. Department of Transportation, Bureau of Transportation Statistics, “Airline
On-Time Statistics and Delay Causes.”
8. U.S. Department of Transportation, Bureau of Transportation Statistics, “Airline
On-Time Statistics and Delay Causes.”
16
________
2021 INFRASTRUCTURE REPORT CARD
www.infrastructurereportcard.orgSOURCES (Cont.)
9. U.S. Department of Transportation, Bureau of Transportation Statistics, “Airline
On-Time Statistics and Delay Causes.”
10. Airports Council International–North America, “Terminally Challenged: Addressing
Aviation the Infrastructure Funding Shortfall of America’s Airports: 2019-2023.”
11. Airports Council International–North America, “Terminally Challenged: Addressing
the Infrastructure Funding Shortfall of America’s Airports: 2019-2023.”
12. U.S. Department of Transportation, Federal Aviation Administration, “Report to
Congress: National Plan of Integrated Airport Systems (NPIAS): 2015-2019.”
13. U.S. Department of Transportation, Federal Aviation Administration, “Report to
Congress: National Plan of Integrated Airport Systems (NPIAS): 2017-2021.”
14. U.S. Department of Transportation, Federal Aviation Administration, “Report to
Congress: National Plan of Integrated Airport Systems (NPIAS): 2019-2023.”
15. U.S. Department of Transportation, Federal Aviation Administration, “Report to
Congress: National Plan of Integrated Airport Systems (NPIAS): 2021-2025.”
16. U.S. Department of Transportation, Bureau of Transportation Statistics,
“Passengers: All Carriers – All Airports.”
17. U.S. Department of Transportation, Bureau of Transportation Statistics, “U.S.
Airline Passengers.”
18. U.S. Department of Transportation, Federal Aviation Administration, “Key
Passenger Facility Charge Statistics, (PFC Branch),” December 31, 2020.
19. Airports Council International–North America, “Terminally Challenged: Addressing
the Infrastructure Funding Shortfall of America’s Airports: 2021-2025.”
20. American Society of Civil Engineers, “Failure to Act: Economic Impacts of Status
Quo Investment Across Infrastructure Systems,” 2021.
21. U.S. Department of Transportation, Federal Aviation Administration, “Report to
Congress: National Plan of Integrated Airport Systems (NPIAS): 2019-2023.”
22. U.S. Department of Transportation, Federal Aviation Administration,
“Modernization of U.S. Airspace.”
23. U.S. Department of Transportation, Office of Inspector General, “FAA Needs To
Strengthen Its Management Controls Over the Use and Oversight of NextGen
Developmental Funding,” FAA Report No. AV2018030, March 6, 2018.
24. U.S. Department of Transportation, Office of Inspector General, “FAA Has Made
Progress in Implementing Its Metroplex Program, but Benefits for Airspace Users
Have Fallen Short of Expectations,” FAA Report No. AV2019062, August 27, 2019.
25. Transportation Security Administration, “Mission.”
26. Transportation Security Administration, “Coronavirus (COVID-19) Information.”
27. U.S. Department of Transportation, Bureau of Transportation Statistics,
“Transportation Fatalities by Mode.”
28. U.S. Department of Transportation, Federal Aviation Administration, “Report to
Congress: National Plan of Integrated Airport Systems (NPIAS): 2021-2025.”
29. U.S. Department of Transportation, Federal Aviation Administration, “Report to
Congress: National Plan of Integrated Airport Systems (NPIAS): 2019-2023.”
17
________
2021 INFRASTRUCTURE REPORT CARD
www.infrastructurereportcard.orgYou can also read