ESG and Impact Investing in Practice: Infrastructure Investment - Janina Slawski 13 May 2021 - Pension Lawyers Association
←
→
Page content transcription
If your browser does not render page correctly, please read the page content below

ESG and Impact Investing
in Practice: Infrastructure
Investment
Janina Slawski
13 May 2021
The Evolution of Responsible Investing

            1970’s                       1990’s            2010’s

                                     Environment, Social
   Socially Responsible
                                      and Governance
         Investing                                          Impact Investing
                                          Investing
           “SRI”
                                           “ESG”
Current Developmental Imperatives
Global growth is expected to rebound in 2021
Global growth projections Developed countries projections
(year on year % change) (year on year % change)
% 2019 2020 2021 2022
8
Advance economies growth projections
%
6,3 2019 2020 2021 2022
6 5,5 10
5 8,1
4,2 4,3 4,2 6,0
3,6 5,1 5,6
4 4,2 4,5 5
2,8 5 3,6 3,5 3,1
2,2 2,5 2,3
1,6 1,3 0,6 1,4
2
0
0
-5 -3,4
-2
-5,4
-2,4 -7,2
-4 -3,5 -10
-10,0
-6 -4,9
-15
World Advanced economies Emerging market and
US EU Germany UK China
develping economies
• Source: International Monetary Fund and Alexander Forbes InvestmentsGlobal activity will remain well below the pre-COVID-19 projections through the forecast horizon
GDP losses relative to pre-pandemic growth levels by region
%
0
-1
-2
-3
-4
-5
-6
-7
Sub-Saharan Africa Emerging market and World Advanced Economies China United States
developing economies
Source: IMF WEO January 2021 and Alexander Forbes InvestmentsSignificant Economic Damage
Detraction in SA economy to last longer than expected Without covid-19 real GDP would have grown to R3,8
trillion
Total (Gross Domestic Product - GDP)
Rtn If the economy contracts by 10% in 2020 and 3%
SARB scenario [2020 (-10%), 2021 (3,8%), 2022 (3,0%), 2023 onwards (2,0%)]
3,9
thereafter for the remainder of the decade, real GDP
NT scenario [2020 (-16%), 2021 (3,8%), 2022 (3,0%), 2023 onwards (2,0%)] reaches R3,6 trillion by the end of the decade
3,7 • R200bn permanent loss GDP
2019 level
• It will take three years to return the economy to 2019
3,5 level
3,3
If the economy contracts by 16% in 2020 and 2%
3,1
thereafter for the remainder of the decade, real GDP
reaches R3,3 trillion by the end of the decade
2,9 • R500bn permanent loss in GDP
• It will take seven years to return the economy to 2019
2,7 level
2,5
2009 2012 2015 2018 2021 2024 2027 2030
Implementation of economic reforms is a big component
that will contribute to any scenario that is better
Source: IMF, SARB, National Treasury and Alexander Forbes InvestmentsSA’s GDP in Context – More Than COVID-19 at Play
GDP performance Q2 2020 q/q % annualised, real (local currency) GDP performance Q2 2020 q/q % annualised compared with stringency index
GDP q/q % Stringency index
change
20 30 40 50 60 70 80 90 100
0
Indonesia Poland
Australia Argentina
-10 Russia
Hungary
-20 Mexico
Norway Denmark
Sweden
Japan Malaysia
-30 US
Germany
Czech Peru
Switzerland Brazil
Canada
-40 Thailand
Romania
Spain Turkey Chile Philippine
SA Colombia
-50
-60 UK
-70 India
-80
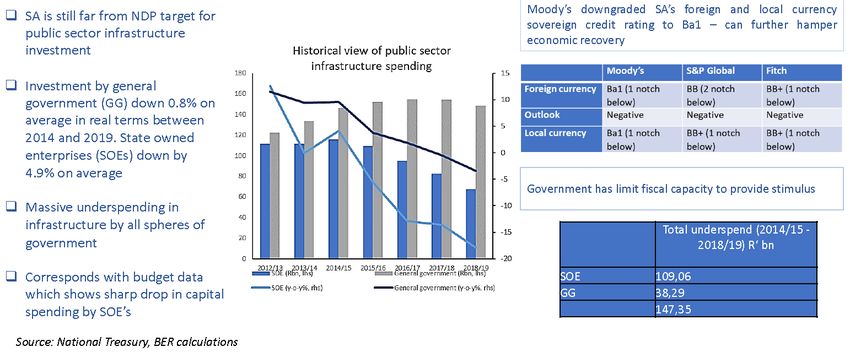
Source: Bloomberg and Alexander Forbes InvestmentsSouth Africa’s Current Economic Reality: Infrastructure
Current Discussion Items
Current Developmental
Imperatives
• National Treasury paper “Economic Transformation, Inclusive Growth, and Competitiveness:
Towards an Economic Strategy for South Africa:
• Released on 27 August 2019
• ANC’s discussion paper “Reconstruction, Growth And Transformation: Building A New, Inclusive
Economy”
• Business for South Africa’s paper “A New Inclusive Economic Future for South Africa: Delivering an
Accelerated Economic Recovery Strategy’
• Both were released on Friday 10 July 2020
• Government’s “Economic Reconstruction and Recovery Plan”
• Presented at Nedlac meeting on 13 August 2020
Common theme: invest in infrastructure in order to ignite growth in the economy and
create jobsSustainable Infrastructure Development Symposium (SIDS) Initiative
Purpose
Organised by the underspend on infrastructure and position key projects
Investment and Representatives
Infrastructure Office ASISA, Batseta, private sector institutions, multi-lateral
(IIO) in the Presidency development banks to name a few
Number of projects presented*
50 projects with value 200+ opportunities
R340bn already Total estimated value
gazetted Approximately R2.1 trillion for investment over the
next few decades
*While these were in the pipeline before the current economic crisis, there has been an urgency to fast-track these opportunities where possible to lift South Africa’s economic trajectory.Prescribed Assets?
Prescribed Assets

  • The ANC’s 2019 manifesto listed “the investigation of the introduction of prescribed assets to
    mobilise funds from financial institutions for socially productive assets” as one of its priorities
  • Prescribed assets are mentioned under the following two sections in the manifesto:
      Investing in the Economy for inclusive growth
      • Investigate the introduction of prescribed assets on financial institutions’ funds to unlock
        resources for investments in social and economic development
      Transform and Diversify the Financial Sector
      • Investigate the introduction of prescribed assets on financial institutions’ funds to mobilise
        funds within a regulatory framework for socially productive investments (including housing,
        infrastructure for social and economic development and township and village economy) and
        job creation while considering the risk profiles of the affected entities
A South African case study in Prescribed Assets • Prescribed assets were first introduced in South Africa in 1956 when pension funds were required to invest more than half of their assets into government and SOE bonds • The Prudential Investment Guidelines (PIGs) required that 53% of retirement fund assets, 33% of assets of Long Term Insurance Companies and 75% of the Public Investment Commissioners’ (now Public Investment Corporation (“PIC”)) managed assets be invested into government and SOE bonds • The Jacobs Committee of 1988 was appointed to investigate prescribed assets and the distortions introduced by this prescription; the Committee recommended that the policy be abolished • Prescribed assets in this format were abolished in the National Budget of 1989 (although prescription in terms of maximums per asset classes and exposures continue in terms of Regulation 28)
What was the opportunity cost?

        • 1960s                                                                                                                                            Opportunity
                   • Inflation averaged 3.0%; whilst                                                                       Nominal returns
                                                                                                                                                             costs
                     prescribed assets earned positive real                                                                                              Equities returns –
                     returns, they earned -6.4% p.a. versus                                                                                              Prescribed Assets
                                                                                                                              Prescribed
                     equities over the decade                                                                      Equities                  Inflation         returns
                                                                                                                                assets
        • 1970s                                                                                                                                            = “Opportunity
                   • Inflation averaged 11.3%, prescribed                                                                                                       Cost”
                     assets earned 7.3%, equities returned                                                 1960s   11.3%        4.9%          3.0%             -6.4%
                     24.5%; the opportunity cost of investing
                     in prescribed assets versus equities was                                              1970s   24.5%        7.3%         11.3%            -17.2%
                     -17.2% p.a.
        • 1980s                                                                                            1980s   20.2%        13.5%        14.5%             -6.7%
                   • Inflation averaged 14.5%, the
                     opportunity cost of investing in
                     prescribed assets versus equities was -
                     6.7% p.a.

Source: Gill Raine, Senior Policy Advisor at ASISA, Presentation to ASSA Investment Seminar 13 June 2019
Proposed Amendments to Regulation 28
Amendment of Regulation 28

   “The proposed review to Regulation 28 is informed by a number of calls for
 increased investment in infrastructure given the current low economic growth
                                    climate.”

    “…before making an investment in and while invested in an asset, consider any
  factors which may materially affect the sustainable long-term performance of the
   asset, including infrastructure investment, taking into account the necessary due
  diligence and risk adjusted returns in the best interest of the fund and its members
                           and avoiding conflicts of interests.”
Amendment of Regulation 28
• Given the concerns that infrastructure investment would be forced via prescription, the fact that the
proposed changes represent maximums rather than minimums is reassuring
• Main limit change proposed is a splitting out of Private Equity from the Alternatives (Private Equity,
Hedge Funds and Other) category
• Private Equity increased from 10% to 15%
• No limit across these three categories i.e. funds can invest a total of 27.5% across the three versus the current 15% maximum
• Introduces subcategories of infrastructure across several asset classes i.e. equities, bonds, property, own
employer, Private Equity, Hedge Funds
• Overall limit on infrastructure across these assets classes would be 45%, plus 10% in Africa infrastructure
• The definition of infrastructure is however proposed to be narrow i.e. “Public installations, structures,
facilities, systems, services or processes in respect of which projects may be designated as strategic
integrated projects”
• Few funds would invest into the public strategic integrated projects that this definition envisages, and therefore few are likely
to breach to maximums proposedProposed Amendments to Regulation 28
• The proposed narrow definition of Infrastructure is unlikely to lead to increased
allocations
• More funds may allocate to private equity funds, but not necessarily infrastructure-
related
• No increases are proposed to unlisted debt which is where infrasture allocaitons are
more likely
And in addition:
Many investors cannot increase allocations to illiquid or unlisted investments as they
need liquidity to pay member benefits
• Defined contribution funds also offer daily unit values and ability to switch between
investmentsLiquid Investment Opportunities
• Finding ways to make investment more liquid or listed will result in a wider
base and depth of investment:
• Green bonds
• Project bonds
• Existing Development Finance Institutions
• e.g. Investment Development Corporation (IDC) and Development Bank of
South Africa (DBSA)
• Infrastructure funds large enough to generate liquidityNew Investor Pools
• South African retirement funds can provide some of the required funding, but
not all
• Other new asset pools are required, and specifically from international investors:
• Sovereign Wealth Funds, Infrastructure Funds, Pension Funds, Trusts, Foundations, etc.
• Investment from local investors is important to these investors
• Governance oversight, compelling investment returns, well managed risks are all critical
An investor-friendly environment is imperative: prescription would
be contrary to thisCase Studies
Renewable Energy Independent Power Producer Procurement Programme (REIPPP)

                                                            •   The REIPPP has made a significant impact on the economy, job creation, community
       Background                                               upliftment, economic transformation and climate change
       • The REIPPP was a                                   •   Renewable IPPs have created 38 701 jobs years for youth and women from the surrounding
         competitive tender                                     communities
         process designed to                                •   Local communities have benefited from over R1 billion spent by IPPs on education by
         facilitate private sector                              upskilling teachers, providing extra teachers and classrooms, as well as awarding over 600
                                                                bursaries to students from disadvantaged communities
         investment into grid-
                                                            •   The programme has provided health facilities while contributing to social development
         connected renewable
                                                                through feeding schemes, supporting old age homes and early childhood development
         energy generation                                  •   It has helped to establish more than 1 000 small enterprises
       • In an 8-year period it                             •   Broad-based black participation has been secured across the value chain through community
         attracted                                              participation, including in engineering, procurement, construction, operations and
         R209.4 billion in                                      maintenance contractors where black ownership amounts to 21%
         committed private                                  •   The REIPP programme’s contribution has meant that South Africa’s carbon emission is reduced
         sector investment                                      by about 33.2 million tonnes (Mton) carbon dioxide (CO2) and water savings of 39.2 million
                                                                kilolitres achieved by 31 December 2018

Source: Department of Energy Press Release, February 2019
Financial Sector Charter
Background Impact
• The Financial Sector Charter (the Charter) came into effect in January 2004 as a • Opportunities were found to
result of a voluntary offer to develop an industry transformation Charter by the invest in projects that gave an
financial sector at the National Economic Development and Labour Council attractive return to investors
(Nedlac) Financial Sector Summit whilst meeting the
• The Financial Sector Code (FSC) commits all participants to actively promote a requirements of the Charter
transformed, vibrant and globally competitive financial sector that reflects the • Housing, Infrastructure,
demographics of South Africa, which contributes to the establishment of an Agriculture, Schools, SME
equitable society by providing accessible financial services to black people and by financing, etc.
directing investment into targeted sectors of the economy • No prescription was required …
• Specific targets have been set in respect of “targeted investments” being • Investors were seeking
transformational infrastructure black agricultural financing, affordable housing, opportunities and successfully
black business growth and SME funding invested with attractive
returns
Source: Financial Sector CodeTHANK YOU
You can also read