Cape Town City Profile - Frost & Sullivan
←
→
Page content transcription
If your browser does not render page correctly, please read the page content below
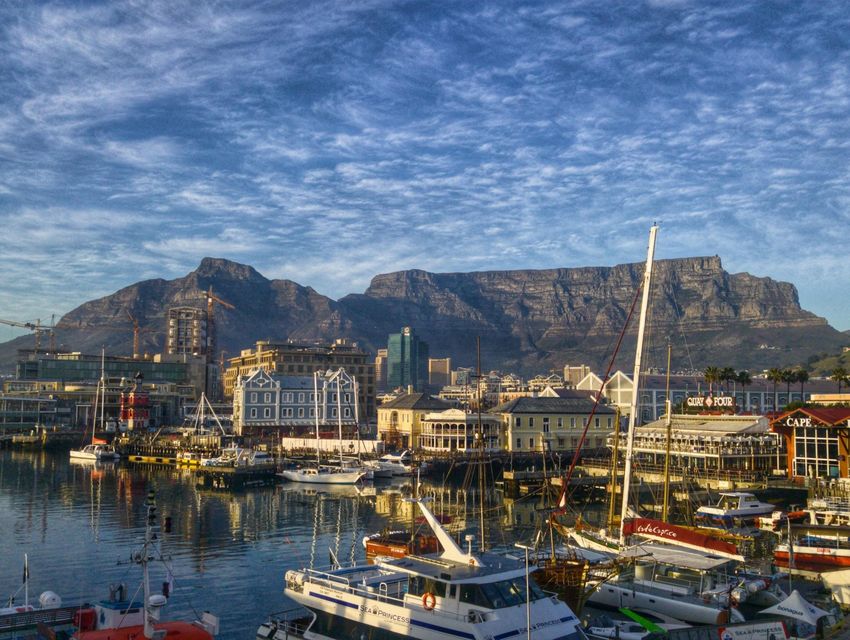
Cape Town City Profile
Cape Town – Smart City Attractiveness
Cape Town has a robust long term transport vision which aims to enhance access to affordable public-
transport and reduce the strain on the city’s limited urban road network

        Population                       Public Transport                     Private Vehicles              New Mobility

 3.69m                                 29%         (modal share)              888,000(parc)             ~3        services
    The City is the second                 Offers a completely                   37% of the City’s      • Carsharing
       most populous                    contactless fare collection           population use private    • Carpooling
    metropolitan region in                       system                      transport to commute to    • Ridehailing
      South Africa after                                                               work
       Johannesburg

                 Digital Strategy                                          Public Policy                     EV Charging

                    4 Pillars                                            Reformist                       10     public charge
 Cape Town’s digital strategy is built upon four
 pillars: Digital government, Digital Inclusions, Digital              The cities policies are geared    stations in the city run
 Economy, Digital Infrastructure.                                     towards addressing the legacy      operated at BMW
 Cape Town wants to increase transparency,                             of apartheid spatial planning     dealerships and local
 enhance service delivery and promote citizen                         and infrastructure development     shopping malls
 engagement through ICT

                                                                                                                                    2
Cape Town at a Glance
Cape Town is South Africa’s legislative capital. 63% of the Western Cape’s labour force is in Cape Town of
which 50% are employed in commercial services
5,000 Population (000s) Population Density 6,000
4,000 5,000
4,000
3,000
3,000
2,000
2,000
1,000 1,000
0 0
2010
2011
2012
2013
2014
2015
2016
2017
2018
2019
2020
2021
2022
2023
2024
2025
Age split of Cape Town’s population, 2017 Cape Town Overview
0 – 14 yrs 16 – 64 yrs 65+ yrs
Wards: 116
12% 34% 3%
Area size: 816 km²
Level of elevation: 0m (sea level)
12% 36% 3% Population: 3,698,000 (2017)
Density: 4,532 inhabitants per km2
Population 24% 70% 6%
Source: City of Cape Town, Frost & Sullivan
3Cape Town Transportation Mode Shares
The City of Cape Town is aiming to put public transport as the core means by which people commute. It’s
promised to do this by increasing public transport stops within 500m of each citizen’s household.
5% 1% 7%
1%
39%
50%
44% 51%
2000 2016
Walking Public Transport Private Transport Cycling
• Cape Town’s public transport system consists of government rail and bus services as well as privately run but
publicly accessible minibuses which operate under local government licensing, regulation and arbitration
KEY • South Africa is a “car economy.” 39% of persons in Cape Town commute by private transport.
TAKEAWAY • The City of Cape Town and Western Cape governments actively promote cycling as an alternative form of
transport. It however remains the least common form of transport in the city. With new investments in cycle lines
and pedestrian paths over the coming budget period could see an uptick in these more eco-friendly forms of
travel
* Estimates based on the City of Cape Town’s 2032 Transport Plan. Source: TDA, City of Cape Town, Frost & Sullivan
4Snapshot of Transportation Modes – Motorization rates & Fares
39% of Capetonians drive their own vehicle to work. With 51% making use of either public transport or
publicly accessible by privately owned mini-bus services. Public transport use, especially bus, is
increasing
Daily Users of Public Transport Total number of Buses Total Number of Taxis and PHVs
(2016-2017)
Bus:
• MyCiti – 60 000
• Golden Arrow – 220 00
1423 15,600
Urban Rail:
• Metro Rail – 360 000
Total length of bus
Average Fares
rapid transit lanes 58
56.9 57 56.8
221 R8.50
216 218
32km 53.8
206
203 Prepaid R11.5
Cash 23
Total road network
length
2012 2013 2014 2015 2016 R13 per KM
2012 2013 2014 2015 2016
11 696km
Motorization Rate per 1000 Total Two-Wheeler Vehicles*
Source: City of Cape Town, Oica, eNatis; Frost & Sullivan
5Conventional Vehicle Parc
The city’s motorisation rate has steadily increased over 5 years with almost 40 of the city’s citizen making
use of a private or company car to commute. Reducing car ownership is a priority for the City’s
government
1000 225
900
220
800
700 215
Thousands
600 210
500
400 205
300 200
200
195
100
0 190
2012 2013 2014 2015 2016
PV parc total LCV parc (total) Motorization rate per 1000
• Cape Town’s motorisation rate has steadily increased over the past 5 years to reach 220 vehicles per 1000
persons in 2016. In the last 15 years car ownership in Cape Town increased by 100%
• This is above the national average which is reported at 176.
KEY
TAKEAWAY • The predominant form of transport for people outside of public transport and taxi services are private or
company vehicles
• The number of registered light commercial vehicles in Cape Town did not increase at the rate that
passenger vehicles did with only 26 000 more vehicles being registered in 2016 than 2012
Note: South Africa does not report data on powertrain Source: eNatis; NAAMSA; Frost & Sullivan
6New Energy (Hybrid and Electric) Vehicle Parc – Total Market
(Nationally)
Electric and hybrid vehicles are under pressure as the South African automotive market continues to
extend its 3 year sales decline
EVs Registered in Cape Town
100 Total number of
charging points
90
in Cape Town:
80
70
60
50
40 10
30
20
10
0
2013 2014 2015 2016
• The City is actively promoting the use of electric buses to reduce the carbon emissions and
improve the city’s air quality
KEY • Capetonians’ use of EV and hybrid vehicles remains limited with a only 8-10 electronic vehicle
TAKEAWAY charging points located in the Cape Town metropolitan area.
• The following electric vehicles are available in South Africa: Nissan Leaf, BMW i3, BMWi 8
• The Toyota Prius, Lexus C200, and Honda CR-Z are a some of the retailed hybrids in South Africa
Note: South Africa does not report data on powertrain Source: eNatis; NAAMSA; Frost & Sullivan
7Technology Trends and Outlook
The Western Cape has the highest percentage of internet users in South Africa with 93% having mobile or
desktop access to the internet. Cape Town’s aim is to be the most connected city in South Africa
MyCiti’s myconnect contactless card can be
used to load travel credit as well as transact
as a debit card for store purchases
5G
Parking
myconnect
93%
16 data of population are Roll out as early as
sensors 45,000
collection
internet users
points in the
city Pollution
streetlights
running
2020 - trials
sensors Lighting energy currently taking
Key efficient place
figures LEDs
2500 traffic
lights Intelligent
Traffic Control
Traffic
Traffic Control
Centre
management Cape Town’s
Centre
Freeway
Management
Key
System (FMS)
partners
suppliers monitors over
155kms of An
• Syntell
• Nitivei Ayalon freeway 24/7
• TMT
• Israel Ministry of Transport
with over 250 estimated55% South Africa will
• Cooperation from the Municipalities
CCTV cameras of Capetonians reach
have a smartphone
22.5Mn
Internet users by
2018
Source: City of Cape Town, Frost & Sullivan
8Mayor’s Transport Strategy
The Mayor’s office and city government have adopted the Transit Oriented Development Strategic
Framework (TOD) which outlines eight principles of urban development for transport
Transit Orientated Strategic Framework
Reduced energy
Reduced direct and
consumption and
indirect costs for
emissions
households and
employers
TOD
Sustainable and Economic growth
affordable public
transport
Compact development, transit adjacent land
use (mixed use and high density)
Key Takeaway:
The City of Cape Town has two overarching priorities for the future development of the City:
1. Prioritizing the necessary investment in key areas to reduce commuting times, and reduce transport costs
2. Enhancing the accessibility of public transport and non-motorised transport to al residents of the city
Source: City of Cape Town, Frost & Sullivan
9Regulatory Outlook: Cape Town
Cape Tows regulations and policies are rooted in the City’s strategic aim of creating a caring, safe,
inclusive, well run city of opportunity.
Key Targets & Investment Bus Policy
- The MyCiti BRT is the city’s core platform for
- Cape Town is a services driven economy. The largest urban connectivity.
recipients of foreign direct investment in the city are information - The City’s plan for integrated transport is
and communications technology, real estate, tourism, codified in the Integrated Public Transport
transport, and business services. Network 2032 plan. The key modes will be
The passenger rail, BRT, quality bus and
- Cape Town’s 2017/2018 budget outlines the following top 3 minibus-taxi services
areas of expenditure (79%)
- The policy of the City government is to use
- Informal Settlements, Water & Waste Services (34%)
multi-modal solutions to link disparate
- Transport & Urban Development Authority (26%) suburbs of the Cape Metro. Most of which
- Energy (19%) will be road-based
- One of the key targets in the 2017 budget is the allocation of - 10 new trunk routes with dedicated lanes will
8% of the Transport & Urban Development Authority budget to come online in 2032
the Non-Motorised Transport Programme which consists of
pedestrian and cycling infrastructure and facilities across the
city
Pollution Related Deaths City Budget
- On the digital front the city has allocated funds to the following:
- An e-Tendering system to manage tender processing
(0.49m USD) - The total city budget for 2016 was 3.13b
- Integration and enhancement technology for project USD/44.3b ZAR
management (0.92m USD)
- Expanding broadband to build the “Metro Area - Operating Budget – 85%
Telecommunications Network” (18.4m USD) - Capital Budget – 15%
- Smart City Strategy to provide wireless internet to all
municipal libraries (0.25m USD) - A combined 29% of the budget was spent
on transport and transport capital
projects
Source: Frost & Sullivan
10Freight in Cape Town
Road-based freight places significant pressure on the city’s infrastructure. Congestion due to freight
transportation cost the city millions in dollars each year in capital expenditure and maintenance.
13% LGV
Freight traffic as a percentage of Logistics Regulation:
total road traffic
4% HGV Level – Moderate
Freight
Traffic LA has the highest level of emission limits for
commercial vehicles in USA. However, there is no
known Access regulations for commercial vehicles.
Non Freight The City is working with industry and national government to
Traffic shift 3% of freight from road to rail transport by 2040
The following regulations, policies and legislation govern freight in Cape
Town. Freight Rail
National Level
• National Land Transport Act, 2009 (Act 5 of 2009) Modal
• National Road Traffic Act, (1996) LCV
• White Paper on National Transport Policy (1996) Split
Provincial
• Provincial Government Western Cape’s Strategic Objective 1, 3, 4
and 5
• White Paper on Western Cape Provincial Transport Policy (1997) Truck
City of Cape Town Documentation
• TCT: Comprehensive Integrated Transport Plan (CITP) 2006-2011
• CCT Freight Strategy (July 2006) (draft)
• TCT: Comprehensive Integrated Transport Plan (CITP) 2013-2018
Source: Frost & Sullivan
11Snapshot of New Mobility Services Offered in Cape Town
Uber has firmly established itself as the on-demand transport solution for most Capetonians. Car-sharing
and private shared shuttles are service offerings that have yet to achieve widespread use.
Bike hiring/sharing
Car sharing Ride sharing
Private Shared Shuttle
Ride hailing Integrated Mobility
Source: Frost & Sullivan
12Key quotes from interviews
Cape Town is smart, but in its own right. It’s not a
Smart City, but the global standard. The Cape Town is quite connected
government is going to need do more than just but you have to factor in
digitization if it wants to become like a Dubai affordability. Can the
government afford it and can the
citizens afford it when people
are so poor?
Cape Town has higher than the
national average internet
penetration but the City’s There are a number of commercial
wireless broadband rollout will entities making use of smart
need to be accelerated if its to technologies in energy which are
meet government targets benefited and occasioned by
photovoltaic systems
Source: Frost & Sullivan
13Cape Town as a Smart City
Cape Town’s metro government’s smart city journey began at the turn of the century. With the launch of
the Open Data Portal Cape Town is moving to making the government more accessible and transparent
The Digital City Smart Transport Smart Energy
• Digital government is one of the • By 2032 it aims to have a public transit • Cape Town is moving towards a low
four pillars of the City’s smart city point of departure with 500m walking carbon economy
drive. distance of the entire city’s population • The City has embarked on an
• Digitisation allows for greater • With the launch of the myciti BRT and extensive retrofitting exercise of
transparency, promotes citizen contactless travel cards the city will
legacy infrastructure
engagement and enhances move towards enhancing public
transport technologies, such as onboard
• The City is driving diversification in
service delivery its energy supply with a strong focus
wifi and electric and hybrid buses with
• Digital inclusion: The city is closing the aim to reduce emissions, congestion on renewable energy technologies
the digital gaps in the city through and the number of work-hours lost due like solar PV
greater access, enhancing digital to due to commuting • The City aims to reduce it’s
skills and “promoting digital • By 2032 the City aims to have a dependency on the national grid
initiatives” integrated multi-modal public transport • initiatives”
• The city aims to extend 1300km of system with enough routing
fibre broadband by 2021 infrastructure and technology to remove
the reliance on private motor vehicle
transport
Open Data Portal
launched
First online
Unicity SAP ERP Citizen Portal transaction via e- Broadband fibre
established
Smart Phase 1
Transport launched mail service portal phase 1 completed
Smart City SmartCape SAP ERP C3 notification Broadband MICT focus Launch of “Digital Digital City
Strategy launch Phase 2 system fibre roll-out in IDP
commences
Gateway to Africa”
$x Work Group
Dec 2002
Dec 2000
June 2012
July 2002
Feb 2015
July 2009
June 2014
March 2013
April 2007
Sept 2003
July 2008
Dec 2014
2012
2000
Source: City of Cape Town, Frost & Sullivan
Smart Energy
14You can also read