E-MOTICON e-MObility Transnational strategy for an Interoperable COmmunity and Networking in the Alpine Space.
←
→
Page content transcription
If your browser does not render page correctly, please read the page content below
e-MOTICON
e-MObility Transnational strategy for
  an Interoperable COmmunity and
  Networking in the Alpine Space.
        Milan, March the 26th, 2019
              European Regional Development Fund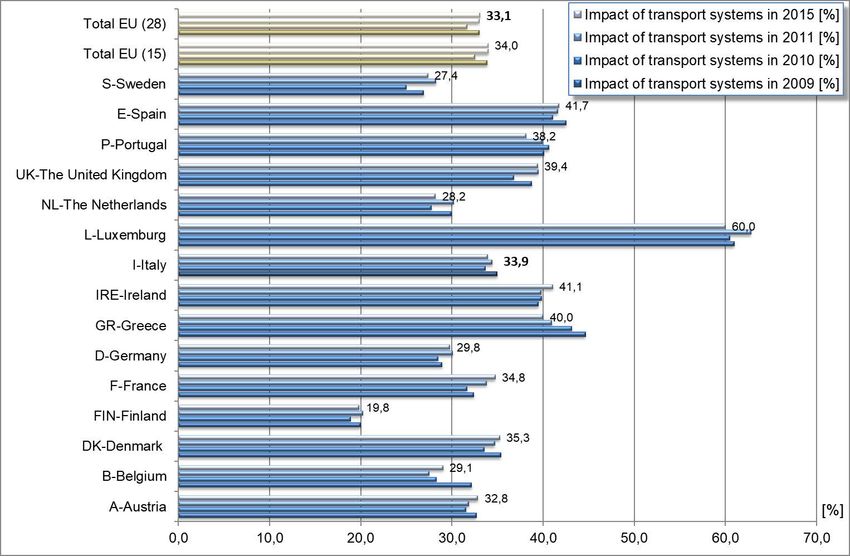
Why and to what extent are transport systems
         worthy of electrification?

                    Prof. Bruno DALLA CHIARA
       POLITECNICO DI TORINO, Dept. DIATI – Transport systems

                        European Regional Development Fund
Oltre un secolo fa…

More than one century ago…
How much the transport systems impact the use of energy?
The transport field, whose role in the modern, post-
industrial economies has nowadays become essential, is the
only sector to be almost exclusively based upon a sole
primary source, i.e. oil:
• indicatively, 96% in Europe in 2011, approx. 94% in 2016/17;
• 93-94% in North America (2011) then 92% (2016 and 2017).
The other sectors, on the other hand, are based upon a
mixed heterogeneity of energies
1900… 2019
Transport accounted for half of global oil consumption until a few years ago; in 2017:
~55-60%.
The impact in Europe (EU-25 then 27) of the transport systems in the overall use of the
energy consumed (33% in 2011 and 2016/17 in toe) is > by nearly 10% versus the world
average (20.42% in 2003, +1-4% in the following 10 years), on the grounds of the
greater motorised average mobility versus other continents (individual, not motorised,
mobility).
[Source: EIA – Energy Information Administration, International Energy Outlook, June 2006; UP 2014 and 2017, Data book]
B. Dalla Chiara, Politecnico di Torino – Dept. DIATI- Transport Engineering, March 2019
EU (2010), Transport systems:
                                                                                                                                                 CO2 at 24,3%, energy use ≈31,7%
                                                                                                                                                  EU (2018), Transport systems:
                                                                                                                                                  CO2 -> 30%, energy use ≈33%

Sources: Eurostat and Databook, “Energia e Petrolio in Italia” 2012, 2013, 2014, 2015, 2017 by “Unione Petrolifera” ‐ European Commission, Mobility and transport, “ Pocketbook 2013 ”
Urban population in the world, since 1950 until 2030
                                                                                                                                                         Urban population
                                                                                                                                                              (51%)
                                  9
                                  8                                                                                   Rural population
                                  7
          Population (billions)

                                  6                                         World population
                                  5
                                  4
                                  3
                                  2
                                  1
                                  0
                                      1950   1955   1960    1965    1970    1975     1980    1985     1990    1995     2000    2005     2010    2015     2020   2025   2030

                                                                                                                                                          Hypothesis

                                                              The urban population of the EU-27 amounted to
                                                                    73% of the total population in 2008

  Population of Europe was approx. 743 106 on Feb. 2019; Europe population is equivalent to
9.8% of the world population; 74.5 % of the population is urban (553,6 million people in 2019)
                                                           [Source: EU energy and transport in figures, Statistical Pocketbook 2010, p. 18; Worldometer 2019]
¾ of population
                          in the EU:

 for transport:
~94% toe from
crude oil in the                              ¼ emissions from
       EU                                   human activities in the
                                            EU towards 1/3 in 2018
 from primary
                          Transport
    energy                                      Environment
                           systems
    sources

 >½ of global
 consumption
  of crude oil         ~1/5 of global
                   consumption of energy;
    Energy             1/3 at EU level
    carriers
The transport field is mainly characterised by the use of vehicles with distributed
energy use, with the exception – in general terms – of the
     transport systems operating on fixed installations (rail, rope, metros, APM)

Almost all these transport systems are based upon oil derived fuel, and the
alternatives are featured by significant limits; the transport systems operating on fixed
installations do not strictly depend on it (electrical lines supplied by power stations)
and, according to a belief widespread in the literature, allow better use of energy.
EU-25, consumption
of transport
modalities in
1990,
2004
2010, in ktoe
~85%, I
(EC, 2007 and EU Transport –
Statistical Pocketbook 2012).
~1.6-3%, I
These numbers are
not so recent but have
been conservative in
the last 10-15 years.
Consumption by transport modality in 1990, 2004 and 2010, in 1000 toe, tonne(s) of oil equivalent
[Source : Campbell, 2007 ; EU Transport – Statistical Pocketbook 2012 ]Evolution of the light and heavy-duty vehicles in Italy
Nearly the Italian population without
the underage and nearly equal to the
number of driving licencesHow much the use of energy impacts the different transport modes?
Road transport
Rail transport and other transport installations
(Air transport)
(Maritime transport and by inland waterways)Cost structures are becoming increasingly similar throughout the road haulage sector. The relative importance of the two main cost drivers (labour and fuel costs) has now reached comparable levels throughout the EU. […] The variations of costs related to fuel range from 24% to 38% of total costs. [Report from the Commission to the European Parliament and the Council on the State of the Union Road Transport Market, Brussels, 14.4.2014, COM(2014) 222 final]
Impact on the running cost of energy consumption in railways,
subways and tramways
∼ 4-5%, indicatively, for the Italian railways, on the overall running cost, according
to some recent data [current unofficial data]
∼ 11% for ATM in Milan, taken as an example, as energy cost on the 2009 budget,
approximately 50% (5.3%) for rail systems and subway in the specific case [official
data, 2009];
∼6% as energy impact on the budget in case of the traction for the VAL automated
metro in Turin, plus an equivalent value for other electric power supply means
[indicative data, 2009].
∼ 3.7% for Ferrovie Nord, energy for tractionEU WHITE PAPER
Roadmap to a Single European Transport Area
– Towards a competitive and resource efficient
transport system
Brussels, 28.3.2011 - COM(2011) 144 final
“17. The challenge is to break the
transport system’s dependence on oil
without sacrificing its efficiency and
compromising mobility.”
European Regional Development FundTransport and emissions: general situation EU in various
fields (not only transport systems)
CO2 Renewables Energy efficiency
27% by 2030 (2014) 27% by 2030 (2014)
-40% of the 1990
32% (2018) 32.5% (2018)
levels by 2030
EU, 24.10.2014: constraining values at European level, indicative at national level;
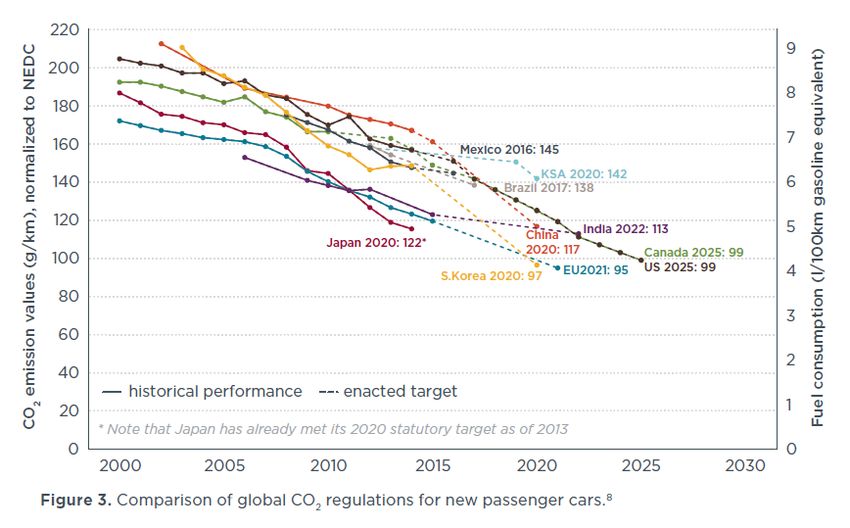
substitute previous target 20-20-20EU mean CO2 emissions of newly matriculated
passenger cars
Light-duty freight vehicles
175 gCO2/km
Light-duty freight vehicles
147 gCO2/km
2013 is the first year in which the average
CO2 emissions were below the 2015
emission targetB. Dalla Chiara, Politecnico di Torino - DIATI- Transport Engineering, March 2019
Permitted
                                                      Averaging
Pollutant                Concentration                          Legal nature                                           exceedences
                                                      period
                                                                                                                       each year
Fine particles (PM2.5)   25 µg/m3                     1 year           Target value entered into force 1.1.2010              n/a
                                                                       Limit value entered into force 1.1.2015
Sulphur dioxide (SO2)    350 µg/m3                    1 hour           Limit value entered into force 1.1.2005               24
                         125 µg/ m3                   24 hours         Limit value entered into force 1.1.2005                3
Nitrogen dioxide (NO2)   200 µg/ m3                   1 hour           Limit value entered into force 1.1.2010               18
                         40 µg/ m3                    1 year           Limit value entered into force 1.1.2010*              n/a
PM10                     50 µg/m3                     24 hours         Limit value entered into force 1.1.2005**             35
                         40 µg/m3                     1 year           Limit value entered into force 1.1.2005**             n/a
Lead (Pb)                0.5 µg/m3                    1 year         Limit value entered into force 1.1.2005 (or             n/a
                                                                     1.1.2010 in the immediate vicinity of specific,
                                                                     notified industrial sources; a 1.0 µg/m3 limit
                                                                     value applied from 1.1.2005 to 31.12.2009)
Carbon monoxide (CO)     10 mg/m3                     Max. daily 8 h Limit value entered into force 1.1.2005                 n/a
                                                      mean
Benzene                  5 µg/m3                      1 year         Limit value entered into force 1.1.2010**               n/a
Ozone                    120 µg/m3                    Max. daily  Target value entered into force 1.1.2010             25 days averaged
                                                      8 hour mean                                                        over 3 years
Arsenic (As)             6 ng/m3                      1 year      Target value entered into force 31.12.2012                 n/a
Cadmium (Cd)             5 ng/m3                      1 year           Target value entered into force 31.12.2012            n/a
Nickel (Ni)              20 ng/m3                     1 year           Target value entered into force 31.12.2012            n/a
Polycyclic Aromatic      1 ng/m3 (expressed           1 year           Target value entered into force 31.12.2012            n/a
Hydrocarbons             as concentr. of Benzo(a)pyrene)
                                          B. Dalla Chiara, Politecnico di Torino - DIATI- Transport
                                                      Engineering, March 2019
Primary energy Energy carrier Use in transport systems
Diesel, gasoline,
ICEs for road
Internal combustion engines
Crude oil cherosene, gas
vehicles
(LPG)
ICEs for
Natural gas Gas, LNG locomotives and
installations
Fuels
Fossil
Fuels from
Coal ICEs for ships
synthesis
Nuclear sources
(Uranium, Hydrogen Jet
Plutonium)
Electric motors
Wind Batteries
Hydroelectric Power production
Fuel cells
plants
Renewable
(electrochemical)
Sun
Geothermal
Electric power
Biomass Other uses
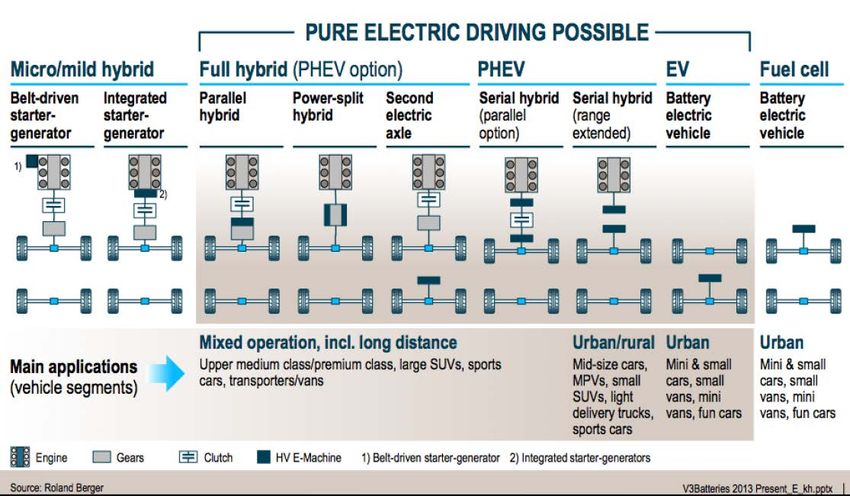
(Source: elaboration from ERTRAC, 2011)Li-P,Li-ion
New systems Al/Air Li/Air
Zn/Air
Li-polymer
Wh/l
Li-metal
5 mm prismatic cellsFeatures of travels
Frequency of travels
Urban and suburban motorised mobility
High frequency (5-6 days/week),
Usability of electric traction (FEV, HEV)
Urban mobility
Long-distance motorised mobility
Low frequency (1-3 days/week)
Usability of internal combustion engines (ICE automobiles)
A flexible automobile for the driver: both independent traction and recharging
Distance
Short distance travels: ~4-25 km
Long distance travels (1-2 days/week, in case)
(4.6-6.2 km in urban contexts)
Daily average distances in Italy: 32.1 - 38.7 km, according to various sourcesData analysis: dendrogram scheme
ModelJourney length frequency [FCA] https://www.sciencedirect.com/science/article/pii/S0967070X17305243
1200
1000
Highway The 10% of the trips made along
Absolute Frequency
highways is shorter than 20 km, the
800
35% between 20 and 60 km; trips
600
over 100 km are more than 55%.
400
200
0
0 20 40 60 80 100 120 140 160 180 200 220 240
[km]
The 90% of the trips done
100% by users in extra urban
2,8%
The 35% of urban trips done by users context is shorter than 30
90%
in Europe cover a distanceThe Well to Tank (WTT) evaluation accounts for the energy expended and
the associated GHG emitted in the steps required to deliver the finished fuel
into the on-board tank of a vehicle. It also considers the potential availability
of the fuels, through their individual pathways and associated costs.
The Tank to Wheels (TTW) evaluation accounts for the energy expended and
the associated GHG emitted by the vehicle/fuel combinations. It also
includes an assessment of the expected relative retail prices of the various
vehicle configurations.
We refer to the Well to Wheels (WTW) integration, giving a global
assessment of the energy required and the GHG emitted per km driven on
the fuel/vehicle combinations considered.
MJ t MJ t MJ f
WTW
= WTT ⋅ TTW
km MJ
f km Motorised road
transport
Urban
recharging
possibilities
FEVs
Hybrids
ENERGY: COUNTRY
PHEV
Natural gas
ICEsNorway
The “zero emissions incentives” include:
a) No purchase/import taxes (1990-)
b) Exemption from 25% VAT on purchase (2001-)
c) No annual road tax (1996-)
d) No charges on toll roads or ferries (1997- 2017).
e) Charges were introduced on ferries with upper limit of maximum 50% of full price (2018-)
f) Charges on toll roads were introduced with upper limit of maximum 50% of full price (2019)
g) Free municipal parking (1999- 2017)
h) Parking fee for EVs was introduced locally with an upper limit of maximum 50% of full price (2018-)
i) Access to bus lanes (2005-).
j) New rules allow local authorities to limit the access to only include EVs that carry one or more passengers (2016)
k) 50 % reduced company car tax (2000-2018).
l) Company car tax reduction was lowered to 40% (2018-)
m) Exemption from 25% VAT on leasing (2015)
n) Fiscal compensation for scrapping of fossil vans when converting to a zero emission van (2018)
o) Allowing holders of driver license class B to drive electric vans class C1 (light lorries) up to 2450 kg (2019)
The current Government has decided to keep the incentives for zero emission cars until the end of 2021. The VAT
exemption for zero emission cars in Norway has been approved by EFTA Surveillance Authority (ESA) until the end of 2020.
After 2021 the incentives will be revised and adjusted parallel with the market development.
European Regional Development FundNorway: ~506 passengers cars /1000 inhabitants (Eurostat 2016); ~ 5.3 million inhabitants ; 10% circulating plug-in in 10 years!
Source: EAFO, 2019
Net substitution rate
Years   (ricambio auto al netto delle vendite)
1994
1995                   3,72%
1996                   5,17%
1997                   6,98%
1998                   5,68%
1999                   5,31%                                                The average value of the
2000                   5,87%                                                net substitution rate in the last ten
2001                   5,41%
2002                   5,48%                                                years is 3,98%, which brings to nearly
2003                   4,88%                                                80% in 20 years.
2004                   7,58%
2005                   4,54%
2006                   4,89%
2007                   5,98%
2008                   4,87%
2009                   5,24%
2010                   4,35%
2011                   3,78%
2012                   3,87%
2013                   3,83%
2014                   3,36%
2015                   3,52%
2016                   3,48%
2017                   3,50%
                                                 European Regional Development Fund
Conclusions
Pursue a better use of transport systems and related
infrastructures in terms of quality, safety, security and
efficiency – of engines and the whole transport
system – also (not only) with the use of “ITS”
Green, connected motor vehicles, assisted guidance
then possibly autonomous
Energy efficiency, more independence from crude oil, ITS Contacts Bruno DALLA CHIARA, associate professor, ph.d. eng. (bruno.dallachiara@polito.it) POLITECNICO DI TORINO, Engineering, Department DIATI – Transport Systems corso Duca degli Abruzzi, 24 -10129 Torino - Italy – EU References 1. Dalla Chiara B., “Considerations on the demand and use of energy in the transport systems / Considerazioni sulla domanda ed impiego di energia nei sistemi di trasporto”, Ingegneria Ferroviaria, vol. LXV, ISSN: 0020-0956. N. 7-8, July-August 2010 2. Dalla Chiara B., Pellicelli M. (2016), Sustainable road transport from the energy and modern society points of view: Perspectives for the automotive industry and production, Journal of Cleaner Production, http://dx.doi.org/10.1016/j.jclepro.2016.06.015 3. Dalla Chiara B., Pede G, (a cura di) Valentini M.P., Coviello N., Deflorio F., Trasporti terrestri ed energia - Tecnologie, metodi ed applicazioni, Autori Coviello N., Dalla Chiara B., Deflorio F.P., Pede G., Valentini M.P.286 pp, EGAF, ISBN 978-88-8482-776-0 4. Dalla Chiara B., “Why and to what extent are transport systems worthy of electrification?”, Keynote speech, Evento finale PROGETTO e-MOTICON Mobilità elettrica: un viaggio interoperabile attraverso lo Spazio Alpino 26 Marzo 2019, Palazzo Lombardia, Milano
You can also read