PKN ORLEN - ORLEN. FUELLING THE FUTURE PKN ORLEN - Capital Group presentation
←
→
Page content transcription
If your browser does not render page correctly, please read the page content below

PKN ORLEN

                   PKN ORLEN – Capital Group presentation
                           ORLEN. FUELLING THE FUTURE

February 2019
PKN ORLEN – one of the biggest oil&gas companies in Europe (1)

BUSINESS SEGMENTS

Refining
  Refineries located in Poland, Lithuania and the Czech Rep. with total max. crude
  oil throughput of 35,2 mt/y
  Strategic location with an access to crude oil, product pipelines and sea terminals
  REBCO crude oil processing allows to benefit from Brent/Ural differential
  Diversification of crude oil supplies
Petchem
  Petrochemical assets fully integrated with refining
Energy (industrial cogeneration)
  More than 1000 MWe from new CCGT blocks in Włocławek and Płock

  Ca. 2800 fuel stations – the largest retail network in Central Europe
  Over 2000 Stop Cafe (coffee corners including convenience stores)

  Over 210 m boe 2P reserves in Poland and Canada
                                                                                        LEADER IN CENTRAL EUROPE
  Average production ca 18 th. boe/d
                                                                                                                   2 2
PKN ORLEN – one of the biggest oil&gas companies in Europe (2)

SHAREHOLDERS STRUCTURE                                           KEY DATA 2018

                                                                         PLN               PLN
                                            State Treasury
                                                                         8,3               2,8
Others                                                                    bn                bn

                                                                                      Record-high
                                                                    EBITDA LIFO      EBITDA in Retail
                                                                                         Record-high
                                                                                       EBITDA in Retail
                                          Polish pension funds

Shareholders structure as of 28.12.2018
                                                                        42,9              33,4
                                                                          mt                mt

                                                                     Record-high      Record-high
                                                                    sales volumes      throughput

PKN ORLEN listed on WSE since 1999
INDICES:                                                                                  PLN
                                                                         211
                                                                                          3,0
WIG, WIG20, WIG30, WIG Poland, WIG Paliwa                               m boe
                                                                                        per share
Market capitalization:                                              2P oil and gas
ca. PLN 44,8 bn (as of 31.01.2019)                                     reserves        Dividend

                                                                                                          3 3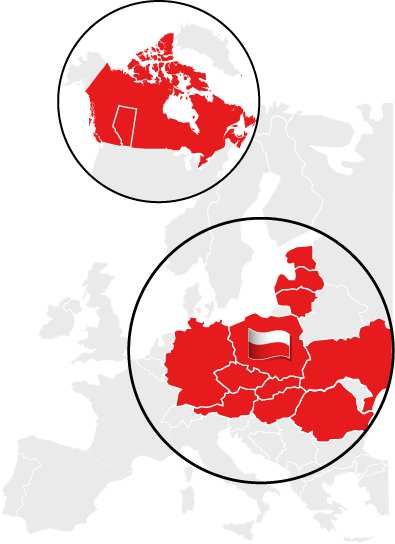
Downstream
Refining
                                                                COMPETITIVE ADVANTAGES
                           REFINING                              Refinery in Plock classified as a super-site (acc. to
                                                                 WoodMackenzie) considering the depth and throughput
                                                                 capacity as well as integration with petchem

                                                                 Diversification of crude oil and security of natural gas supplies
PLN 3,7 bn                                                       Prepared for changes in regulatory and market trends due to
                                                                 execution of investment projects
EBITDA LIFO                                                      Leader in the fuel market in the Central Europe*

KEY DATA                                                        THROUGHPUT AND UTILIZATION RATIO
                                                                mt; %         Utilisation ratio
   Max. throughput capacity is 35,2 mt/y, of which: 16,3 mt/y
   Płock, 10,2 mt/y ORLEN Lietuva and 8,7 mt/y Unipetrol
                                                                             91%                                      94%       95%
                                                                   90%                            90%       86%
   Ca. 70% of crude oil throughput is REBCO, which allows to                             84%
   benefit from B/U differential

   Long-term contracts secure ca. 50% of throughput capacity.
   Remaining crude is bought on spot market.

   Wholesale market share: gasoline (PL: 66%, CZ: 59%, LT:
   77%) and diesel (PL: 55%, CZ: 58%, LT: 79%)
                                                                   2012      2013        2014     2015     2016       2017      2018
Data as of 31.12.2018
* Poland, Lithuania, the Czech Republic                                                                                                4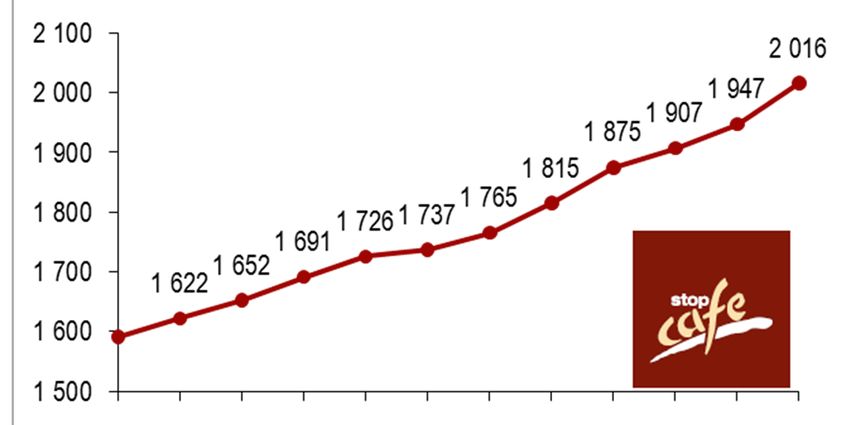
Downstream
Petrochemicals
                                                                           COMPETITIVE ADVANTAGES
            PETROCHEMICALS                                                  The largest petrochemical company in Central Europe*

                                                                            Petchem assets integrated with refining allows savings

                                                                            Attractive portfolio of products including: monomers,
PLN 2,3 bn                                                                  polymers, aromatics, PTA, fertilizers and PVC

                                                                            Strategic regional supplier for chemical industry
EBITDA LIFO

KEY DATA                                                                   ANWIL – CHEMICAL COMPANY
   Sales in 2018 amounted to 5,0 mt                                         PVC and fertilizers producer
   Market share ca. 40% - 100% depending on the product
                                                                            Ethylene pipeline connection with Plock refinery secures
   PX/PTA – one of the most advanced petrochemical complex in
                                                                            feedstock for PVC production
   Europe with PTA production capacity of 690 kt/y
   Construction of Polyethylene Unit in Unipetrol and Metathesis            Synergies with a new CCGT block in Włocławek – steam,
   Unit in Płock in progress                                                electricity and infrastructure
   Petrochemicals Development Program
   CAPEX: PLN 8,3 bn till 2023; EBITDA: PLN 1,5 bn yearly
           building of Aromatics Compound complex
           development of Olefins complex
           development of Phenol capacity
           supported by extension of research and development facilities
* Poland, Lithuania, the Czech Republic                                                                                                5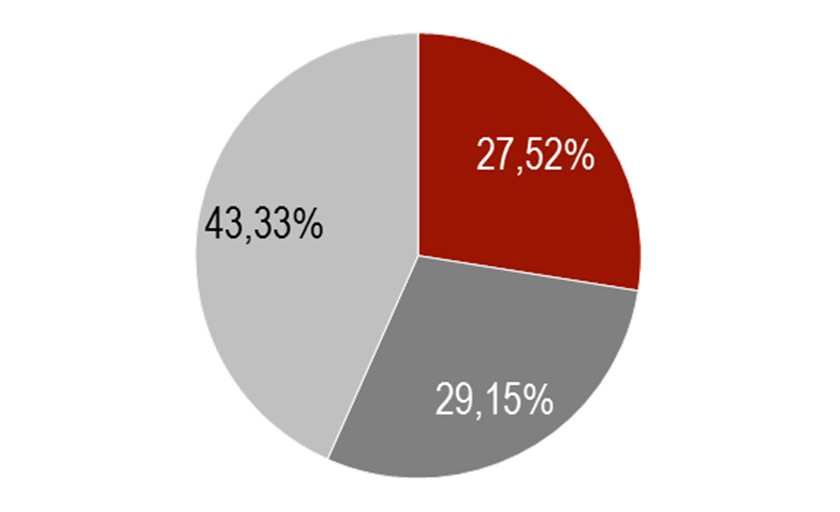
Downstream
Energy
                                                                  COMPETITIVE ADVANTAGES
                        ENERGY                                       ORLEN Group – one of the key producers of electric power and
                                                                     heat used in a big portion for own purpose. Electric power
                                                                     production is ca. 4,7 TWh.
                                                                     ORLEN Group possess energy units in 3 countries, of which:
                                                                        the biggest industrial block in Poland: EC Płock (415 MWe,
                                                                        2150 MWt).
                                                                        modern Combined Cycle Gas Turbines in Poland:
                                                                        CCGT Włocławek and CCGT Płock. In total over 1000 MWe.
                                                                     PKN ORLEN – one of the biggest gas consumers in Poland, ca.
                                                                     2,5 bn m3. In total gas consumption is ca. 2,7 bn m3.

LOW-EMISSION ENERGY PROJECTS                                      INSTALLED THERMAL CAPACITY
                                                                  MWt
    PKN ORLEN holds concessions for the construction of a
    wind farm in the Baltic Sea with a maximum capacity of
    1200 MWe.
                                                                                3 658              1 399          1 040
    The license is valid until mid-2020. This deadline may be                  POLAND              CZECH           LT*
    extended by 2 years after PKN ORLEN takes steps to                                              REP.
    obtain a building permit (geological surveys, environmental
    studies, connection conditions).
    The investment process, in the case of a positive             INSTALLED ELECTRICAL CAPACITY
    evaluation of the project, could start in 2023.               MWe
                                                                  POLAND
                                                                                                                          1600
                                                                  CZECH REP.
                                                                                142
                                                                  LITHUANIA
Data as of 31.12.2018                                                                 160
* LT - Lithuania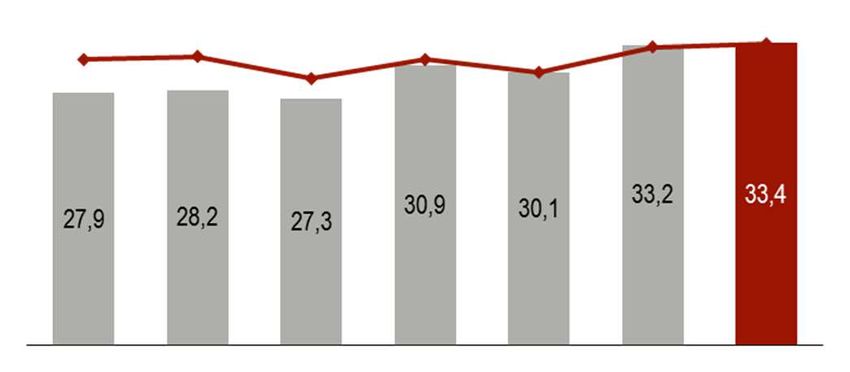
Retail

                                                                     COMPETITIVE ADVANTAGES
                               RETAIL                                    Modern and the largest network of fuel stations in Central
                                                                         Europe*

                                                                         ORLEN – strong, recognizable and the most valuable brand in
                                                                         Poland (PLN 4,7 bn)

PLN 2,8 bn                                                               Attractive loyalty programs

EBITDA LIFO                                                              Dynamic growth of non-fuel offer by launching new Stop Cafe
                                                                         locations including convenience stores O!SHOP

KEY DATA                                                             STOP CAFE LOCATIONS
                                                                     #                                                  +201
   2803 fuel stations, of which: 1787 Poland, 582 Germany, 409
   Czech Rep., 25 Lithuania
   Market share: 34% Poland, 23% Czech Rep., 6% Germany,
   5% Lithuania
   2016 Stop Cafe locations, of which: 1667 Poland (including 354
   O!SHOP), 270 Czech Rep., 56 Germany and 23 Lithuania
   In 2018 we sold 47,8 million hot-dogs (1,5 per second) and ca.
                                                                             1 591
   12,5 million litres of coffee (almost 6 olympic swimming pools)
   At the end of 2018 very large group of loyal customers: 0,6
   million active FLOTA customers and 5,0 million active VITAY            1Q16 2Q16 3Q16 4Q16 1Q17 2Q17 3Q17 4Q17 1Q18 2Q18 3Q18 4Q18
   customers
Data as of 31.12.2018
* Poland, Lithuania, the Czech Republic                                                                                                 7
Upstream

                                                                                       COMPETITIVE ADVANTAGES
                       UPSTREAM                                                           Flexible response to changes in the oil and gas market

                                                                                          Adjusting capital expenditure plans to the macro situation

                                                                                          Leveraging segment synergies in Poland and Canada
PLN 0,3 bn
EBITDA LIFO*

TOTAL RESERVES OF CRUDE OIL AND GAS (2P)                                              Total reserves of crude oil and gas (2P)
                                                                                      Ca. 13 m boe (4% liquid hydrocarbons, 96% gas)
                                                                                                                                                   POLAND
                  211 m boe                                                           EBITDA*: PLN 18 m
                                                                                      CAPEX: PLN 206 m

AVERAGE PRODUCTION IN 2018
                                                                                      Total reserves of crude oil and gas (2P)
                18,0 th. boe/d                                                        Ca. 198 m boe* (56% liquid hydrocarbons, 44% gas)            CANADA
                                                                                      EBITDA*: PLN 284 m
 Poland: ca. 1,0 th. boe/d (100% gas)
                                                                                      CAPEX: PLN 534 m
 Canada: ca. 17,0 th. boe/d (47% liquid hydrocarbons)

Data as of 31.12.2018
* Data before impairments of assets in amount of PLN (-) 82 m regarding mainly upstream assets
                                                                                                                                                            8
PKN ORLEN competitive advantages
                      Integrated, high-class assets and strong position on competitive market
                      New units and attractive portfolio of products offered on developing markets
                      Best locations and synergies of gas-fired power plants with other segments
         Value
                      Modern and the largest sales network in the region with strong and recognizable
         creation     brand
                      Upstream assets in Poland and Canada – cautious continuation strategy

                      The World’s Most Ethical Company 2018
                      Top Employer Polska 2019
                      Platts TOP250 – 45th place among the largest energy companies in the world
         People
                      The Best Annual Report 2017
                      IR Magazine Awards „Best in Central & Eastern Europe” for the best IR in the
                      region and „Best ESG communications” for PKN ORLEN

                      Diversified financing
                      Average maturity in 2021
         Financial
                      Investment grade: BBB - stable outlook (Fitch), Baa2 stable outlook (Moody’s)
         strength
                      Financial gearing – below 30%
                      Net debt / EBITDA LIFO – below 2
                      Dividend – paid every year since 2013
                                                                                                        9
Thank you for your attention For more information on PKN ORLEN, please contact Investor Relations Department: phone: + 48 24 256 81 80 fax: + 48 24 367 77 11 e-mail: ir@orlen.pl www.orlen.pl
Agenda

         Supporting slides

                             11 11
Dividend
Our goal is to pay dividend regularly
When planning the amount of dividend per share (DPS), we
also take into account maintaining a safe level of financial
ratios PLN
PLN
We paid dividend in years 2013-2018 3,00 3,00
per share per share
In 2018 we paid one of the highest dividend in the history
(PLN 3,00 per share) PLN
2017 2018
2,00
per share
PLN 2016
1,65
per share
PLN 2015
1,44
per share
PLN
1,50 2014
per share
2013
12 12ORLEN Lietuva - maximizing the possessed potential
Ventspils
(20,0 mt/y)
Latvia
Pump station
Illukste
Terminal
(16,4 mt/y)
Joniskis Polock
Butinge* Biržai Storage depot
Orlen Lietuva
Mažeikių
(14,0 mt/y) Refinery
Nafta Crude pipeline
Klaipeda
Products pipeline
(9,0 mt/y)
* ORLEN Lietuva ownership
Lithuania
Concentration on cash flow improvement
Due to overheads and employment costs reduction below USD 10 m per month as well as implementation of efficiency initiatives,
EBITDA LIFO is higher by over 1 USD/bbl
CAPEX optimised
Sales efficiency improvement and higher capacity utilization
Ready for temporary shutdown when macro will worsen
13 13Unipetrol – continuation of operating efficiency improvement
Litvínov
5.4 mt/y
Kralupy Paramo*
IKL pipeline 3.3 mt/y 1.0 mt/y
10 mt/y
Druzhba pipeline Mero crude oil pipelines
9 mt/y CEPRO production pipelines
CEPRO depots
Speed up of operational excellence initiatives in Ceska Rafinerska
Refining and retail sales enhancement due to grey zone limitation
Investments in petchem projects
Market share and non-fuel sales increase in retail
* Paramo refinery in Pardubice does not process crude oil since the end of 2012. It focuses on bitumen and lubricants production. 14 14Supply routes diversification
Sea terminal (capacity) (70) Primorsk
Kirishi
Oil pipeline [capacity] (30) Ust-Luga Yaroslavi
Projected Oil pipeline
(18) Ventspils
BPS2
Refinery of PKN ORLEN Group Butinge DRUZHBA
(14)
Mazeikiai
Naftoport (10.2; 10.3) Novopolotsk
Refinery (capacity m tonnes p.a.; Rostock (30) (8.3; 7.7)
[Ca 30]
Nelson complexity index) Holborn
[Ca 22]
(3.8; 6.1) Schwedt Gdansk
(10.7; 10.2) (10.5; 10.0)
Harburg Mozyr
DRUZHBA
(4.7; 9.6) (15.7; 4.6)
Plock [Ca 55]
Leuna (16.3; 9.5)
(11.0; 7.1) Litvinov (5.4, 7.0)
Kralupy TrzebiniaJedlicze
(0,1) Drogobich
Ingolstadt IKL [Ca 10] (3.3; 8.1) (0,5) Brody
(3.8; 3.0)
(5.2; 7.5) Bratislava
Burghausen [Ca 9] [Ca 20] DRUZHBA
Bayernoil (6.0; 12.3) Kremenchug Lisichansk
(3.5; 7.3) [Ca 9] (17.5; 3.5)
(12.8; 8.0) [Ca 3,5] Tiszaojvaro (8.5; 8.2)
Schwechat
Duna s
(10.2; 6.2) Petrotel Rafo
ADRIA (8.1, 10.6) (2.6; 7.6) (3.4; 9.8) Yuzhniy Kherson
Petrobrazi (ex 4) (6.7; 3.1)
Triest Rijeka Novi Sad
Odessa
(4.4; 5.7) ADRIA (3.4; 7.3) (3.8; 3.5)
Sisak (4.0; 4.6) Arpechim
(ex 12)
(3.9; 4.1) (3.6; 7.3)
Pancevo Petromidia Novorossiys
(4.8; 4.9) (5.1; 7.5) k
Neftochim (ex 45)
(5.6; 5.8)
Thessaloniki Izmit
(3.2; 5.9) (11.5; 6.2)
Kirikkale
Izmir (5.0; 5.4)
Elefsis (10.0; 6.4)
Aspropyrgos
(4.9; 1.0)
(6.6; 8.9)
Batman
Corinth
(1.1; 1.9)
(4.9; 12.5)
Source: Oil & Gas Journal, PKN Orlen own calculations, Concawe,Reuters, WMRC, EIA, NEFTE Compass, Transneft.ru
15Disclaimer
This presentation (“Presentation”) has been prepared by PKN ORLEN S.A. (“PKN ORLEN” or “Company”). Neither the Presentation nor any copy hereof may be copied,
distributed or delivered directly or indirectly to any person for any purpose without PKN ORLEN’s knowledge and consent. Copying, mailing, distribution or delivery of this
Presentation to any person in some jurisdictions may be subject to certain legal restrictions, and persons who may or have received this Presentation should familiarize
themselves with any such restrictions and abide by them. Failure to observe such restrictions may be deemed an infringement of applicable laws.
This Presentation contains neither a complete nor a comprehensive financial or commercial analysis of PKN ORLEN and of the ORLEN Group, nor does it present its position
or prospects in a complete or comprehensive manner. PKN ORLEN has prepared the Presentation with due care, however certain inconsistencies or omissions might have
appeared in it. Therefore it is recommended that any person who intends to undertake any investment decision regarding any security issued by PKN ORLEN or its subsidiaries
shall only rely on information released as an official communication by PKN ORLEN in accordance with the legal and regulatory provisions that are binding for PKN ORLEN.
The Presentation, as well as the attached slides and descriptions thereof may and do contain forward-looking statements. However, such statements must not be understood as
PKN ORLEN’s assurances or projections concerning future expected results of PKN ORLEN or companies of the ORLEN Group. The Presentation is not and shall not be
understood as a forecast of future results of PKN ORLEN as well as of the ORLEN Group.
It should be also noted that forward-looking statements, including statements relating to expectations regarding the future financial results give no guarantee or assurance that
such results will be achieved. The Management Board’s expectations are based on present knowledge, awareness and/or views of PKN ORLEN’s Management Board’s
members and are dependent on a number of factors, which may cause that the actual results that will be achieved by PKN ORLEN may differ materially from those discussed in
the document. Many such factors are beyond the present knowledge, awareness and/or control of the Company, or cannot be predicted by it.
No warranties or representations can be made as to the comprehensiveness or reliability of the information contained in this Presentation. Neither PKN ORLEN nor its directors,
managers, advisers or representatives of such persons shall bear any liability that might arise in connection with any use of this Presentation. Furthermore, no information
contained herein constitutes an obligation or representation of PKN ORLEN, its managers or directors, its Shareholders, subsidiary undertakings, advisers or representatives of
such persons.
This Presentation was prepared for information purposes only and is neither a purchase or sale offer, nor a solicitation of an offer to purchase or sell any securities or financial
instruments or an invitation to participate in any commercial venture. This Presentation is neither an offer nor an invitation to purchase or subscribe for any securities in any
jurisdiction and no statements contained herein may serve as a basis for any agreement, commitment or investment decision, or may be relied upon in connection with any
agreement, commitment or investment decision.
16For more information on PKN ORLEN, please contact Investor Relations Department: phone: + 48 24 256 81 80 fax: + 48 24 367 77 11 e-mail: ir@orlen.pl www.orlen.pl
You can also read