CHESAPEAKE ENERGY 2017 Q4 EARNINGS - February 22, 2018 - Chesapeake Energy ...

Page created by Victor Fitzgerald
 
CONTINUE READING
CHESAPEAKE ENERGY 2017 Q4 EARNINGS - February 22, 2018 - Chesapeake Energy ...
CHESAPEAKE ENERGY
             2017 Q4 EARNINGS

February 22, 2018
CHESAPEAKE ENERGY 2017 Q4 EARNINGS - February 22, 2018 - Chesapeake Energy ...
FORWARD-LOOKING STATEMENTS

This presentation includes “forward-looking statements” within the meaning of Section 27A of the Securities Act of 1933 and Section 21E of the Securities Exchange Act of 1934.
Forward-looking statements are statements other than statements of historical fact. They include statements that give our current expectations, management's outlook guidance
or forecasts of future events, production and well connection forecasts, estimates of operating costs, anticipated capital and operational efficiencies, planned development drilling
and expected drilling cost reductions, anticipated timing of wells to be placed into production, general and administrative expenses, capital expenditures, the timing of anticipated
asset sales and proceeds to be received therefrom, the expected use of proceeds of anticipated asset sales, projected cash flow and liquidity, our ability to enhance our cash flow
and financial flexibility, plans and objectives for future operations, the ability of our employees, portfolio strength and operational leadership to create long-term value, and the
assumptions on which such statements are based. Although we believe the expectations and forecasts reflected in the forward-looking statements are reasonable, we can give
no assurance they will prove to have been correct. They can be affected by inaccurate or changed assumptions or by known or unknown risks and uncertainties.

Factors that could cause actual results to differ materially from expected results include those described under “Risk Factors” in Item 1A of our annual report on Form 10-K and
any updates to those factors set forth in Chesapeake's subsequent quarterly reports on Form 10-Q or current reports on Form 8-K (available at http://www.chk.com/investors/sec-
filings). These risk factors include the volatility of oil, natural gas and NGL prices; the limitations our level of indebtedness may have on our financial flexibility; our inability to
access the capital markets on favorable terms; the availability of cash flows from operations and other funds to finance reserve replacement costs or satisfy our debt obligations;
downgrade in our credit rating requiring us to post more collateral under certain commercial arrangements; write-downs of our oil and natural gas asset carrying values due to low
commodity prices; our ability to replace reserves and sustain production; uncertainties inherent in estimating quantities of oil, natural gas and NGL reserves and projecting future
rates of production and the amount and timing of development expenditures; our ability to generate profits or achieve targeted results in drilling and well operations; leasehold
terms expiring before production can be established; commodity derivative activities resulting in lower prices realized on oil, natural gas and NGL sales; the need to secure
derivative liabilities and the inability of counterparties to satisfy their obligations; adverse developments or losses from pending or future litigation and regulatory proceedings,
including royalty claims; charges incurred in response to market conditions and in connection with our ongoing actions to reduce financial leverage and complexity; drilling and
operating risks and resulting liabilities; effects of environmental protection laws and regulation on our business; legislative and regulatory initiatives further regulating hydraulic
fracturing; our need to secure adequate supplies of water for our drilling operations and to dispose of or recycle the water used; impacts of potential legislative and regulatory
actions addressing climate change; federal and state tax proposals affecting our industry; potential OTC derivatives regulation limiting our ability to hedge against commodity
price fluctuations; competition in the oil and gas exploration and production industry; a deterioration in general economic, business or industry conditions; negative public
perceptions of our industry; limited control over properties we do not operate; pipeline and gathering system capacity constraints and transportation interruptions; terrorist
activities and cyber-attacks adversely impacting our operations; an interruption in operations at our headquarters due to a catastrophic event; certain anti-takeover provisions that
affect shareholder rights; and our inability to increase or maintain our liquidity through debt repurchases, capital exchanges, asset sales, joint ventures, farmouts or other means.

In addition, disclosures concerning the estimated contribution of derivative contracts to our future results of operations are based upon market information as of a specific date.
These market prices are subject to significant volatility. Our production forecasts are also dependent upon many assumptions, including estimates of production decline rates
from existing wells and the outcome of future drilling activity. Expected asset sales may not be completed in the time frame anticipated or at all. We caution you not to place
undue reliance on our forward-looking statements, which speak only as of the date of this presentation, and we undertake no obligation to update any of the information provided
in this presentation, except as required by applicable law. In addition, this presentation contains time-sensitive information that reflects management's best judgment only as of
the date of this presentation.

We use certain terms in this presentation such as “Resource Potential,” “Net Reserves” and similar terms that the SEC’s guidelines strictly prohibit us from including in filings with
the SEC. These terms include reserves with substantially less certainty, and no discount or other adjustment is included in the presentation of such reserve numbers. U.S.
investors are urged to consider closely the disclosure in our Form 10-K for the year ended December 31, 2017, File No. 1-13726 and in our other filings with the SEC, available
from us at 6100 North Western Avenue, Oklahoma City, Oklahoma 73118. These forms can also be obtained from the SEC by calling 1-800-SEC-0330.

                                                                                                                       Q4 2017 EARNINGS               2
CHESAPEAKE ENERGY 2017 Q4 EARNINGS - February 22, 2018 - Chesapeake Energy ...
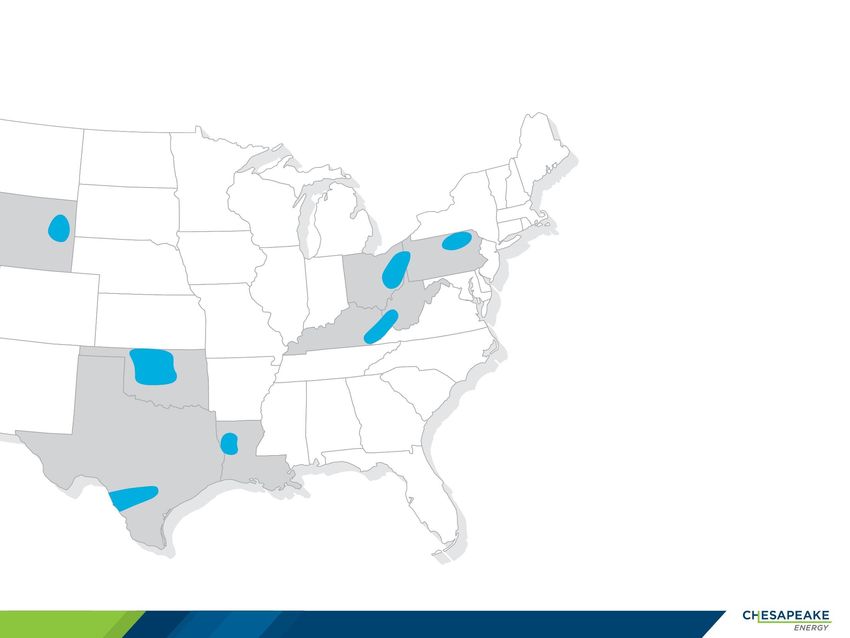
4Q’17 FINANCIAL AND OPERATIONAL RESULTS

                                                                     (1)                                                      (1)

                                                                                                                                                 Inclusive of capitalized interest

          Over 4X higher than 4Q 2016                                                       83% increase over 4Q 2016                              Down 24% from 3Q 2017

                                                                                                                                                                           (2)

             9% increase over 3Q 2017                                                        16% increase over 3Q 2017                            6% decrease over 3Q 2017

(1) See non-GAAP reconciliation on pages 11 and 12
(2) Cash costs defined as lease operating expenses combined with general and administrative expenses (excluding stock-based compensation)

                                                                                                                                            Q4 2017 EARNINGS   3
UPDATE ON RECENT PROGRESS

         Cash proceeds from divestitures
             ˃ ~$500 million in asset sales signed in late 2017
               and 2018; expected to close in 1H 2018
                      • Represents an EBITDA multiple of 7.1x

             ˃ ~$74 million in net proceeds from sale of FTSI shares

             ˃ Pursuing multiple large transactions

         Current liquidity is strong

              ~$3.1 billion                                                                            ~$450 million
              Revolver availability                                                                    In pending receipts (2)
              as of January 31, 2018 (1)

(1) Approximately $533 million borrowed on revolving credit facility and includes approximately ~$137 million of letters of credit
(2) At January 31, 2018 and includes proceeds from planned asset sales, FTSI sale of ~4.3 million shares and a positive legal settlement.

                                                                                                                                            Q4 2017 EARNINGS   4
WHAT’S THE IMPACT?

                                        Sold ~23,000 boe/d (25% oil), yet 2018 adjusted
                                        production still projected to grow ~3%

                                                                                          (1)
                                        Cost structure reduced by ~$0.14/boe

                                        Interest expense may be reduced by up to ~$50 million annually

                                        Overhead reduction of ~$70 million through efficiencies and synergies

                                        Remaining FTSI ownership of ~22 million shares

                       We expect to be cash flow positive
            + with signed/closed A&D activity at current strip prices in 2018

(1) Includes production expenses and gathering, processing and transportation expenses.

                                                                                                Q4 2017 EARNINGS   5
(1)
        PREMIER, DIVERSIFIED ASSET BASE

                                                                                                      MARCELLUS
                                                                                                      1 rig
        POWDER RIVER BASIN
        ~4 rigs
                                                                                                      ~$1.60 – 2.20/mcf Breakeven
                                                                                                      Acreage ~577,000 (86% Held)
                                                                                                                                                                                  ~4.7 million
        ~$25 – 35/bbl Breakeven                                                                                                                                                   Net acres
        Acreage ~275,000 (72% Held)                                  UTICA
                                                                     2 rigs
                                                                     ~$1.35 – 1.80/mcf Breakeven
                                                                     Acreage ~938,000 (87% Held)
                                                                                                                                                                                  ~13,300
                                                                                                                                                                                  Undrilled locations
        MID-CONTINENT
                                                                                                                                                                  150
        ~1 rig
        ~$30 – 40/bbl Breakeven                                                                                                                                                           TIL Count
                                                                                                                                                                  125
        Acreage ~806,000 (97% Held)

                                                                                                                                                                  100

                                                                                                                                                                       75

                                                                                                                                                                       50

                                                                                      HAYNESVILLE
                                                                                                                                                                       25
                                                                                      3 rigs
                                                                                      ~$2.00 – 2.50/mcf Breakeven
                                                                                      Acreage ~358,000 (90% Held)                                                      0
                                                                                                                                                                            Q1 2018   Q2 2018    Q3 2018    Q4 2018

        EAGLE FORD                                                                                                                                                            Gulf Coast              Rockies
        ~4 rigs                                                                                                                                                               Appalachia North        Appalachia South
        ~$30 – 40/bbl Breakeven                                                                                                                                               Mid-Continent           South Texas
        Acreage ~245,000 (97% Held)

(1) Net acreage at December 31, 2017 is proforma for announced Mid-Continent asset divestitures and excludes approximately 1.5 million of “Other” net acreage;
2018 estimated average rig count; PV10 breakeven with oil held flat at $55/bbl and gas held flat at $3/mcf

                                                                                                                                                                 Q4 2017 EARNINGS           6
Appendix

Q4 2017 EARNINGS   7
HEDGING POSITION
        AS OF 2/19/2018 (1)

              Natural Gas                                                                           Oil                                           NGL
                          2018                                                                      2018                                          2018

                                   5%                                                                   5%
                                  Collars                                                              Collars   $39.15/$47/$55/bbl                                   4% NGL
                                                         $3.00/$3.25/mcf
                                                                     HH                                                        WTI                                     Swaps

                           63%                                                                       74%
                          Swaps                                    $3.11/mcf                        Swaps               $52.87/bbl (2)
                                                                         HH                                                   WTI
                                                                                                                                         5% Propane Swaps $0.73/gal
                                                                                                                                          5% Ethane Swaps $0.28/gal
                                                                                                                                         10% Butane Swaps $0.88/gal

          • ~10.7 mmbbls of 2018 LLS-WTI oil basis hedges @ +$3.32
          • ~57.7 bcf of January – October 2018 TGP Zone 4 gas basis hedges @ -$0.77
          • ~5.7 bcf of January – February 2018 Tetco M3 gas basis hedges @ +$2.12
          • ~3.3 mmbbls of 2019 oil hedged with swaps at an average price of $56.04

(1) Does not reflect January 2018 and February 2018 gas settlements
(2) Oil swaps include 5% 2H18 calls (extendable calls) expected to be exercised at $52.87 per bbl

                                                                                                                             Q4 2017 EARNINGS      8
DEBT MATURITY PROFILE
        2018 OUTLOOK (1)

         $9.2 billion                       7.10%         $533 million
         Senior Notes & Term Loan           WACD          Revolving Credit Facility

                     $3,000
                                                                                                  Revolving Credit Facility
                                                                                                  Secured
                     $2,500
                                                                                                  Unsecured
                                                            $2,047                                Convertibles
                     $2,000                                               $1,868

                     $1,500
        $ millions

                                                                                                $1,300                   $1,300
                                                                                                            $1,250

                     $1,000

                                                   $665
                                     $533
                      $500
                                                                                      $338

                              $53    $380
                        $0
                              2018   2019          2020      2021          2022       2023       2025         2026        2027

(1) As of 1/31/2018

                                                                                         Q4 2017 EARNINGS   9
ADJUSTED PRODUCTION RECONCILIATION
        CUMULATIVE IMPACT OF MULTIPLE SALES TRANSACTIONS

                                                                              Production with Divestiture Adjustments (1)
                     650

                     600

                     550

                     500

                     450
            mboe/d

                     400

                     350

                     300

                     250

                     200
                                                                                                                                                 (2)
                                                             2016                                          2017                           2018

                                                    Total Production                             Divested Gas Volume   Divested Liquids Volume

(1) Adjusted for sales signed or closed in 2016, 2017 and expected in 2018
(2) Projected 2018 total production volumes represent the midpoint of guidance as of 2/22/2018

                                                                                                                       Q4 2017 EARNINGS     10
RECONCILIATION OF ADJUSTED EPS

                                                                                  CHESAPEAKE ENERGY CORPORATION
                                                              RECONCILIATION OF ADJUSTED NET INCOME AVAILABLE TO COMMON STOCKHOLDERS
                                                                                    ($ in millions except per share data)
                                                                                                 (unaudited)
                                                                                                                 Three Months Ended December 31,
                                                                                                                    2017                 2016
                                                                                                                                                   $/Diluted                          $/Diluted
                                                                                                                                       $           Share(b)(c)            $           Share(b)(c)
                                                     Net income (loss) available to common stockholders
                                                       (GAAP)                                                                   $          309                     $          (740)
                                                     Effect of dilutive securities                                                         35                                   —
                                                     Diluted earnings (loss) per common stockholder (GAAP)                      $          344    $       0.33 $              (740) $       (0.83)

                                                     Adjustments:
                                                          Unrealized losses on oil, natural gas and NGL
                                                          derivatives                                                                      73             0.07                395            0.45
                                                          Restructuring and other termination costs                                         —                —                   3              —
                                                          Provision for legal contingencies, net                                           (73)          (0.07)                 11           0.01
                                                          Impairments of fixed assets and other                                             (5)              —                 43            0.05
                                                          Net gains on sales of fixed assets                                                (3)              —                  (7)         (0.01)
                                                          Impairments of investments                                                        —                —                119            0.13
                                                          (Gains) losses on purchases or exchanges of debt                                 (50)          (0.05)                19            0.02
                                                          Loss on exchange of preferred stock                                               —                —                428            0.48
                                                          Income tax expense (benefit)(a)                                                   —                —                (190)         (0.21)
                                                          Other                                                                              4               —                 13            0.01
                                                     Adjusted net income available to common
                                                      stockholders(b) (Non-GAAP)                                                           290            0.28                 94            0.10

                                                     Preferred stock dividends                                                             23             0.02                 (30)         (0.03)
                                                     Earnings allocated to participating securities                                          1               —                  —               —
                                                            Total adjusted net income attributable to
                                                             Chesapeake(b) (c) (Non-GAAP)                                       $          314    $       0.30 $               64     $      0.07

(a) Due to our valuation allowance position, no income tax effect from the adjustments has been included in determining adjusted net income. Our effective tax rate in the three months ended December 31, 2016 was 35.7%.
(b) Adjusted net income (loss) available to common stockholders and total adjusted net income (loss) attributable to Chesapeake, both in the aggregate and per dilutive share, are not measures of financial performance under GAAP, and should not
be considered as an alternative to, or more meaningful than, net income (loss) available to common stockholders or earnings (loss) per share. Adjusted net income (loss) available to common stockholders and adjusted earnings (loss) per share
exclude certain items that management believes affect the comparability of operating results. The company believes these adjusted financial measures are a useful adjunct to earnings calculated in accordance with GAAP because:
(i) Management uses adjusted net income (loss) available to common stockholders to evaluate the company's operational trends and performance relative to other oil and natural gas producing companies.
(ii) Adjusted net income (loss) available to common stockholders is more comparable to earnings estimates provided by securities analysts.
(iii) Items excluded generally are one-time items or items whose timing or amount cannot be reasonably estimated. Accordingly, any guidance provided by the company generally excludes information regarding these types of items.
Because adjusted net income (loss) available to common stockholders and total adjusted net income (loss) attributable to Chesapeake exclude some, but not all, items that affect net income (loss) available to common stockholders and total
adjusted net income (loss) attributable to Chesapeake may vary among companies, our calculation of adjusted net income (loss) available to common stockholders and total adjusted net income (loss) attributable to Chesapeake may not be
comparable to similarly titled financial measures of other companies.
(c) Our presentation of diluted net income (loss) available to common stockholders and diluted adjusted net income (loss) per share excludes 60 million and 211 million shares considered antidilutive for the three months ended December 31, 2017
and 2016, respectively and thus excluded from the calculation. The number of shares used for the non-GAAP calculation were determined in a manner consistent with GAAP.

                                                                                                                                                                  Q4 2017 EARNINGS                        11
RECONCILIATION OF ADJUSTED EBITDA

                                                                                        CHESAPEAKE E NERGY CORPORATION
                                                                                        RECONCILIATION OF ADJUSTED EBITDA
                                                                                                   ($ in millions)
                                                                                                    (unaudited)
                                                                                                                                    Three Months Ended                              Years Ended
                                                                                                                                       December 31,                                 December 31,
                                                                                                                                     2017        2016                             2017       2016

                               EBITDA (Non-GAAP)                                                                                $           764 $                (199) $              2,376        $       (3,186)
                               Adjustments:
                                 Unrealized losses (gains) on oil, natural gas and NGL
                                   derivatives                                                                                                73                   395                  (354)                   818
                                 Unrealized losses on supply contract derivative                                                              —                     —                     —                    297
                                 Restructuring and other termination costs                                                                    —                      3                    —                      6
                                 Provision for legal contingencies, net                                                                      (73)                   11                   (38)                  123
                                 Impairment of oil and natural gas properties                                                                 —                     —                     —                  2,564
                                 Impairments of fixed assets and other                                                                        (5)                   43                   421                   838
                                 Net gains on sales of fixed assets                                                                           (3)                   (7)                   (3)                  (12)
                                 Impairments of investments                                                                                   —                    119                    —                    119
                                 Loss on sale of investment                                                                                   —                     —                     —                     10
                                 (Gains) losses on purchases or exchanges of debt                                                            (50)                   19                  (233)                 (236)
                                 Net loss (income) attributable to noncontrolling
                                   interests                                                                                                   (1)                    (1)                   (4)                     9
                                 Other                                                                                                          1                      2                    (5)                   —
                               Adjusted EBITDA (Non-GAAP) (a)                                                                   $           706 $                  385 $              2,160        $         1,350

(a) Adjusted EBITDA excludes certain items that management believes affect the comparability of operating results. The company believes these non-GAAP financial measures are a useful adjunct to EBITDA because:
(i) Management uses adjusted EBITDA to evaluate the company's operational trends and performance relative to other oil and natural gas producing companies.
(ii) Adjusted EBITDA is more comparable to estimates provided by securities analysts.
(iii) Items excluded generally are one-time items or items whose timing or amount cannot be reasonably estimated. Accordingly, any guidance provided by the company generally excludes information regarding these types of items.
Accordingly, adjusted EBITDA should not be considered as a substitute for net income, income from operations or cash flow provided by operating activities prepared in accordance with GAAP. Because adjusted EBITDA excludes
some, but not all, items that affect net income (loss from continuing operations) attributable to common stockholders, our calculations of adjusted EBITDA may not be comparable to similarly titled measures of other companies.

                                                                                                                                                                Q4 2017 EARNINGS                         12
CORPORATE INFORMATION
HEADQUARTERS                          PUBLICLY TRADED SECURITIES                                   CUSIP        TICKER
6100 N. Western Avenue                7.25% Senior Notes due 2018                                  #165167CC9   CHK18A
Oklahoma City, OK 73118               3mL + 3.25% Senior Notes due 2019                            #165167CM7   CHK19
WEBSITE: www.chk.com                  6.625% Senior Notes due 2020                                 #165167CF2   CHK20A
                                                                                                   #165167BU0
CORPORATE CONTACTS                    6.875% Senior Notes due 2020                                 #165167BT3   CHK20
                                                                                                   #U16450AQ8
BRAD SYLVESTER, CFA                   6.125% Senior Notes Due 2021                                 #165167CG0   CHK21
Vice President – Investor Relations
                                      5.375% Senior Notes Due 2021                                 #165167CK1   CHK21A
and Communications
                                      4.875% Senior Notes Due 2022                                 #165167CN5   CHK22
DOMENIC J. DELL’OSSO, JR.                                                                          #165167CQ8
                                      8.00% Senior Secured Second Lien Notes due 2022                           N/A
Executive Vice President and                                                                       #U16450AT2
Chief Financial Officer               5.75% Senior Notes Due 2023                                  #165167CL9   CHK23
                                                                                                   #165167CT2
Investor Relations department         8.00% Senior Notes due 2025                                               N/A
                                                                                                   #U16450AU9
can be reached at ir@chk.com                                                                       #165167CV7
                                      8.00% Senior Notes due 2027                                               N/A
                                                                                                   #U16450AV7
                                      5.50% Contingent Convertible Senior Notes due 2026           #165167CY1   N/A
                                      2.25% Contingent Convertible Senior Notes due 2038           #165167CB1   CHK38
                                      4.5% Cumulative Convertible Preferred Stock                  #165167842   CHK PrD
                                                                                                   #165167834
                                      5.0% Cumulative Convertible Preferred Stock (Series 2005B)                N/A
                                                                                                   #165167826
                                                                                                   #U16450204
                                      5.75% Cumulative Convertible Preferred Stock                 #165167776   N/A
                                                                                                   #165167768
                                                                                                   #U16450113
                                      5.75% Cumulative Convertible Preferred Stock (Series A)      #165167784   N/A
                                                                                                   #165167750
                                      Chesapeake Common Stock                                      #165167107   CHK

                                                                                 Q4 2017 EARNINGS       13
You can also read